The plan for the Week of 7/29/2024
Summary
This week will have a number of market moving events which potentially may cause a significant change in the movement of the US primary markets (S&P 500 and Nasdaq 100). It is a week to stay cautious and pick your spots once the market shows it hand.
Potential catalysts for this week include earning announcements from the mega caps stocks. The following will report earnings:
1. AAPL
2. MSFT
3. META
4. AMD
5. AMZN
6. INTC
Additionally, Wednesday will have a FOMC meeting and Friday will have a CPI report.
ES chart
For purpose of illustration the S&P futures are displayed below. The ES chart has touched a long term trend line from the beginning of the October 2023 advance. The yellow circles represent each touch of this trendline.
NQ chart
The NQ futures chart is below. It shows a similar pattern to the S&P futures. The nazdaq has been the primary driver for the advance since November 2023. Much of the move has been fueled by the megacap stocks. Within the last two weeks the growth stocks have sold off. The primary driver of the nazdaq has been the semiconductor group.
Semiconductor chart
The semiconductor chart has broken down below all short term moving averages. The key moving average are the 5 simple moving average, 8 simple moving average, and 20 simple moving average. Price is below all three of these moving averages. For Nasdaq to continue its upware decent, it will need to semiconductors to help fuel the rise.
The SMH weekly chart. This is similar to the nasdaq chart. Note that the semiconductors touched the long term trendline from November 2023.
ES and NQ short term charts.
Summary
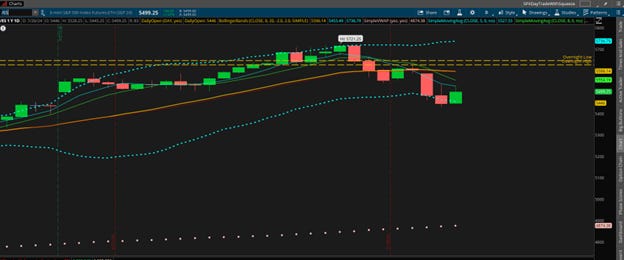
The technical chart shows short term weakness. I define weakness by the price of the security below 5 SMA, 8SMA and 20 SMA. This is illustrated below.
Note the NQ is also below the various moving averages.
The Nasdaq shows relative weakness to the selected moving averages as compared to the S&P.
ES Market Profile Chart
The /ES futures are in balance over the last three days demonstrated by the graphic below. It is range between 5455 and 5355.
Weekly Plan
The expected move for the week is close to 100 points for the week. I will trade in the direction of the market movement.
Scenario 1
If the market breaks above 5455 I will only enter long trades.
Scenario 2
If the market breaks below 5355 I will only enter short trades.
It is also possible that market stays in balance and remains in the trading range.
Good Luck and have a successful trading week.
Joel


