


The plan for the week of 8/18/2024
400 Down followed by 400 up

Summary
After a week in which the S&P 500 dropped to 5120, the following week it made a V shaped reversal. The US markets will see two key events this week. They include:
FOMC minutes on Wednesday.
Federal reserve speech at Jackson Hole on Friday.
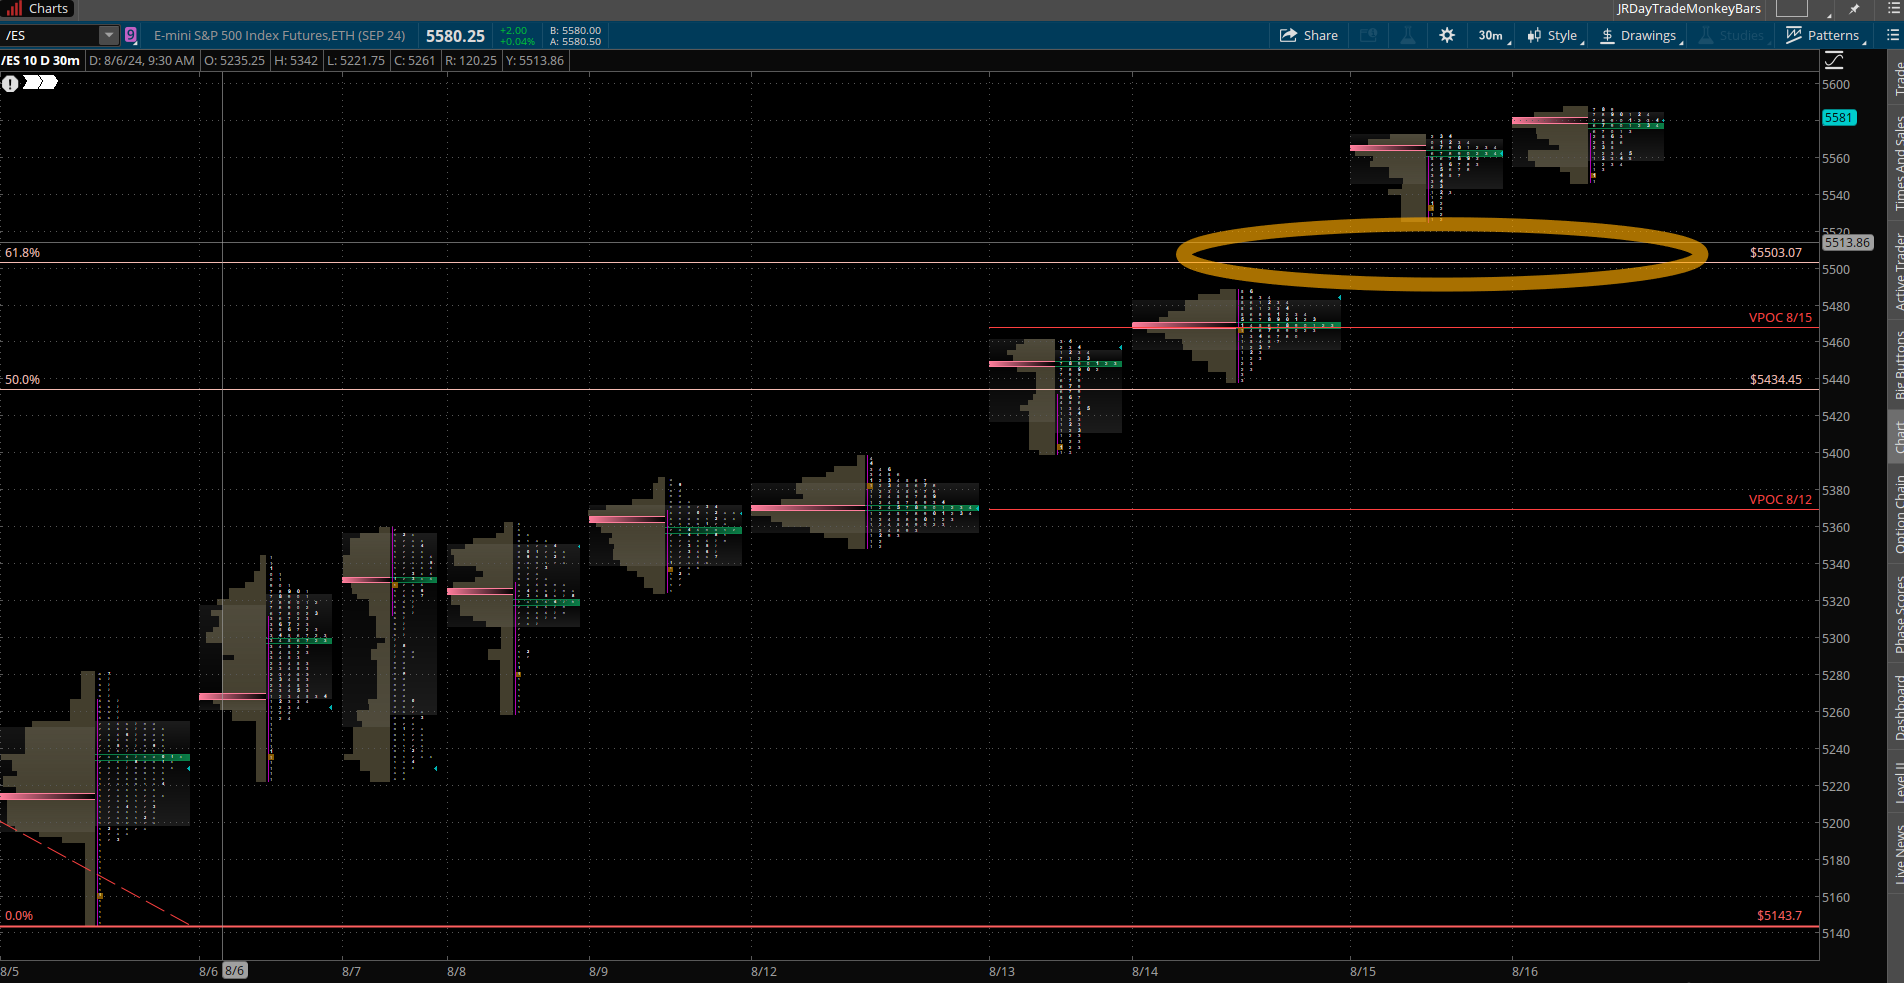
ES chart
For purpose of illustration the S&P futures are displayed below. The ES chart has pushed over the through long term trend line from the beginning of the October 2023 advance. Over the past trading days, it has pushed through all short term moving averages. That is 5SMA, 8SMA, 21SMA, as well above a 50SMA longer term average. This movement has made the market short term bullish. The circled area below represents the gap between 5483 and 5523. Additionally, a fibonoci retracement has been drawn from July 16, to the low found on August 5. The S&P has retraced more than 61.8% of the move indicating that there is a high probability the S&P will hit the all time high once again.

The move over the six days has been straight up, therefore i expect the upward trajectory to continue however at a slower rate of decent. By looking at the volume profile graphic from August 6, we can see the S&P showing the point of control (POC) rising. Indicative of a bullish market. Over the last two days the graphic shows a overlapping to higher move. The POC moved slightly higher implying that the rate of ascent is slowing down. Over this week, i expect S&P to pause and potentially filling the gap below. I will monitor for the movement of whether the gap fills or not for the strength of this recent bullish move.
The option market is projecting a move for the S&P between 5430 - 5730.
.
NQ chart
The NQ futures chart. It shows a similar pattern to the S&P futures. The NQ price sits slightly below its 50 SMA. It is relatively weaker as compared to the S&P. The circle areas represents two potential targets for NQ for this week. The circle below represents the GAP made between 8/14 and 8/15. The upper circle represents a target which is the upper bollinger band.

The semiconductors have been one leading groups for the advance since November 2023.
Semiconductor chart
The semiconductor chart has moved higher much like the S&P and Nasdaq 100. Note for the last two days, it has paused below the 50 SMA.

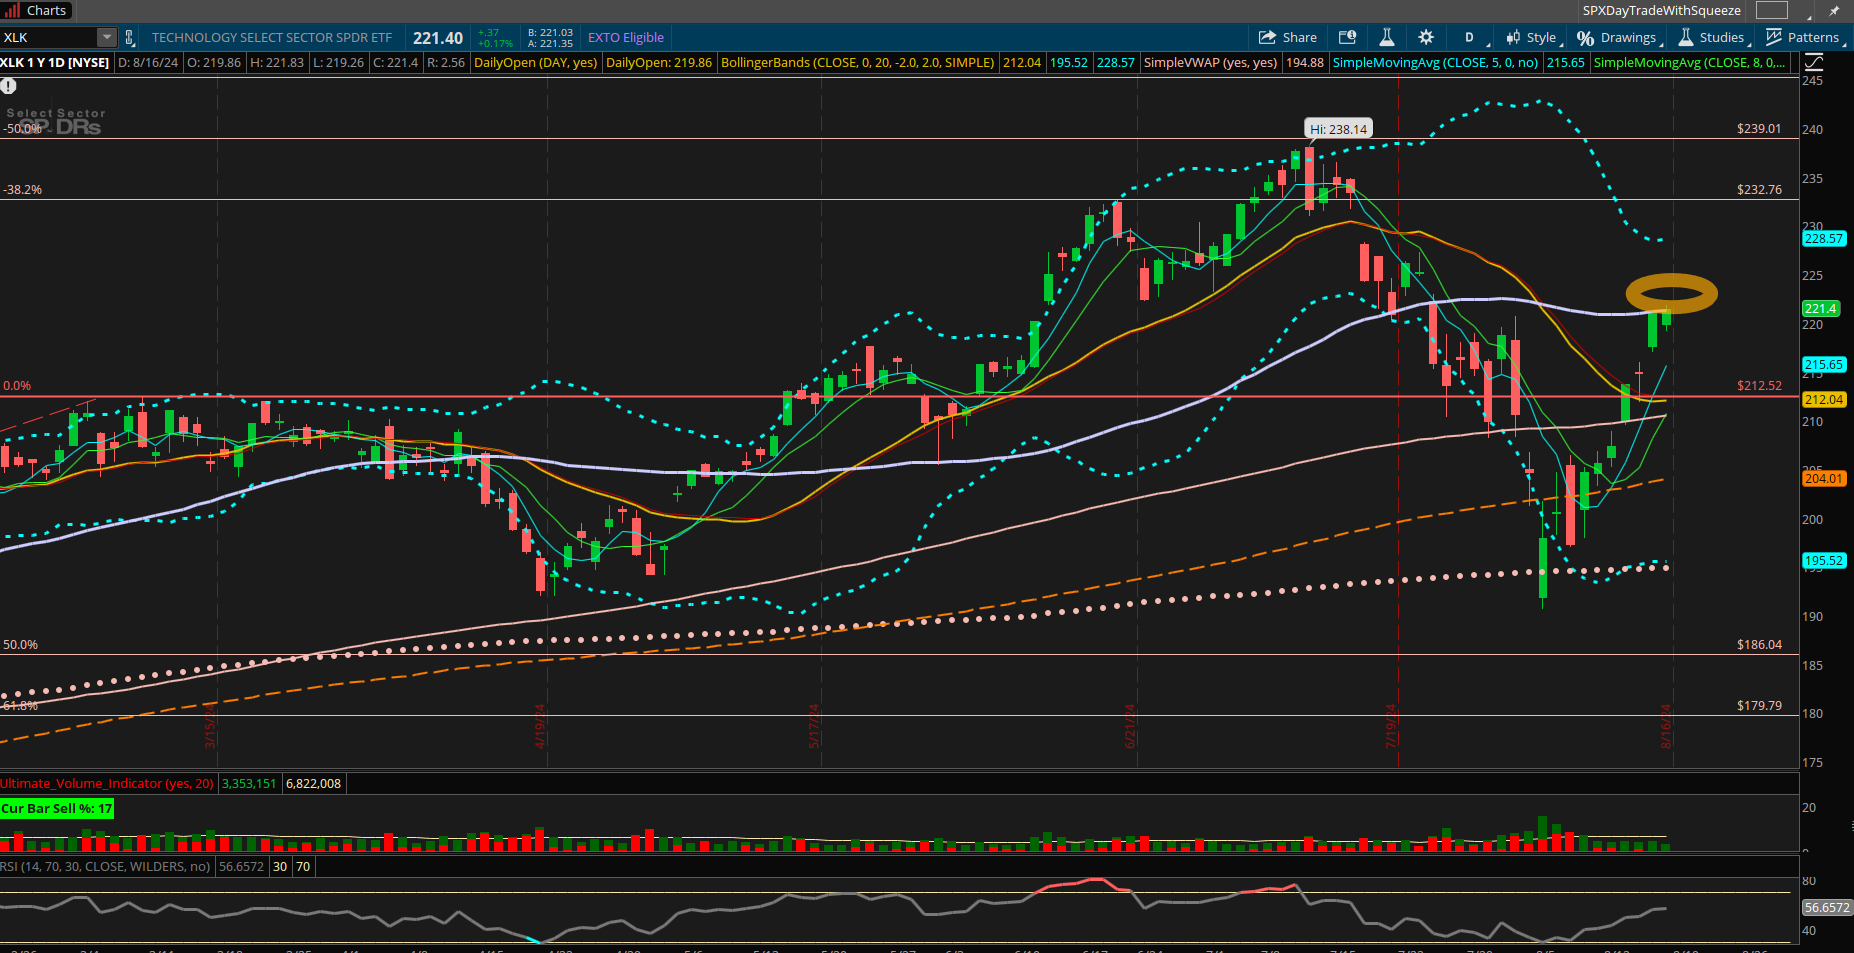
XLK chart
The XLK represents the technology ETF associated with the S&P. It is approximately 32 percent of the S&P. For the S&P to make significant movement higher it will be required for this ETF act more as a leader rather than laggard. Note that for the last two days, it attempted to move above the 50 SMA.
Weekly Plan
The expected range for the S&P is 150 points for the week. The S&P futures have made a “V” shaped reversal over the last 10 trading days. My expectation is for the S&P to pause and slowly move higher.
Scenario 1
If the market breaks above 5580 I will only enter long trades. A target is 5630
Scenario 2
If the market breaks below 5540 I will only enter short trades. A short term target is 5450.
These potential plays are very short term. That is approximately a week.
Good Luck, stay safe and have a successful trading week.
Thank you for reading my weekly plan.
Joel