


The plan for the week of 8/4/2024

Summary
This week should be a relatively quieter week in regard to economic and earnings news. The S&P moved 2.4% lower the previous week. The Nasdaq moved lower by 3.7%. For this week I expect the indicies to mean revert, followed by a move lower later this month.
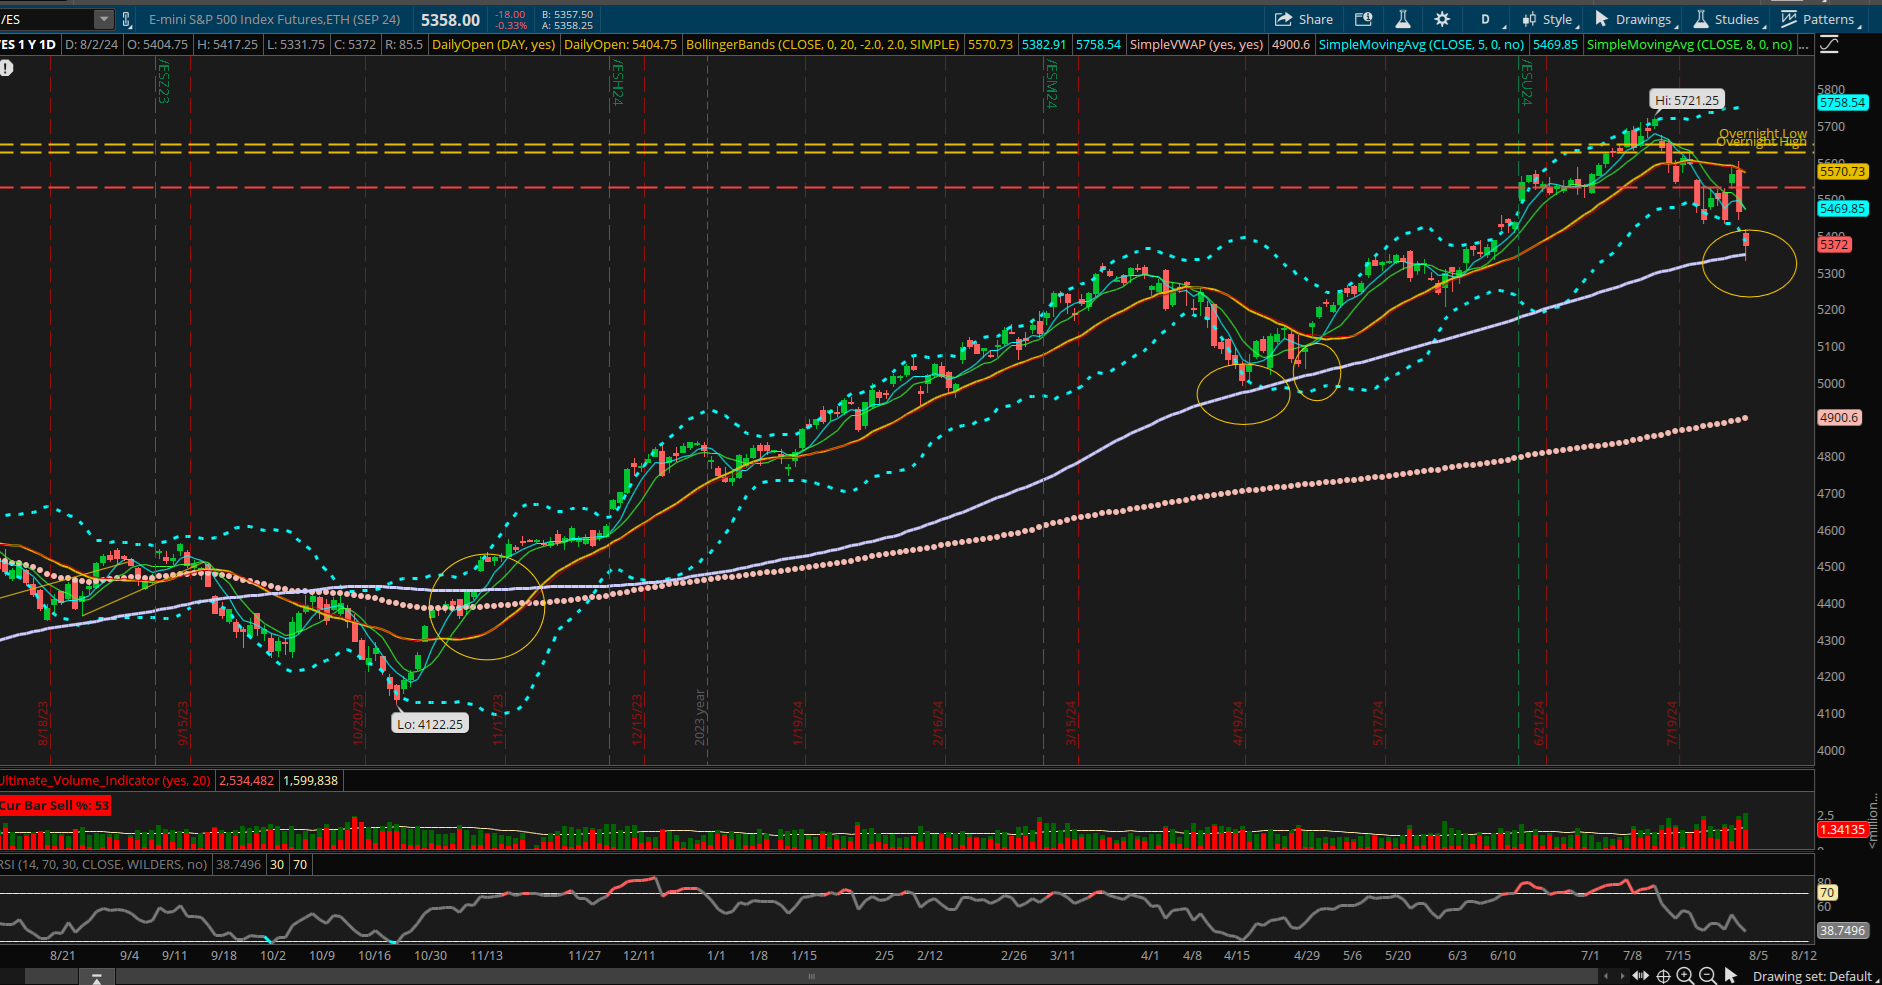
ES chart
For purpose of illustration the S&P futures are displayed below. The ES chart has pushed through a long term trend line from the beginning of the October 2023 advance. On Friday it paused at a previous area of support. This is approximately 5290 – 5330 area. I believe this area that will get tested earlier into the next week
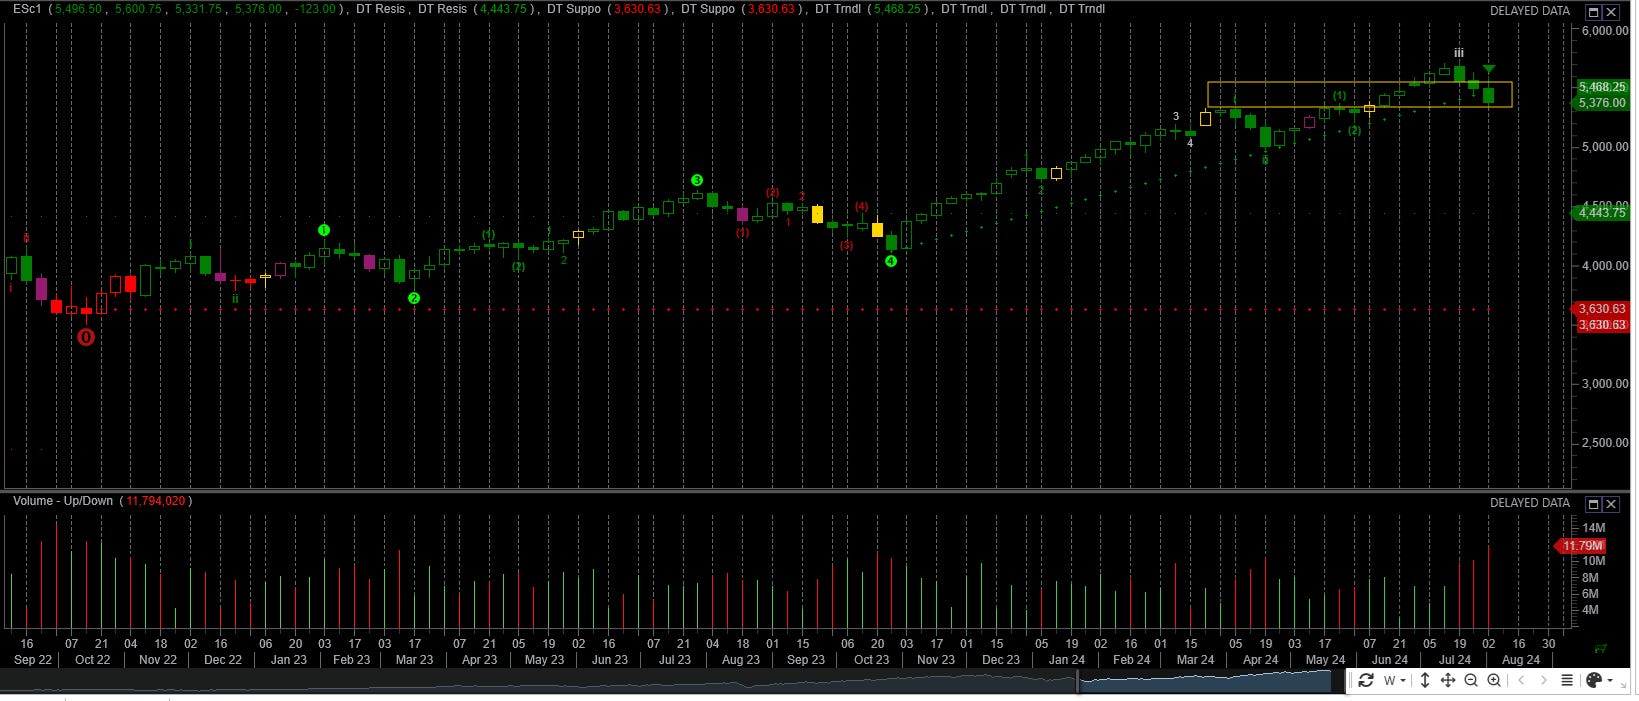
.The market broke down and out of value on Friday August 2. The value area is defined by the range by the 5580 - 5420. A new range is now defined by 5420 – 5330. It should be noted that market gapped below the 5420 area leaving a gap between 5440 and 5420. The strength or lack thereof can be viewed objectively by whether the /ES futures fill the gap or not. A stronger market would fill the gap and move into the upper value area of 5440. Therefore I can view anything below the 5440 area as bearish.
My expectation is that market will attempt to fill the gap prior to going lower.

The circled area on the chart below shows price is near the 100 day simple moving average. In November price jumped over this level. I expect at least a small bounce in this area. Perhaps if price is strong enough to close the gap above before declining lower.
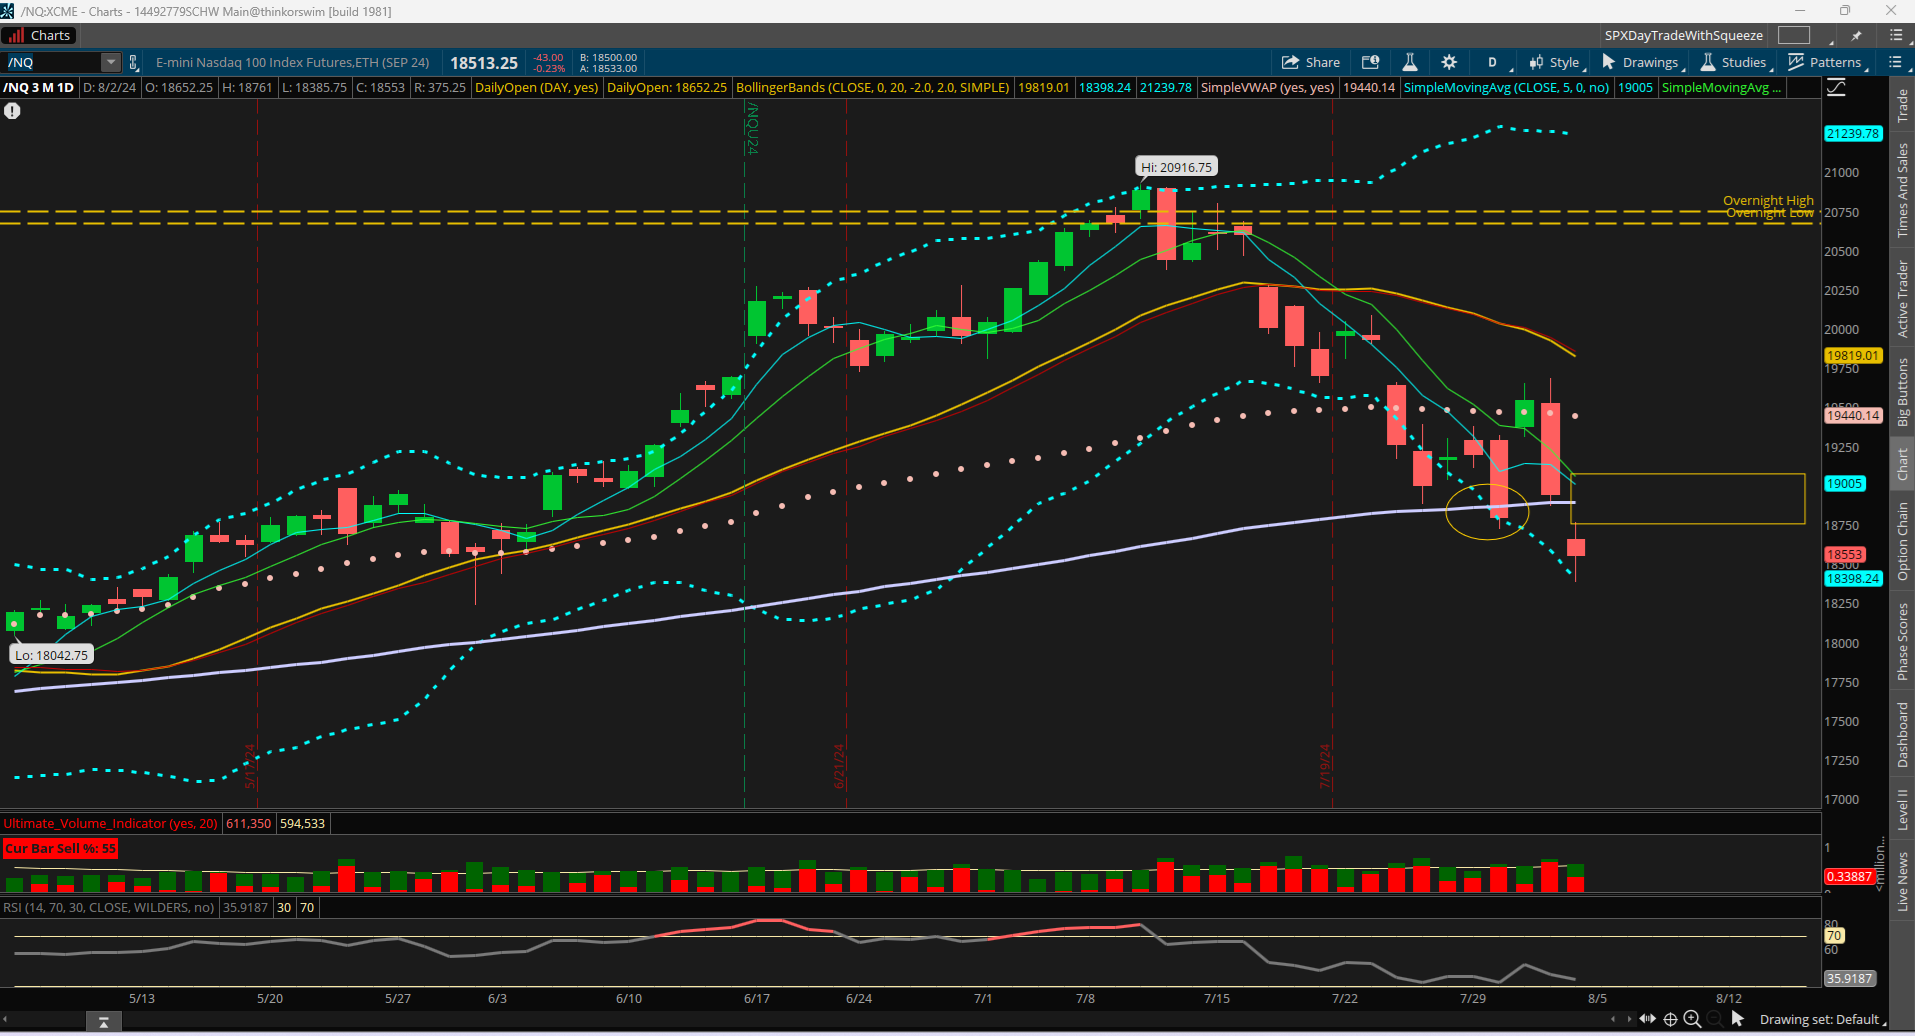
NQ chart
The NQ futures chart. It shows a similar pattern to the S&P futures. The nazdaq has been the primary driver for the advance since November 2023 as well as the decline since mid July. The trendline has been a strong support since November 2023. Comparing the last price bar to the other touches of the trendline it can be observed that most recent is much stronger push.
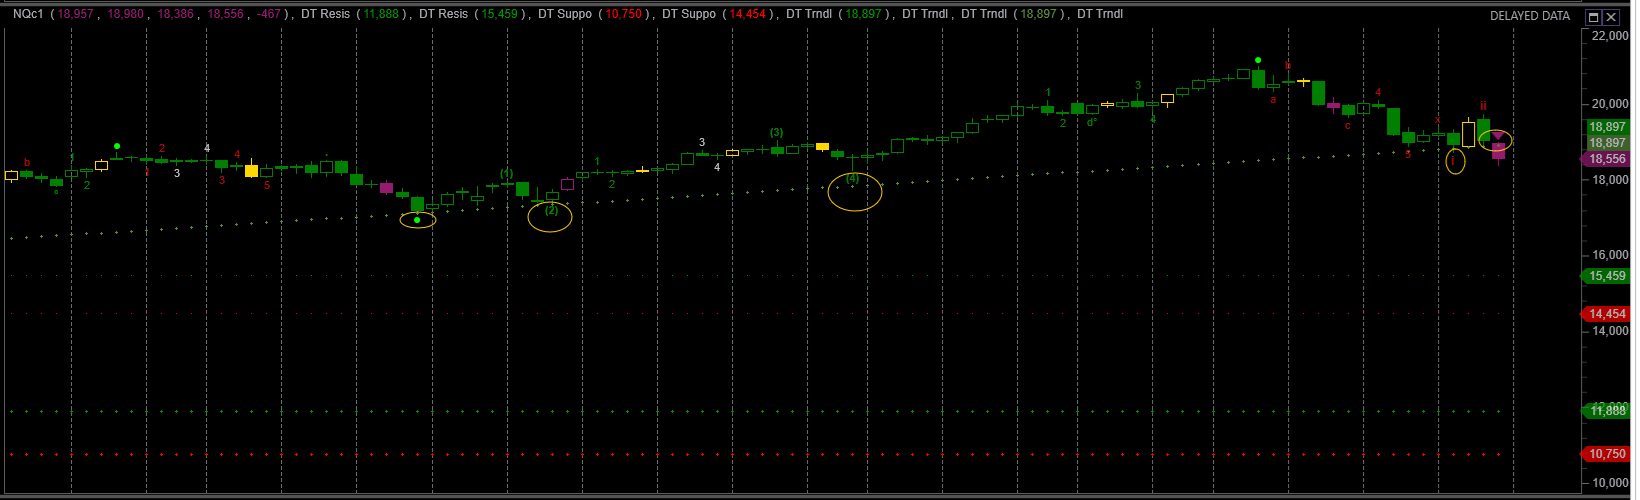
The chart below shows the NQ breaking below its 100 day SMA. The highlighted rectangle shows a potential upward target this week.
The semiconductors have been one leading groups for the advance since November 2023 and now they are leading both the nasdaq and S&P lower.
Semiconductor chart
The semiconductor chart has broken down below all short term moving averages. The semiconductors continue to a lot relative weakness. A second downside gap has formed here. If the semiconductors are strong enough to close the gap we should see some relative strength in the NASdaq. It and S&P. It is noteworthy that the semiconductors broke strongly below the 100 SMA.

The semiconductor weekly chart has broken the longer term trend line. Additionally, it has broken below a support area from April A potential target for SMH is 197. This is lower Bollinger band. This is approximately another 10% down. If you look at the daily chart the gap above is approximately 5% higher.

Weekly Plan
The expected range for the S&P is 280 points for the week. The S&P futures are at a key inflection point which is the 100 simple moving average. This has acted as a support in the past.
Scenario 1
If the market breaks above 5404 I will only enter long trades. A target is 5460 – 5500.
Scenario 2
If the market breaks below 5355 I will only enter short trades. A short term target is 5100 - 5150
These potential plays are very short term. That is approximately a week.
Good Luck, stay safe and have a successful trading week.
Thank you for reading my weekly plan.
Joel