


Weekly Plan for April 13
Last week was a week for the record books. The S&P made a historical 500 point move in a single day; nearly 10 percent. The S&P closed the week higher for the week. I discuss my weekly plan below.

Summary
As pointed out in the previous week, the S&P 500 was extremely oversold and a bounce higher was expected. With volatility high, price has made large swings both up and down.
The S&P 500 trades more like a meme stock (think GME, AMC), rather than a large capitalization index.
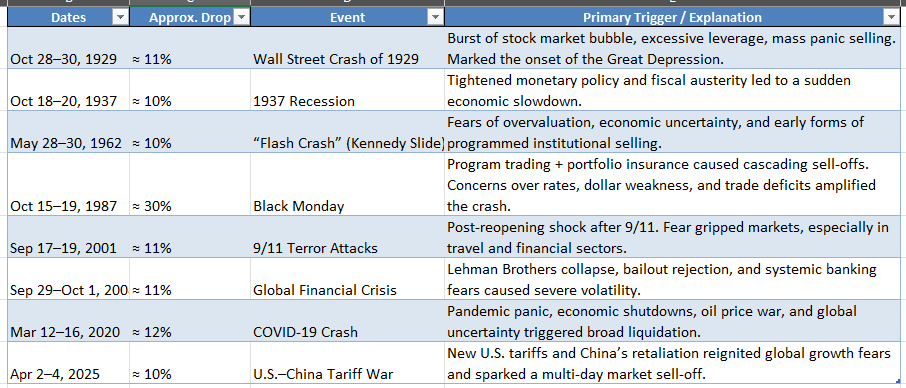
I provided this chart below last week and am including it again this week, for all to understand the historical context of what we are currently observing.
The grid below shows periods in the USA history where the US stock market dropped more than ten percent within a weekly period.
This week the market experienced an historical up move and I have listed the returns after 30, 60, 90 days.
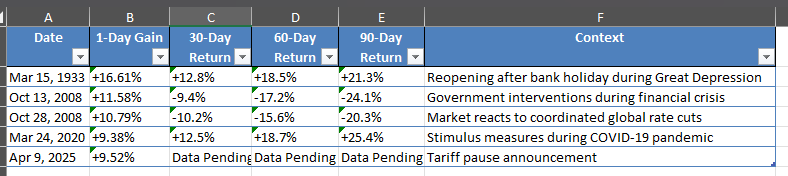
The data lacks any predictive return based on a large single day move. The only significant data point here lies in the historical context of this move as it lists other times in American history where markets have been highly stressed.
Trading this market requires strong risk management as swings are large.
Prior to the market meltdown the S&P 500 had a price to earnings ratio of nearly 28. This is historically high and therefore a market sell was anticipated to some degree. Historically, the average of the S&P was approximately 19. The PE after this current market selloff brings it near 24. If the S&P 500 price moves based on historical norms then price could move to 3885 ( PE of 19). This implies a fair value.
This estimation does not account for any positive and or negative impact of the current administration’s fiscal policy and the federal reserve’s monetary policy. Understand that momentum moves markets in both an upward and downward trajectory.
I trade week to week and am providing context to the average price earnings for the market.
This is the current S&P 500 future’s weekly chart. The price action dates back January 2020.
Last week the S&P touched a long term trend line dating back to 3/2020. The significance is that this trend line has been touched on four separate occasions and bounced higher, showing potential for price action hitting a significant bottom.
This current market is heavily news driven. The point that price has hit such an exact level implies that the S&P may have found a short term bottom.
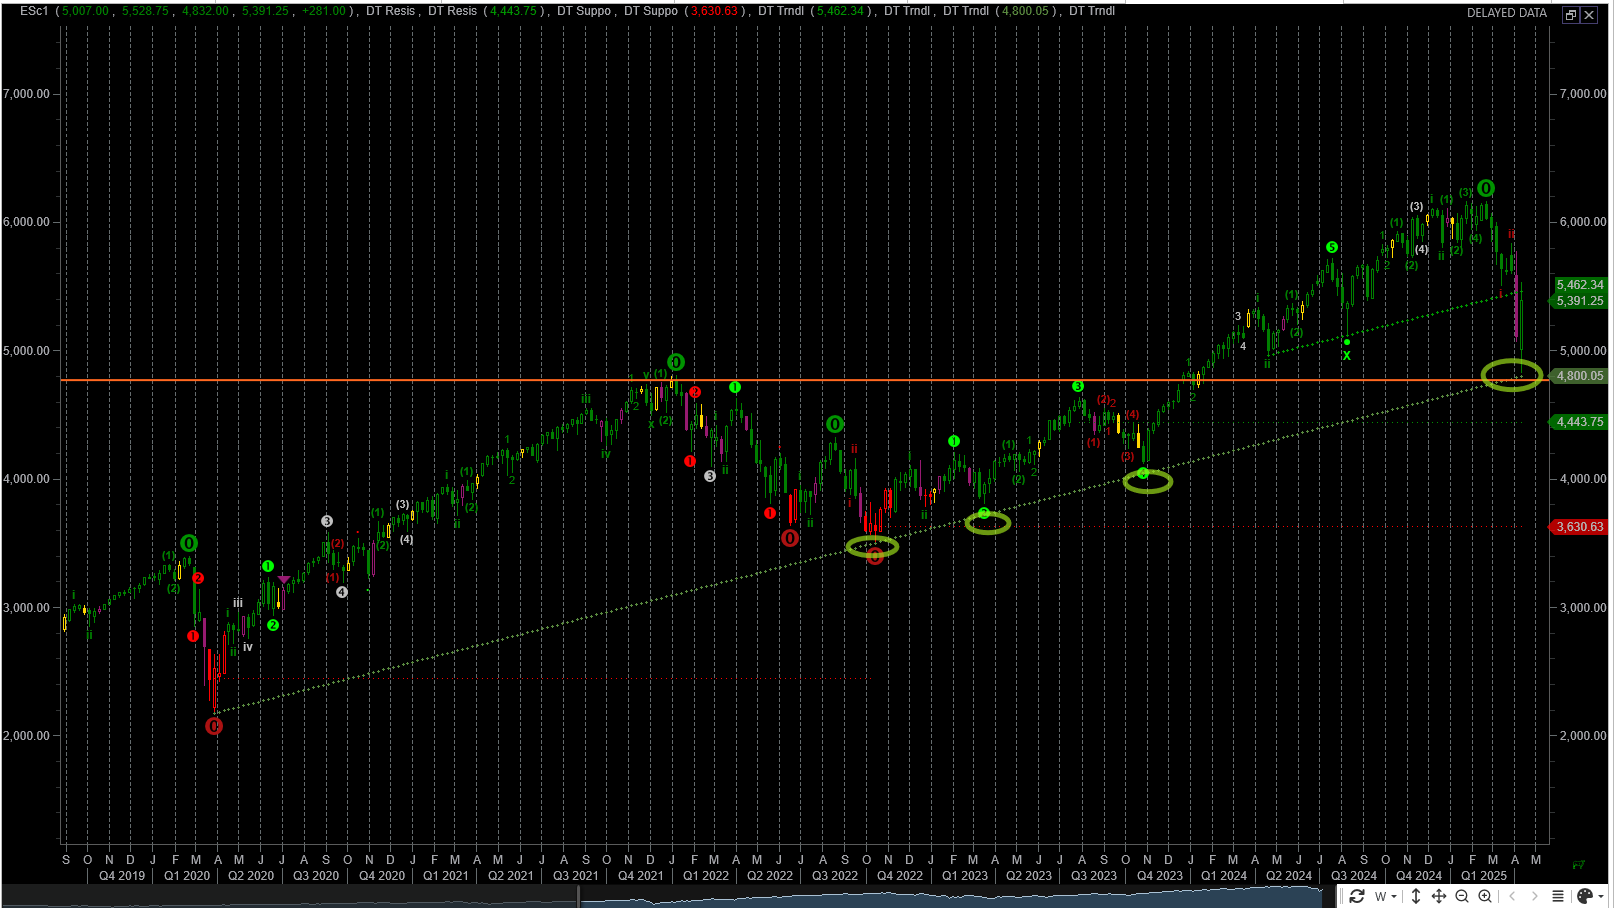
Note, the analysis completed here is using the ESM2025 contract and or the SPX cash index. The future’s contract expires the 3rd Friday of June 2025.
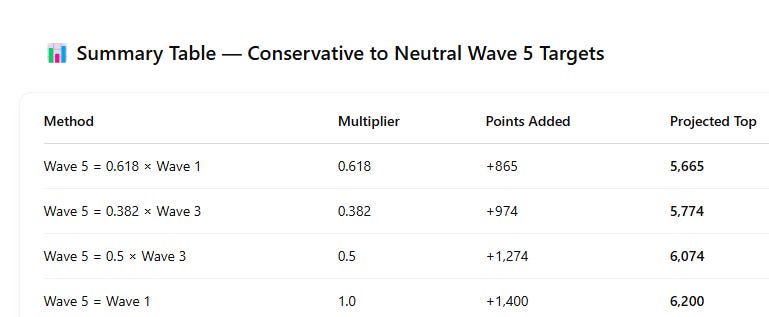
From an elliot wave perspective the S&P 500 is in the final fifth wave move higher before a larger decline. Noted in the chart are potential targets.
When converting equivalent pricing between ESM2025 and SPX (S&P 500 cash index) that difference is approximately 30 points. This price spread declines as it gets closer to ES contract expiration.
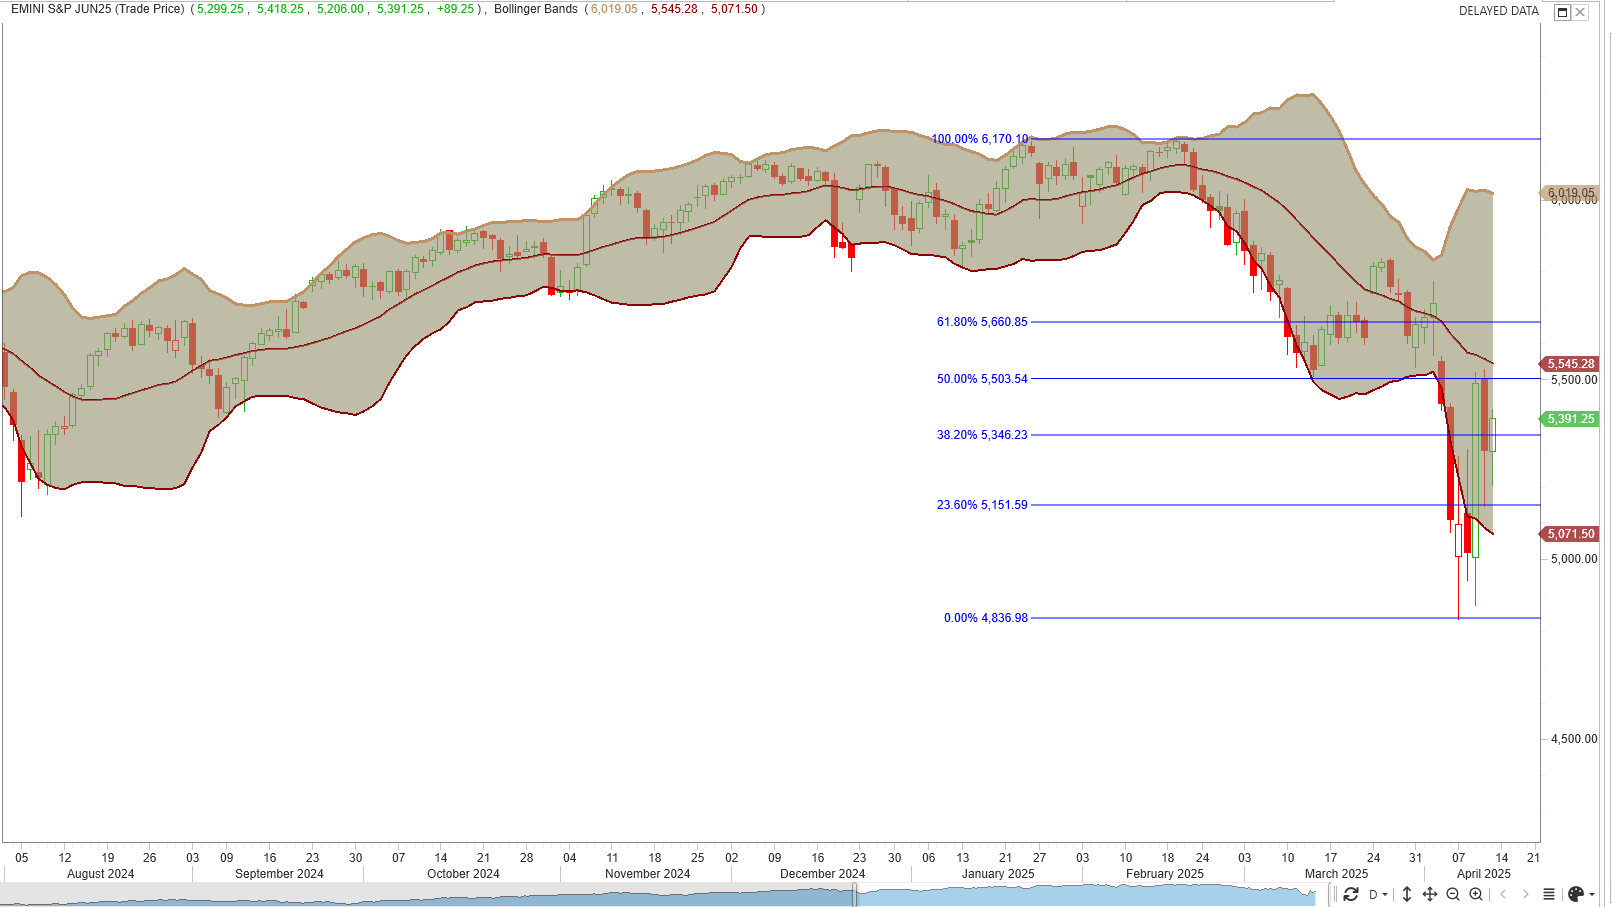
S&P futures with Fibonacci Retracements
This chart shows S&P futures with both fibonocci levels from the most recent high/low and bollinger bands. The chart is using a weekly timeframe.
Bollinger Bands are a popular technical analysis tool that helps traders assess price volatility and identify potential overbought or oversold conditions. For greater insight look here.
I have placed Fibonacci retracements from the high 6170 to the 4838 low. The bands encapsulate 2 standard deviations of price action. Since this is a weekly chart, it demonstrates the longer term bearish trend for the S&P 500.
After the S&P 500 large move down, it is in the process of making corrective move higher. On Wednesday and Thursday of last week, price touched the 50% level of this range.
I have highlighted potential key fibonicci targets:
Key Observation:
🔹 Resistance Cluster Ahead
Between 5,500–5,660 lies:
The mid-Bollinger band
The 50–61.8% Fibonacci zone
Psychological and structural resistance
This region will be a make-or-break zone to determine if price resumes its broader uptrend (potential Wave 5) or stalls into a larger consolidation/correction.
🔹 Support & Rebound Confirmation
Bounce off 4,836.98 (0% Fib) was sharp and decisive, indicating a potential Wave 4 bottom (if in EW structure).
Strong follow-through confirms this as a likely intermediate-term low.
🔹 Current Price Action
Price is now near 38.2% Fib (~5,346), which may act as short-term resistance.
If bulls maintain momentum, the 50% level at 5,503 is the next target, and 5,660 (61.8%) is a critical “decision point” for a trend continuation.
Understand that these price levels are potential targets. Markets donot move in a straight line, therefore expect price to trap higher before a move is made into a lower potential supply zone.
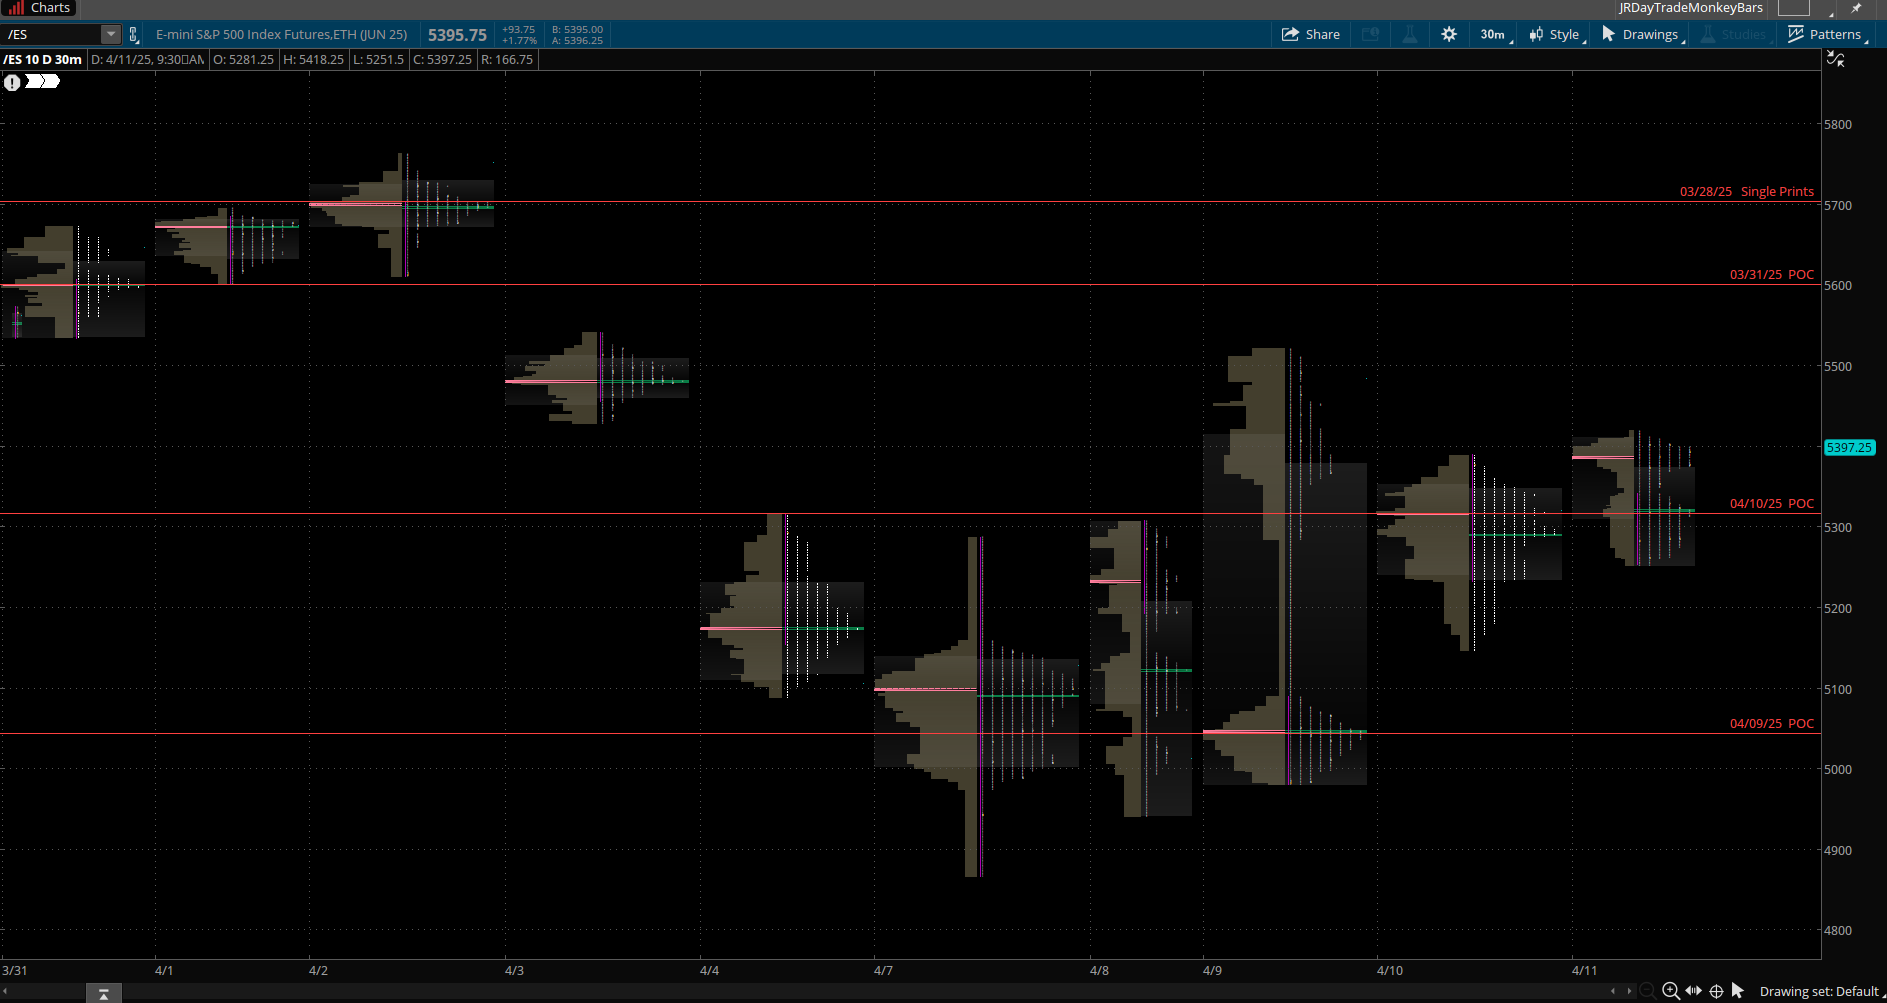
The Volume Profile View
The chart below shows the S&P futures (contract ES) 10 day daily volume profile/market profile chart. The data aggregation is done in 30 minute periods.
🔍 Key Observations
1. Prominent Point of Control (POC) Zones
Over the 10-day range, the POC clusters between ~5,390 and 5,410, suggesting this is the short-term fair value.
The last two sessions show POC shifting slightly higher, indicating short-term buyers gaining control.
2. Value Area Analysis
Value areas are wide in volatile sessions and tighter in consolidation days.
Value areas appear to be building between ~5,360–5,440, which is a key acceptance zone to monitor.
This overlaps with the 38.2% to 50% Fibonacci retracement zone from your previous chart — adding confluence.
3. Single Prints & Excess
There are single prints on the downside (e.g., near 5,070), indicating strong rejection or emotional selling — often a candidate for retests or support zones.
There are also a few thin areas above 5,500, suggesting low volume acceptance zones — if price moves up quickly, these may get filled fast.
4. Balance vs Imbalance
The recent days show a transition from imbalance (trend) to balance (sideways acceptance).
If the market breaks above 5,440 with volume and time acceptance, we could enter a new bullish auction cycle.
Conversely, rejection from the top of value (~5,440) may result in a move back toward lower support areas like 5,300 or even 5,150.
The Volume Profile View ( 10 days )
The chart below shows the S&P 500 futures volume profile for the last 10 days aggregated by 30 minute periods. I am showing the candlesticks on the left with the profile histogram on the right.
The area boxed in on the right is the value area for the last 10 days. As you may recall the value area contains 70 percent of the trading volume for the period with the point of control indicating the highest area of volume.
The S&P futures are within the 10 day value area.
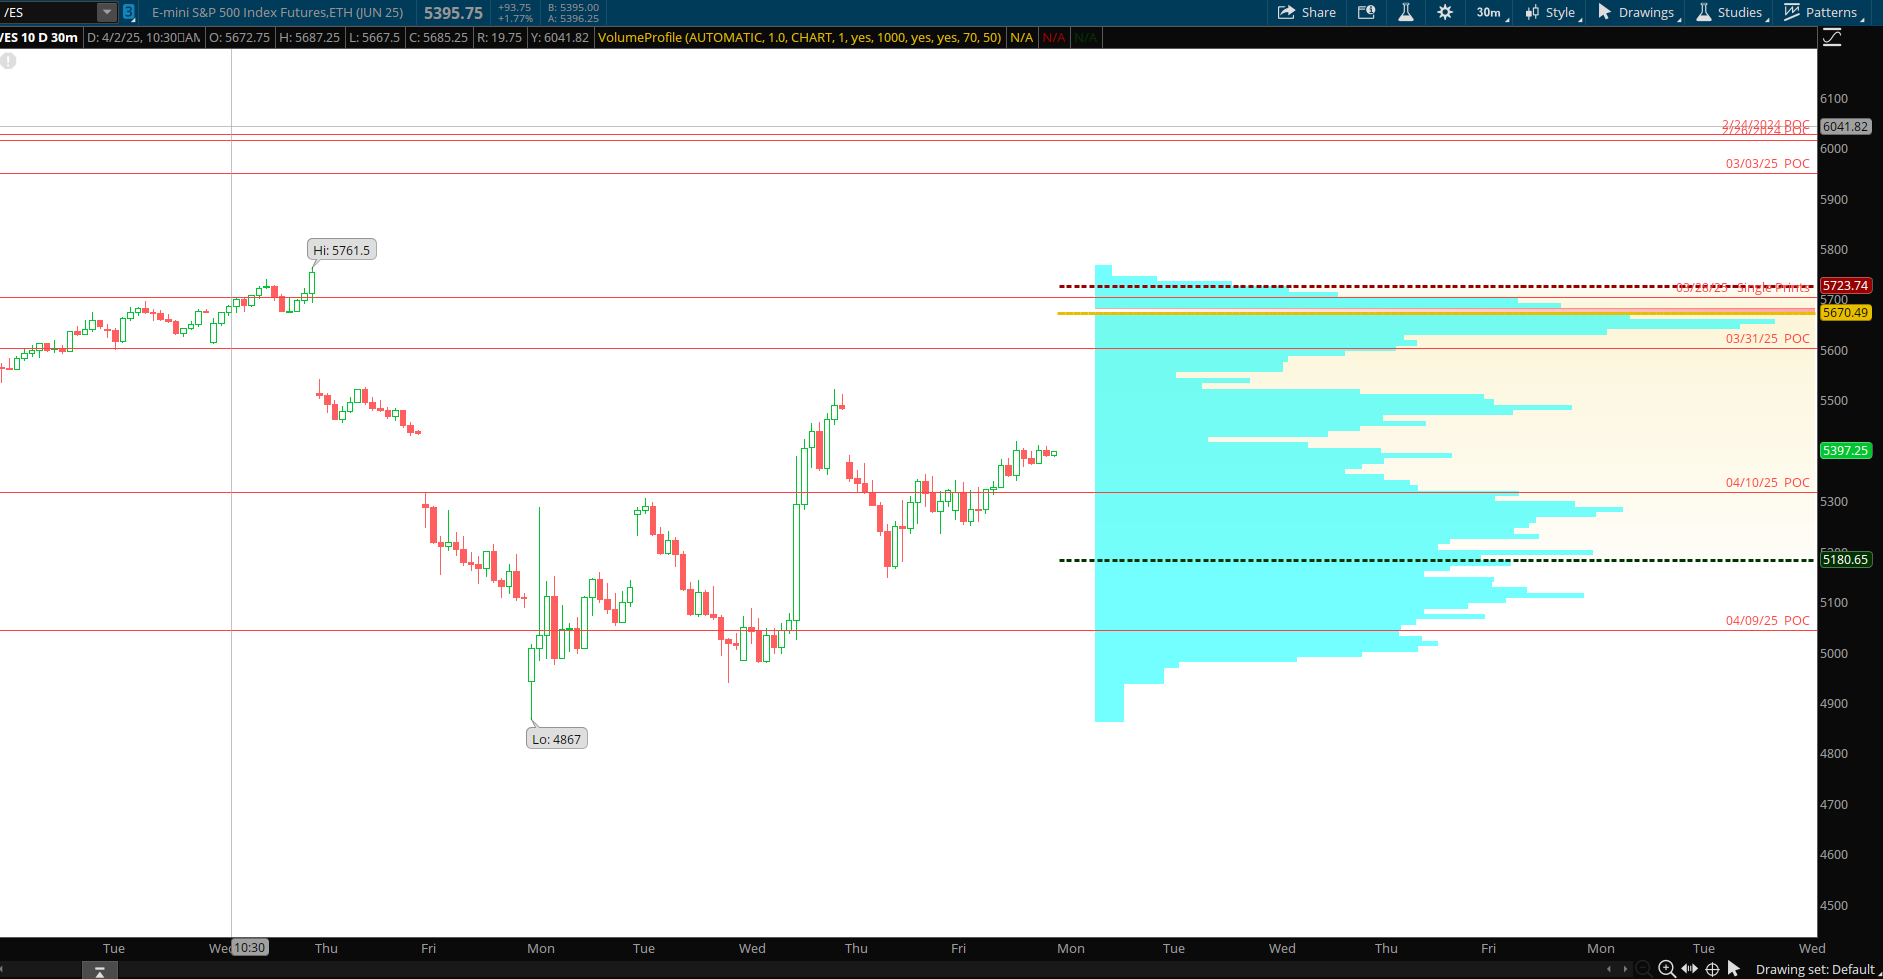
Volume Profile Breakdown (10-Day Composite)
🔍 Zone Breakdown & Trading Implications
🔸 POC: 5670
Highest volume transacted → short-term fair value
Currently acting as a pivot level
Holding above this signals buyers are in control
A breakdown below would likely trigger a test of prior demand zones (e.g., 5070, 4867)
🔸 Value Area Low: 5173
Lower bound of fair value
Strong support zone — rejection here suggests demand remains firm
A close below implies price is being accepted in a new lower distribution → bearish tone
🔸 Value Area High: 5725
Key resistance
Also coincides with single print zone from 3/28 and the upper boundary of previous supply
Expect sellers to defend this area unless there's a strong catalyst
Acceptance above this = new bullish leg likely begins (targets could include 5900+)
Read about market profile and auction market theory here.
S&P 500 futures hourly chart
This chart shows the last 60 days of trading price action. The chart shows heikin candles using a 65 period simple moving average. Price is currently approximately 7 percent below this moving average.
Over the last 4 - 5 months this area acted as good area of short term support or resistance.
Last week, I pointed this chart as a potential area where price could revert to the mean. The top of last week’s price range was 5505.
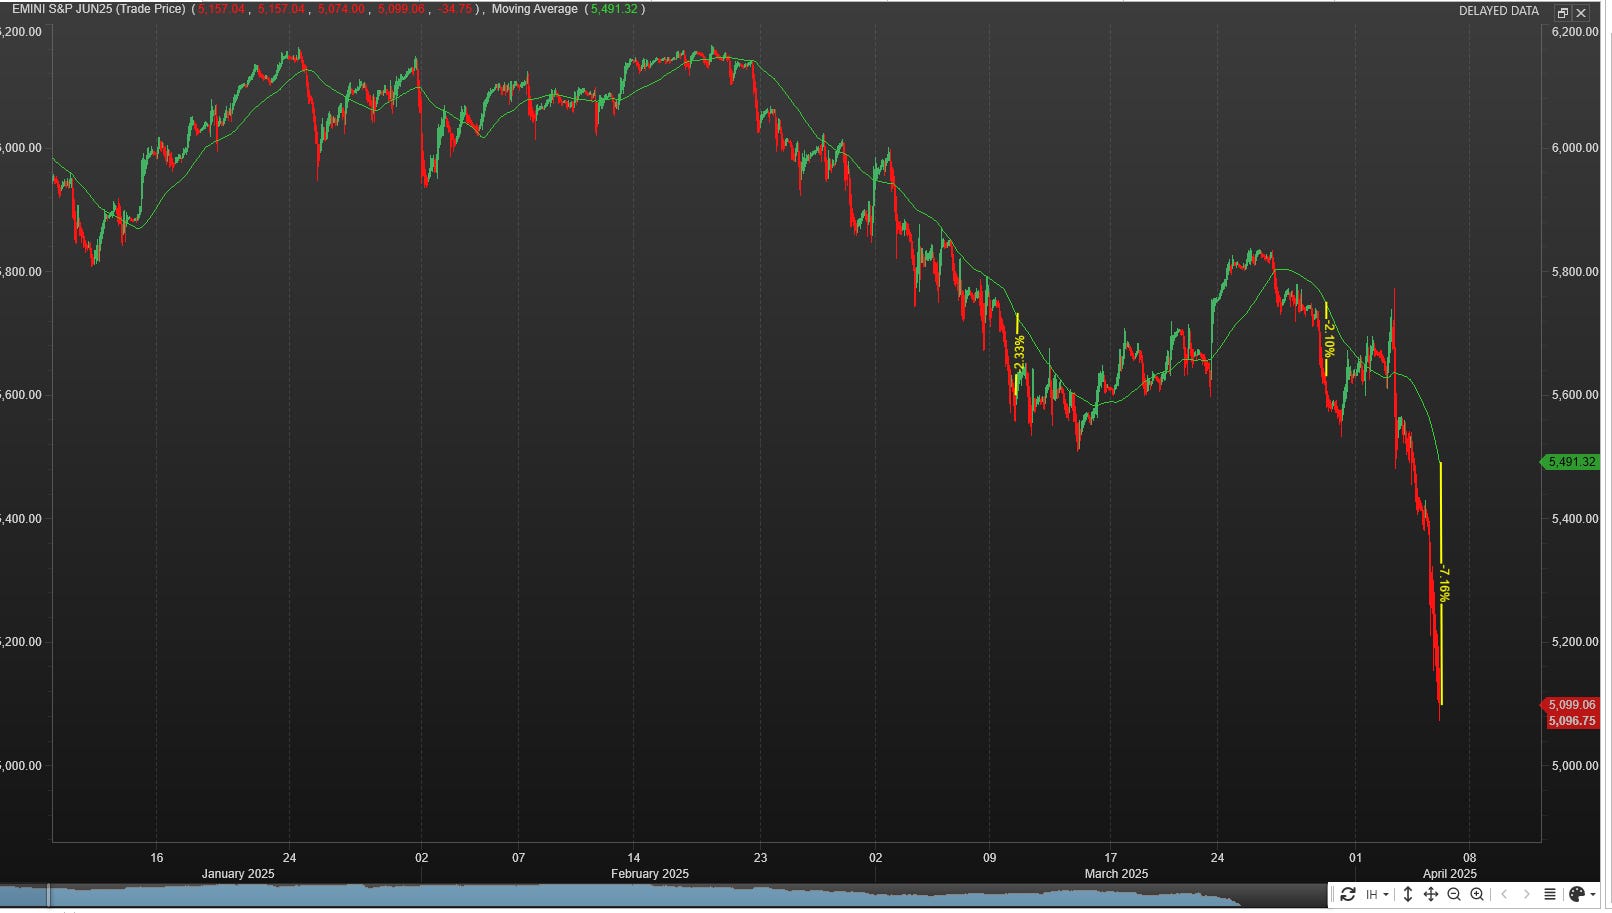
The chart shows the current heikin candles using a 65 period simple moving average. For a bullish continuation move, expect price to stay above the 5180 - 5200 price zone this week.

Management of last week’s plan
Going into last week, I was long a position in TQQQ. This is a leveraged ETF that tracks the nazdaq 100.
Additionally, each week I sell calls for credit via broken wing buttefly strategy. I wait for a short squeeze and sell above.
Going into this week, I am not in any short term trades.
You can review all of my posts here.
The MenthorQ SMILE curve
The MenthorQ skew smile curve chart of the S&P 500 cash index.

1. Put Skew Remains Elevated
The left tail (far OTM puts, strikes ~3500 and below) shows extremely high IV, especially on the 1-month ago curve.
Implied volatility at these strikes exceeds 150%–200%, indicating extreme demand or risk perception for crash protection.
This left-skew has flattened recently, especially on today’s curve vs. 1M ago — suggesting some easing of crash fear.
2. Near-the-Money (NTM) Implied Vols Have Compressed
IV near the current spot (~5800–6200 range) is relatively lower today (green) than 5D and 1M ago.
Implies less fear or uncertainty around the current price range.
The IV smile appears shallower, which is typical after strong rallies (like the >9% gain on April 9).
3. Call Wing Shows Uptick
The right tail (OTM calls, strikes >6500) shows an uptick in IV over the last 5D and yesterday.
The green curve (today) shows modestly higher IV than 5D ago in the far call wing.
This could indicate interest in upside hedging or speculation, often associated with "chase-the-breakout" behavior or short covering.
Long Term rates (10 year Treasury)
After the FOMC cut rates (December 2024 .25 basis point cut) there has been a steady Rates peaked in the first week of January 2025. The yield is currently at 4.45.
At the most recent meeting FOMC left rates unchanged. The fed-fund watch tool shows that there is a 20% probability that short term rates will get lowered by 25 basis points at the next meeting in May.
I have placed bollinger bands around the price action.

🔁 SPX Correlation

S&P 500 Term Structure
The chart below shows the $SPX term structure. The green line shows today’s term structure. It is lower compared to yesterday however still higher relative to last month.
The short-term IV spike over the next few days suggests continued risk. Over the next few weeks the term structure suggests that volatility will get sold. Volatility declining suggests that SPX puts are getting sold, and an up-move will continue.

I list the major events below.
S&P 500 Cash Gamma levels
The chart shows four different GEX chart with the highest level of GEX. Market participants are mostly positioned bearish. GEX identifies areas on the chart where PUT and CALL volume exist at various strikes ( price levels).
Monday and Tuesday, shows that positioning has a much higher bullish context. By the 4/17 GEX is fairly negative and customers are positioned short into the end of the week.

The market maker implied move for the S&P futures this week is +/- 251 points. The futures closed at 5396, therefore the market maker expected range is between 5647 to 5145.
📅 April 17, 2025 – Highest GEX Expiry (Bottom Left)
GEX: -24.46% → Strongest negative gamma of the set
Call resistance: 5640
Put support: 5200
IVL: 57.00 → Extremely high implied vol
Implication: This is the main risk window.
Dealers are deeply short gamma → must buy high/sell low to hedge → volatility amplification.
Large positioning could create pinning near max pain (5200–5400) or extreme dislocation if SPX breaks key levels.
Expect high intraday swings into this expiration.
Dealer Context

US Market Moving Events for the current week
I have listed the events in the order of significance (highest to lowest).
For the week of April 14 to April 18, 2025, several key economic events and notable earnings reports are scheduled in the United States. This is also a holiday shortened week (Good Friday).
📅 Economic Data Releases
Wednesday, April 16
Retail Sales (March): A critical indicator of consumer spending, with forecasts suggesting a 1.2% increase. This data will provide insights into consumer behavior amid recent economic uncertainties.
Industrial Production & Capacity Utilization (March): Expected to show a 0.7% rise in production and a capacity utilization rate of 78.2%, reflecting manufacturing sector health. MarketWatch
Homebuilder Confidence Index (April): Anticipated to register at 39, offering a glimpse into the housing market's outlook.
Thursday, April 17
Initial Jobless Claims (Week Ending April 12): Projected at 223,000, this figure will shed light on the labor market's resilience. X (formerly Twitter)+1MarketWatch+1
Housing Starts & Building Permits (March): Forecasts suggest 1.5 million housing starts and 1.46 million building permits, indicating construction activity levels. MarketWatch
Philadelphia Fed Manufacturing Survey (April): Expected to come in at 12.5, providing regional manufacturing insights. MarketWatch
💼 Corporate Earnings Reports
Monday, April 14
Goldman Sachs (GS)Investopedia+1Interactive Investor+1
M&T Bank (MTB)MarketWatch+3Investopedia+3Interactive Investor+3
Tuesday, April 15
Bank of America (BAC)MarketWatch+2Interactive Investor+2Investopedia+2
Citigroup (C)investors.com+5Investopedia+5Interactive Investor+5
Johnson & Johnson (JNJ)Interactive Investor
PNC Financial Services (PNC)Investopedia+1Equals Money+1
Albertsons Companies (ACI)
Rent the Runway (RENT)
JB Hunt Transport Services (JBHT)
Interactive Brokers (IBKR)
Wednesday, April 16
Abbott Laboratories (ABT)Interactive Investor
Morgan Stanley (MS)
Thursday, April 17
Netflix (NFLX)Investopedia
Taiwan Semiconductor Manufacturing Company (TSMC)Investopedia
UnitedHealth Group (UNH)Investopedia
American Express (AXP)Investop
🏛️ Federal Reserve Activities
Monday, April 14: Philadelphia Fed President Patrick Harker speaks at 6:00 PM ET, followed by Atlanta Fed President Raphael Bostic at 7:40 PM ET. MarketWatch
Wednesday, April 16: Cleveland Fed President Loretta Mester is scheduled to speak at 12:00 PM ET.
Friday, April 18: San Francisco Fed President Mary Daly will speak at 8:00 AM ET. MarketWatch
Anytime During the week
Potential Commentary or Speeches from the US President
– Look for any remarks by the United States President and or high ranking cabinet officials which may move the market. This is NOT date specific.
These events collectively offer a comprehensive view of the current economic landscape, encompassing monetary policy, corporate performance, housing dynamics, and consumer behavior. Investors and analysts will closely monitor these developments to inform their strategies and forecasts.
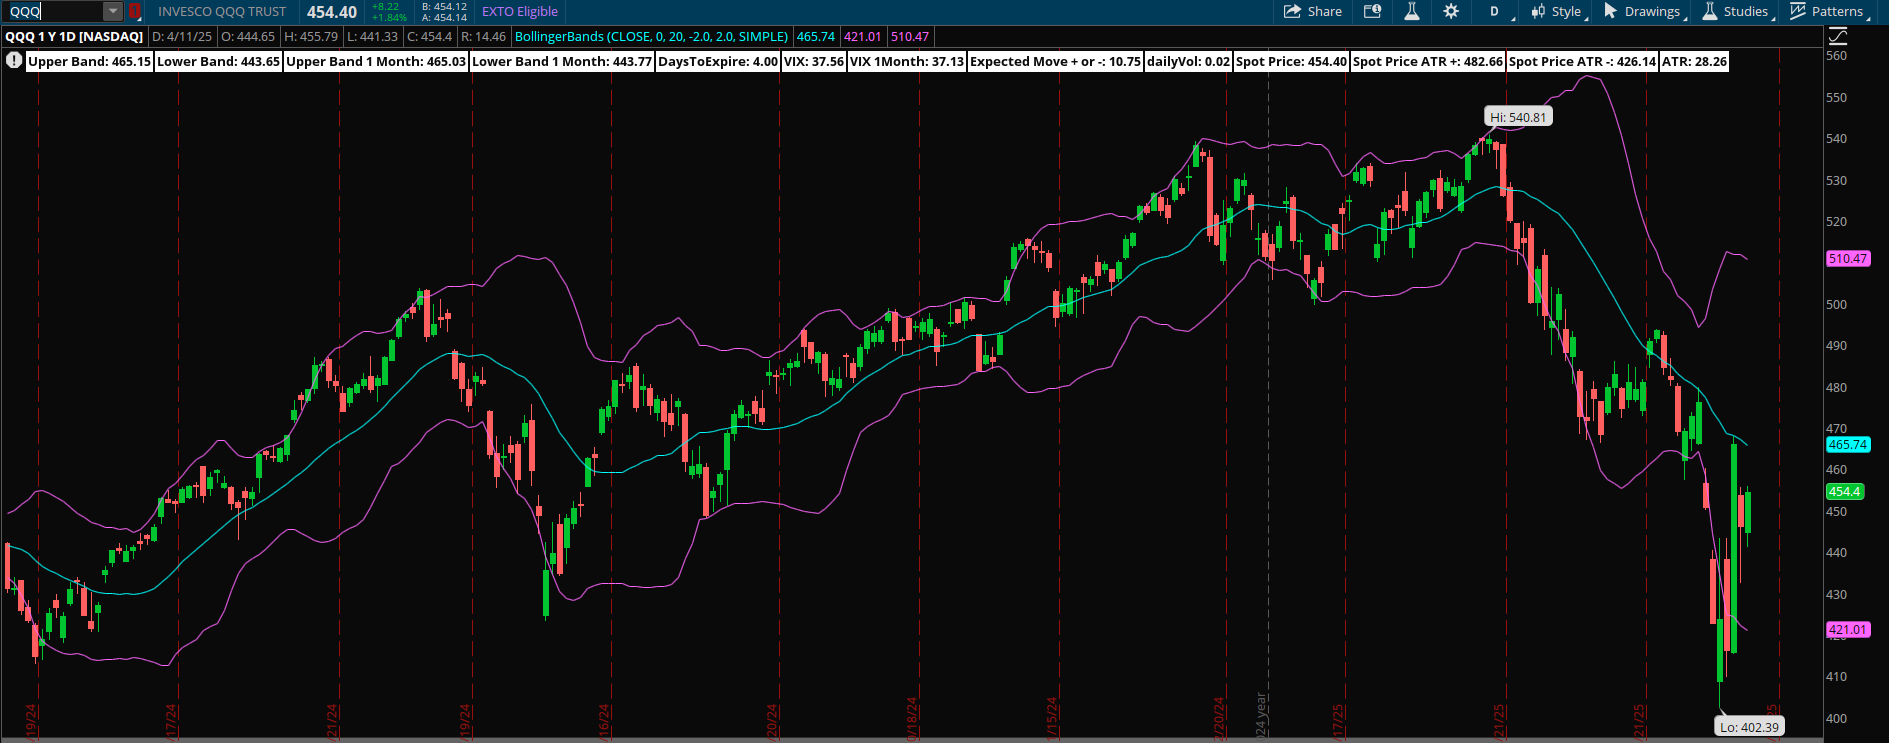
QQQ Weekly Chart
Looking at the QQQs or the Nasdaq100 futures are an important part of my trading plan. The XLK (technology ETF) represents a 33% component of the S&P500. Therefore I use this as an indicator to trade the S&P 500. QQQs closed at 454.
A potential upside targe is 460 - 470 where price ties into a moving average.
QQQ Gamma levels
The chart below shows the positioning information for QQQ. Current GEX profile is showing a slight negative gamma environment. Currently price is 454. The key inflection point is 470 (high volume level).
Note that the high volume level coincides with the 20 day simple moving average listed in the previous chart.
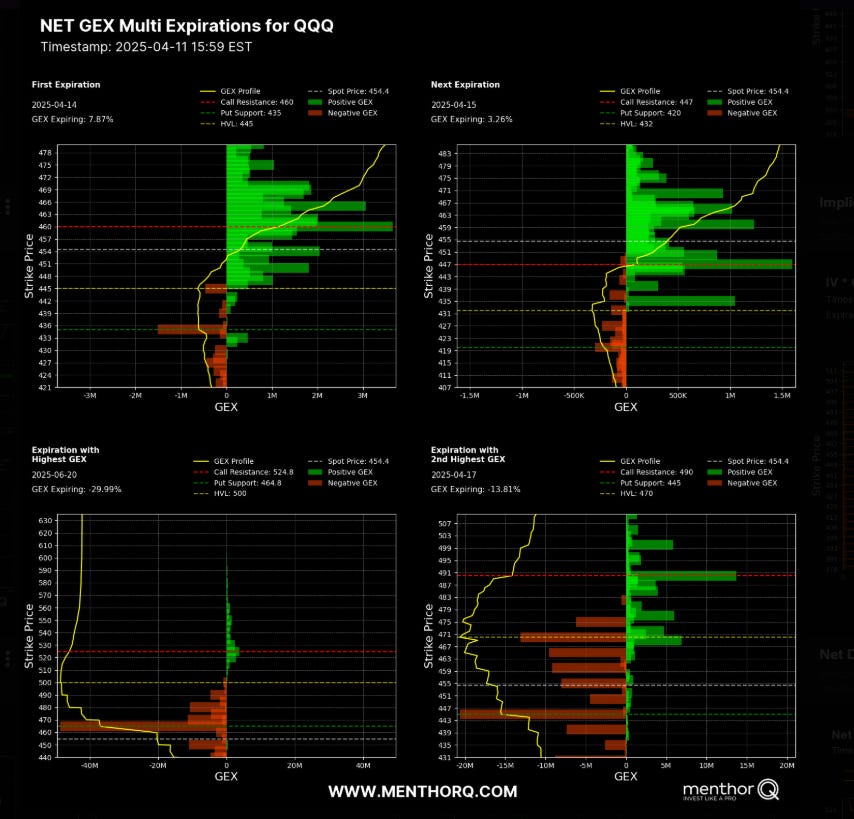
📅 3. April 17, 2025 (Bottom-Right) — 2nd Highest GEX
Net GEX: -13.81% (Negative gamma)
Call Resistance: 490
Put Support: 445
HVL: 470
Interpretation:
Shift into negative gamma zone → dealers now exacerbate movement instead of damping it.
Expect volatility expansion around this expiration.
If QQQ approaches 445 or 490, expect accelerated directional movement.
The Weekly Plan and trading idea
My general strategy for the current market is limit the weekend exposure to the market. With that being said, I am generally more than 75 percent in cash on any given weekend.
With the details I provide above, I pick my spots of trade entry judiciously. I spend large amount of time analying the S&P 500 and I am trading spreads in this market. As the market has been mostly down, I look to exploit large upward spikes in CALL premium. I will structure trades as broken wing butterflys where I am a net seller of call premium. This article gives a general idea of the trade strategy.
Structuring of trades this way, allows the trade to work in two different ways:
I collect a credit premium upon trade entry. If the market continues to fall then the trade wins via credit collection.
I am selective in picking the long strike and short strike of the trade, such that if a gamma squeeze occurs, the short call will have neglible impact.
I am mindful of the fact that the market can squeeze much higher then I initially accounted for. In this situation, I adjust the middle strike higher to mitigate risk providing more room for the trade to work. As the trades are short term 3 - 10 days out, I attempt to exploit option time decay (theta). Market don’t move in a straight line up or down and I count on this concept as part of my edge in trading.
If the above point does not mitigate risk sufficiently, and the market continues to squeeze than I will simply close the trade.
My strategy also includes trading small as well as different dates to mitigate risk.
In trading, it is fool hardy to believe that every trade will win. I am mindful of this fact and constantly monitor my risk. I am playing the long game and I understand that losses are part of the game!
One additional idea is to buy a calendar spread in SPX for thursday expiration. This would capitalize on the high volatility for the week and short time to expiration.
SPX - Key Weekly Levels

Have a successful trading week, by waiting for your trade setups to come to you. Always manage your risk and understand what you expect to lose prior to trade entry. By managing risk, you unlock profitability.
Remember to size down your trades, as volatility is high!
Gamma Level data (netgex data) and skew data (market sentiment) was provided by menthorQ.com
How I trade
I did a number of presentations of my trading process with menthorQ. You can find them here. This is under the highlights section of my “x” account found here.
Follow me on X formerly twitter . I post my market view during the week.
Disclaimer
Please don’t follow my idea(s) blindly. Do your own due dilligence before you attempt to trade. Always manage your risk.
Thank you for reading my weekly plan.
Joel
