


Weekly Plan for April 27
Last week was a strong week with the S&P moving higher 8 percent off the lows.

Summary
Over the last week, volatility has declined as the S&P 500 with price moving higher. Breadth on NYSE was very strong for the week with the S&P showing 4 consecutive updays for the week.
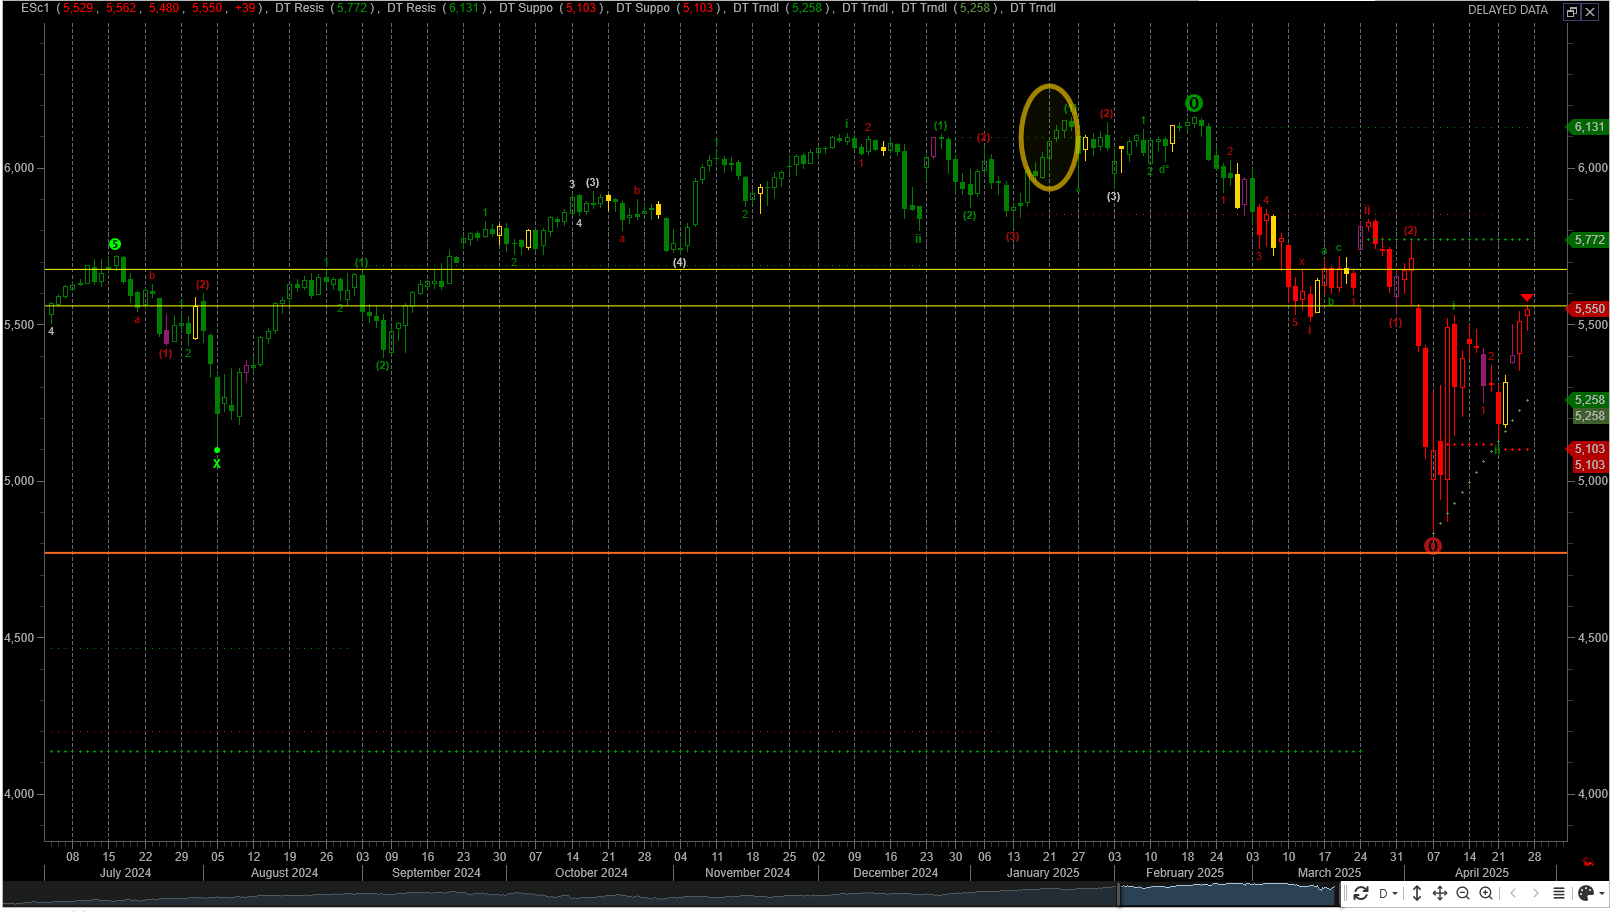
Shown below is the long term S&P 500 future’s weekly chart using a trendline dating back to March 2020. A couple weeks ago this trendline was touched. For now the 4832 area appears as a secure low.
The last time the S&P 500 notched four straight daily gains was January 20–23, 2025, when it rallied each session from Monday (the Inauguration day) through Thursday of that week. That 4 day rally was the peak for this year. This area is highlighted on the chart below.
The large move last week touched a major supply zone (5550 - 5650). For now, I still view the price action as a short cover rally. Short term I see the price action stalling in this area.
This zone is critical as it defines a bearish to bullish view of the price action. This area is a potential consolidation zone over the next few weeks.
If price is rejected here and goes lower than It would confirm that this is a bear market rally.
This chart was provided in previous weeks and still is used as a reference.
The analysis completed here is using the ESM2025 contract and or the SPX cash index. The future’s contract expires the 3rd Friday of June 2025.
From an elliot wave perspective the S&P 500 is in the final fifth wave move higher before a larger decline.
The chart shows potential targets.
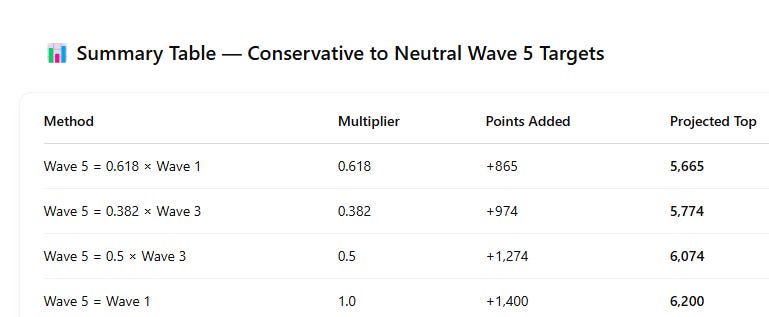
When converting equivalent pricing between ESM2025 and SPX (S&P 500 cash index) that difference is approximately 28 points. This price spread declines as it gets closer to ES contract expiration.
S&P futures with Fibonacci Retracements
This chart shows S&P futures with both fibonocci levels from the most recent high/low and bollinger bands. The chart is using a daily timeframe.
Bollinger Bands are a popular technical analysis tool that helps traders assess price volatility and identify potential overbought or oversold conditions. For greater insight look here.
I have placed Fibonacci retracements from the high 6170 to the 4837 low. The bands encapsulate 2 standard deviations of price action.
The mid-line is the 20 day simple moving average. It also corresponds to the 50 percent retracement of the entire move lower. This price is approximately 5500.
On Friday, price moved above the 50% retracement. The next target is 61.8%. This is 5661 and is the top of the consolidation zone. This is a potential target for this week.
I have highlighted potential key fibonicci targets:

🔍 Key Observations
50 % Fib Retracement as Current Pivot
The rally has now pushed back up to the 50 % level (≈ 5 503–5 504) of the March low → January high leg. That zone is acting as resistance today.
Bollinger Mid-Band Confluence
The 20-day MA (middle band, ≈ 5 398) has already flipped to resistance on the last couple of candles and price is now moving above it. A sustained close above the mid-band would signal the bounce has enough tractive force to test the upper band.
Upper & Lower Band Boundaries
Lower band sits around 5 015, underscoring the March low is still 500+ points below.
Upper band is out near 5 780—well above today’s highs, giving you a sense of the full BB envelope.
38.2 % Fib as Support
The 38.2 % retrace (≈ 5 346) coincided with a brief stall/pullback a few sessions ago, so you can pencil that in as your “first line” of pullback support if this 50 % level fails.
Next Logical Resistance
Above today’s 50 % test, the 61.8 % Fib (≈ 5 660) sits just under the upper Bollinger band—the next upside hurdle if momentum carries.
Volatility Insight
The bands have narrowed slightly over April, indicating volatility compression. A break above the mid-band into the upper half of the envelope typically precedes a ⚡️volatility expansion⚡️
The Volume Profile View
The chart below shows the S&P futures (contract ES) 10 day daily volume profile/market profile chart.
The data aggregation is done in 30 minute periods. The pink line to the left shows the volume POC while the green line to the right shows the POC of time. Volume and time donot always line up to the exact location.
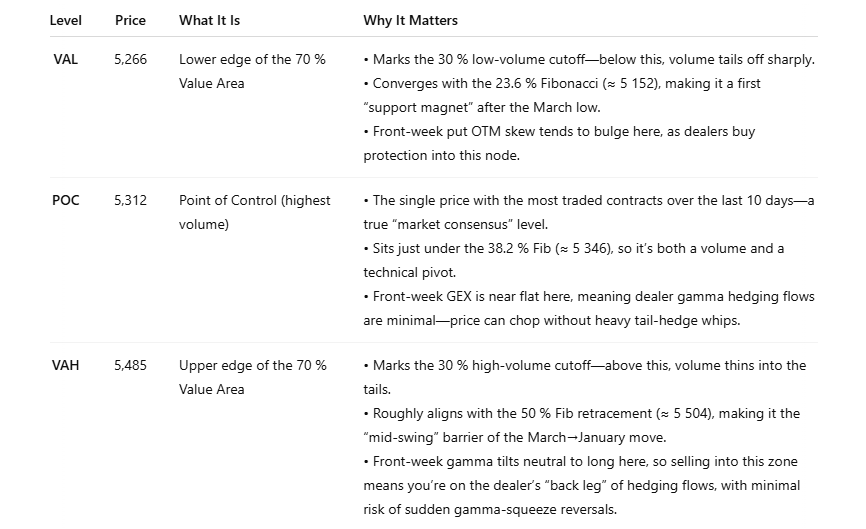
The basic idea is that most of the price action lies between the value area high and the value area low. The point of control (POC) is where the most significant amount of volume was traded for a given price bar. Statisically 70 percent of the price action occurs within the value area.
The area enclosed in the square shows that price has been trending higher over the last four days with the point of control migrating higher each day.
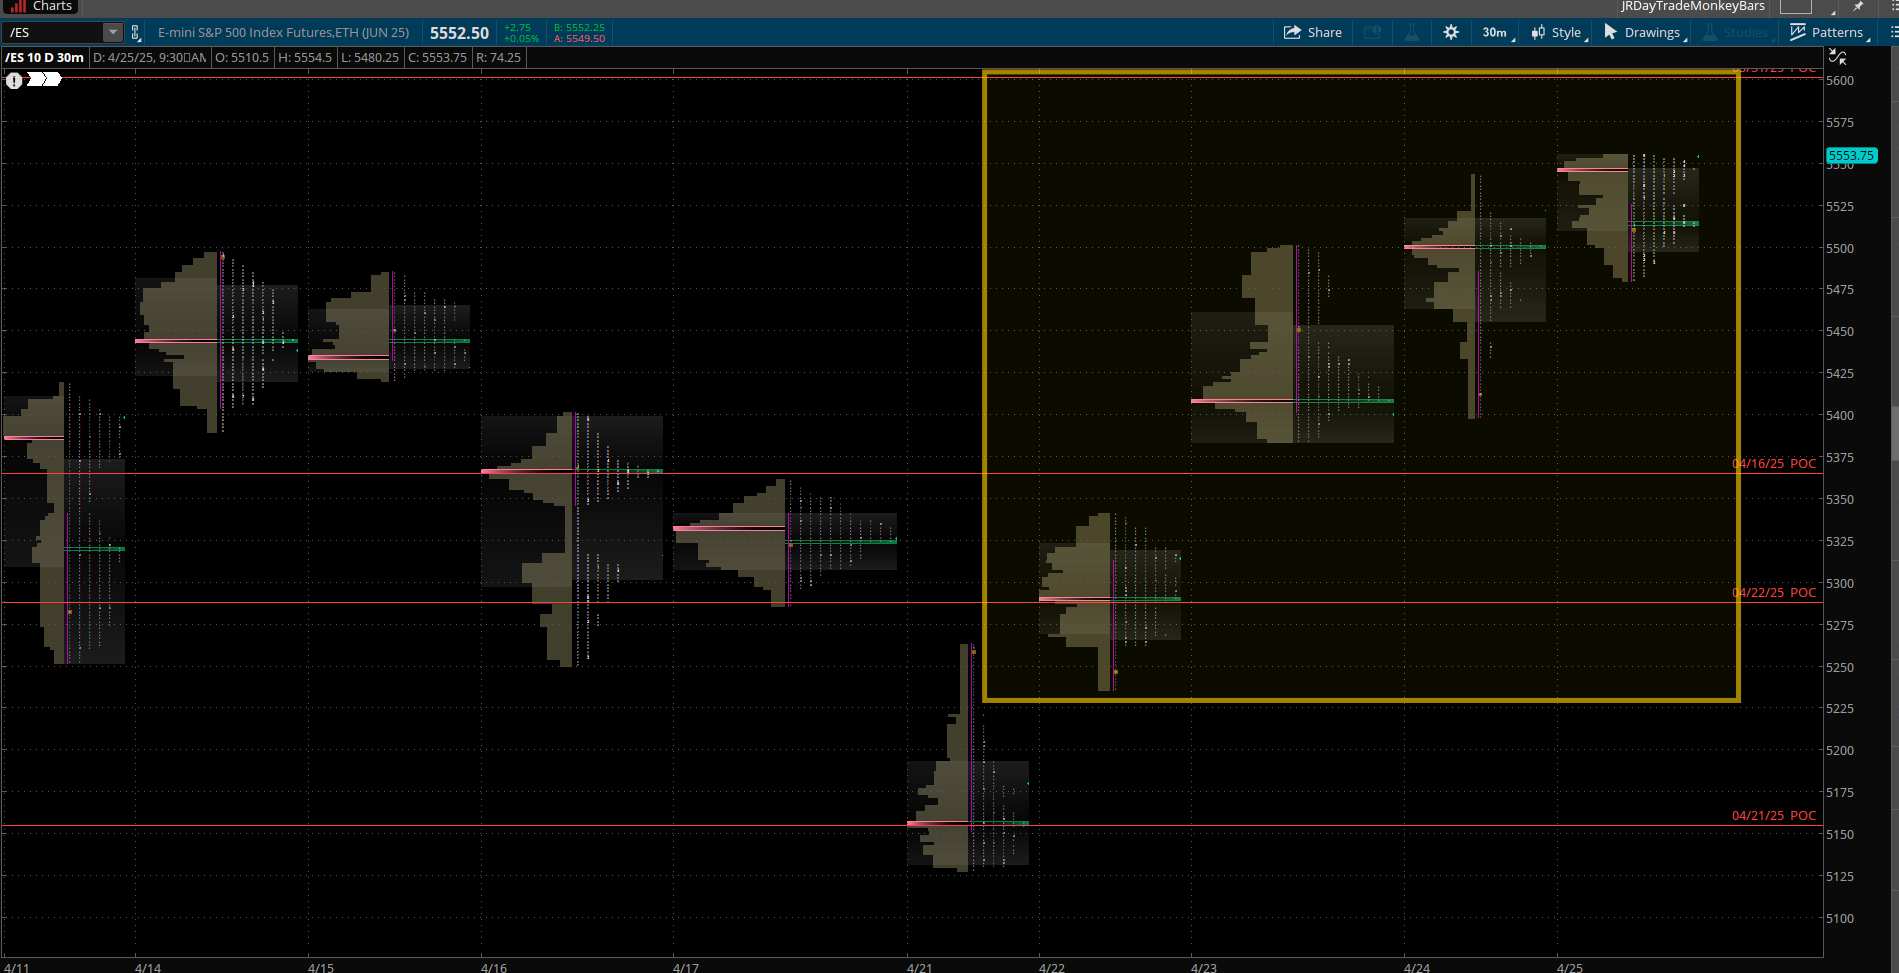
Over the last ten sessions, the daily volume‐profiles (“monkey bars”) have gone from a low of ~5 075 into today’s ~5 553, with POCs marching steadily higher. Here are the key take-aways:

Shift to Tight, Directional Profiles: After the wide swings early in the week, the last two days show SPX tightening into a clear up-trend, with Friday’s POC at
5 553 anchoring near‐term value.
Key Bands to Watch:
Support: 5 485–5 520 (recent pullback area)
Resistance: 5 580–5 600 (upper tail from today’s profile)
📊 10-Day Monkey Bar / Market Profile Analysis
The Volume Profile View ( 10 days )
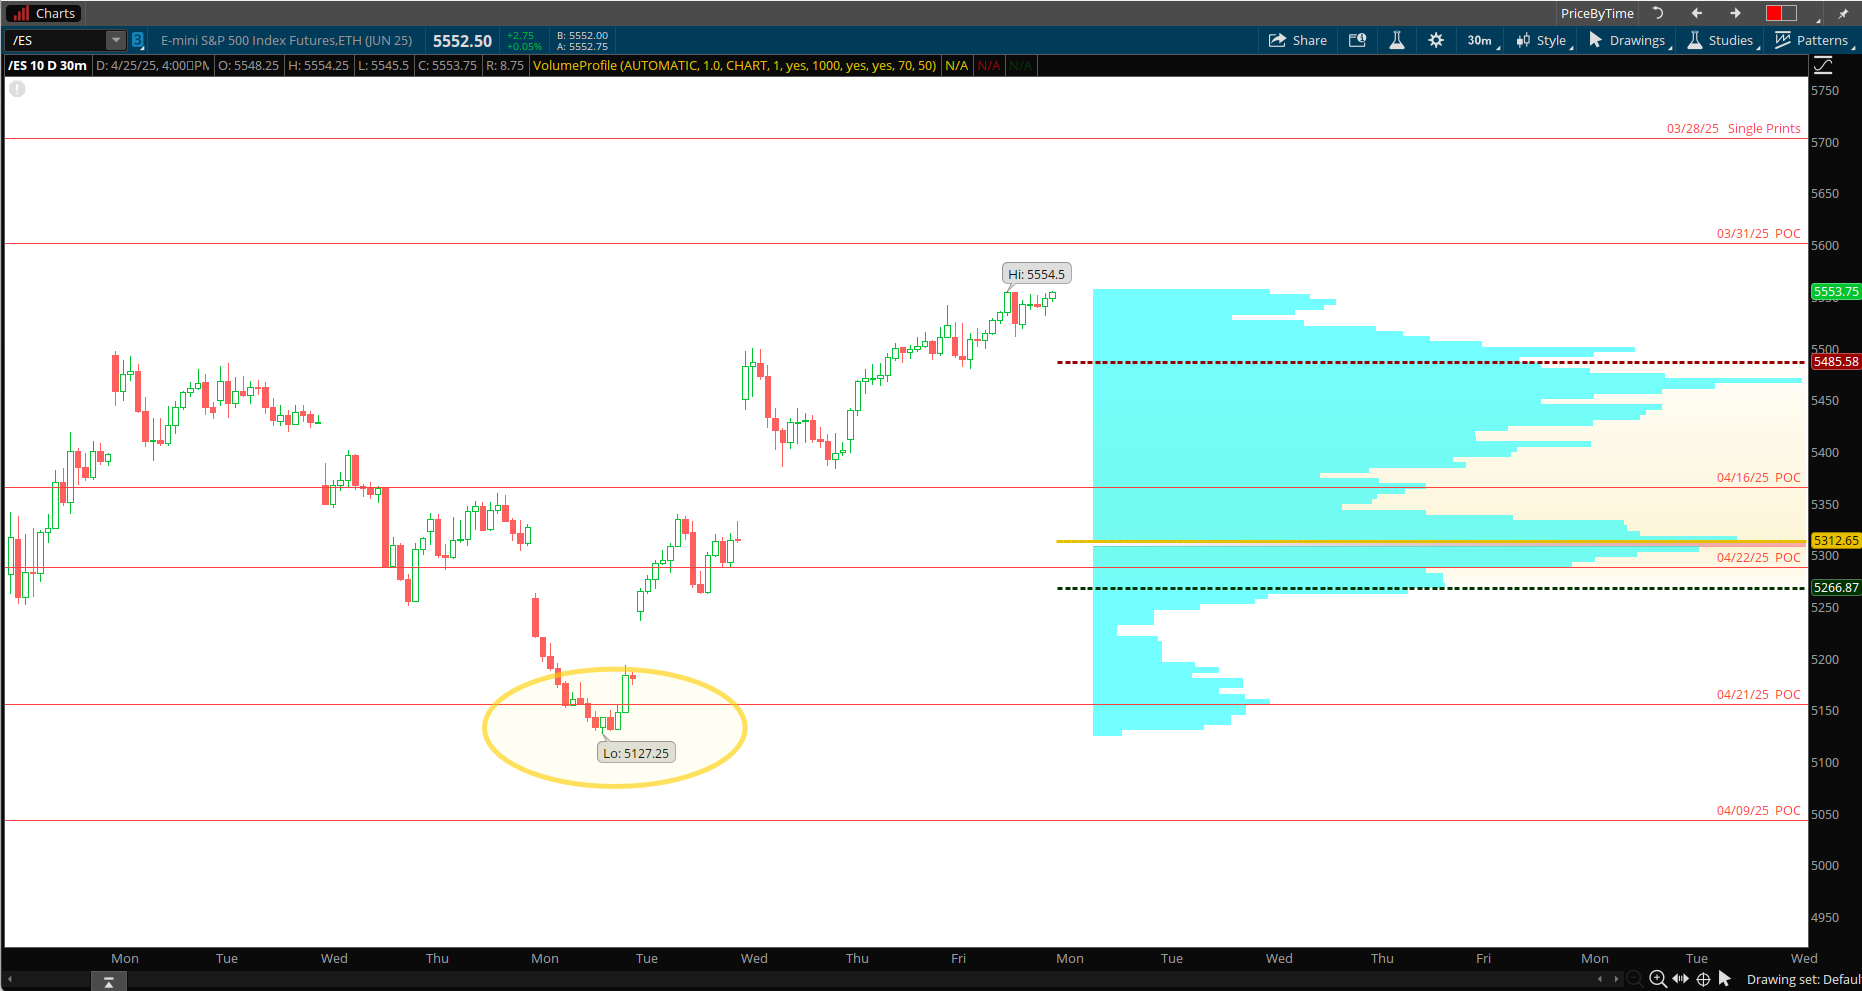
The chart below shows the S&P 500 futures volume profile for the last 10 days aggregated by 30 minute periods. I am showing the candlesticks on the left with the profile histogram on the right.
The area boxed in on the right is the value area for the last 10 days. As you may recall the value area contains 70 percent of the trading volume for the period with the point of control indicating the highest area of volume.
The S&P futures are within the 10 day value area.
Volume Profile Breakdown (10-Day Composite)
Last week, price moved lower below the 10 day value area low. By Friday, price exceeded the value area high. Short term price is overbought. Notice that the point of control is near lower end of the balance area suggesting value did move higher with the extreme move last week.
Read about market profile and auction market theory here.
Current Market Outlook Using Sectors
Listed below is the performance of the sectors that make up the S&P 500 for last week.
All the sectors were higher for the week except for consumer staples. This is bullish for the market. There was a large move especially in technology, communication and consumer discretionary.

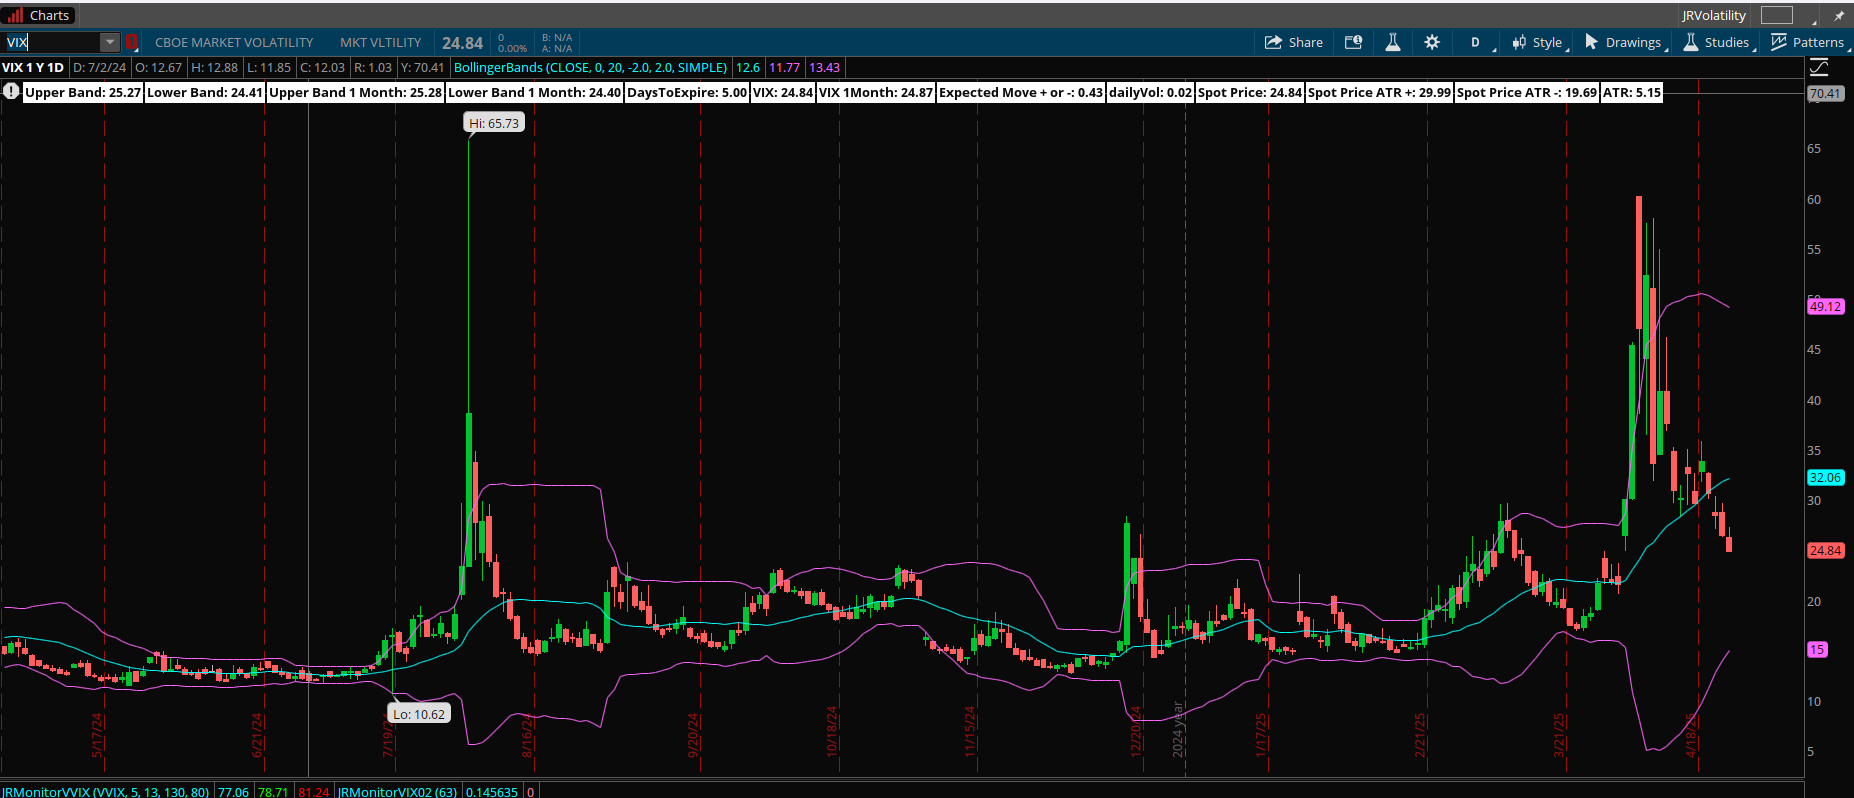
VIX Chart
The VIX is a number that measures how much people think the S&P 500 will move (up or down) over the next 30 days.
It’s often called the:
✅ “Fear Index”
because it rises when investors are nervous or expecting big market swings.
Currently the VIX has been in backwardation. A bullish SPX market would be in contango.
🔄 What is Backwardation in VIX?
Backwardation means:
Spot VIX > VIX Futures (especially 1-month out)
This implies the market expects volatility to decrease in the future, but currently sees significant near-term risk.
📘 What is VIX Contango?
VIX contango happens when:
🔸 The VIX futures prices are higher than the current (spot) VIX.
It’s the opposite of backwardation.
This implies that there is amount of risk, owning stocks short term.
Management of last week’s plan
Each week I sell calls for credit via broken wing buttefly strategy in the SPX. I wait for a short squeeze and sell above. I use the various areas of resistance on the chart along with the positioning information provided.
This strategy has performed well overall, as the market has been in decline or consolidation since the last quarter of 2024. For the current week, I will not implement this strategy as the market is trending higher.
For the next few weeks, I am revising the near term strategy using a calendar spread. Short term strike moved to two weeks out and longer term long option to three weeks out.
Using a near-term (front-vs-back) call calendar spread lets you exploit time-decay, vol-term structure, and a neutral-to-mildly-bullish view with defined risk. Key reasons to use it now:
Positive Vega Carry in Backwardation
When front-month IV > back-month IV (true backwardation), you’re short richer front-week vol and long cheaper back-week vol → you earn a small net vega credit each day.
Maximized Front-Leg Theta
The front-month short call decays fastest, while the longer-dated long call decays more slowly. You capture the time decay differential as days pass.
Neutral to Mildly Bullish Bias
A calendar is delta-light at initiation. You profit if price chops around your strike—even if it drifts slightly higher or lower—without needing a strong directional move.
Defined & Limited Risk
Worst-case loss = the net debit paid for the spread. No margin calls or assignment worries beyond that upfront cost.
Wide Breakevens
Calendar P/L curves are U-shaped with breakevens often ±200 points around the strike for the May 9/16 SPX calendar. That gives a large comfort zone.
Strike Flexibility & Pin-Risk Play
You can sell the strike that aligns with a key technical pivot (e.g. profile VAH, Fib level)—leaning on “pin risk” into front-expiry to let price gravitate back toward your short call.
Low Cost of Entry
Net debit is often small (a few points) versus outright long calls. You pay less premium up front to run the same DTE differential.
Price is entering a key inflection area between the 50% and 61.80% fibonocci region. This is an area where price stalled in the past.
You can review all of my posts here.
The MenthorQ SMILE curve
The MenthorQ skew smile curve chart of the S&P 500 cash index.

Smile Curve Highlights (Green = Today vs. Grey/Red/Yellow)
ATM Volatility (≈ 5 500–6 000 strikes):
Today ~19–20 % (down from ~21 % yesterday and ~25 % five days ago; above the ~15 % level one month ago).
Put‐Wing Skew (2 000–4 000 strikes):
Extremely steep at the wings.
Skew has eased slightly from five days ago but remains very rich.
Call‐Wing Skew (6 000–11 000 strikes):
Flatter profile: rises modestly.
Call skew has normalized a bit from its recent highs.
Smile Trough:
Lowest IV (~15 %) concentrated between 5 500–6 000 idea area for ATM structures.
Trend Over Time:
1 M Ago: Low‐vol, shallow skew.
5 D Ago: Vol spike, pronounced skew both wings.
Today: Vol settling lower, retains steep put skew but smoother call side.
S&P 500 Term Structure
The chart below shows the $SPX term structure. The green line shows today’s term structure. It is lower compared to the last five days indicating price consolidation.
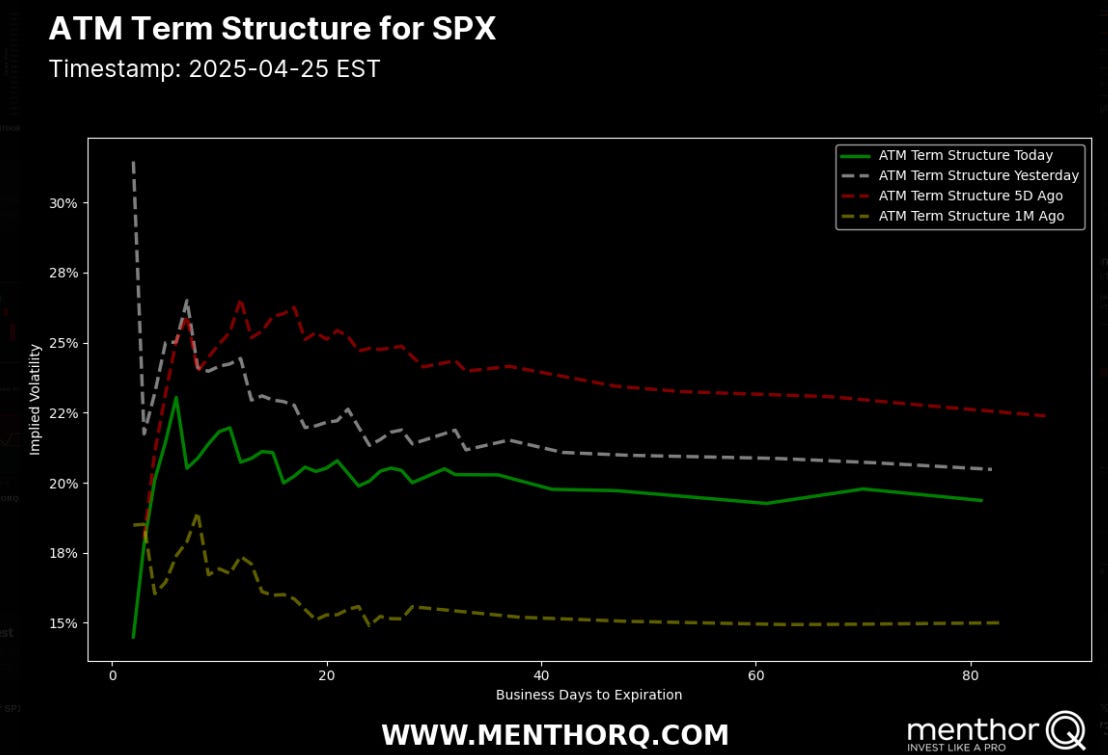
1. Ultra‐Short End (1–3 DTE)
IV at 1–2 business days is extremely low (≈14.7 %).
2. Next Weekly Peak (~5–7 DTE)
IV spikes up to ~22 % around the front weekly expiry (5–7 DTE).
This peak is where front‐week vols are richest. An ideal short‐leg for a calendar or diagonal.
3. Downward Slope into the Curve (7–90 DTE)
From ~22 % at 7 DTE, IV gradually decays to ~19.5 % by ~60 DTE and then flattens out.
That downward tilt means backwardation for any cross-expiry trade once past the first weekly expiration.
S&P 500 Cash Gamma levels
The chart shows four different GEX chart with the highest level of GEX. Market participants are mostly positioned bearish. GEX identifies areas on the chart where PUT and CALL volume exist at various strikes ( price levels).
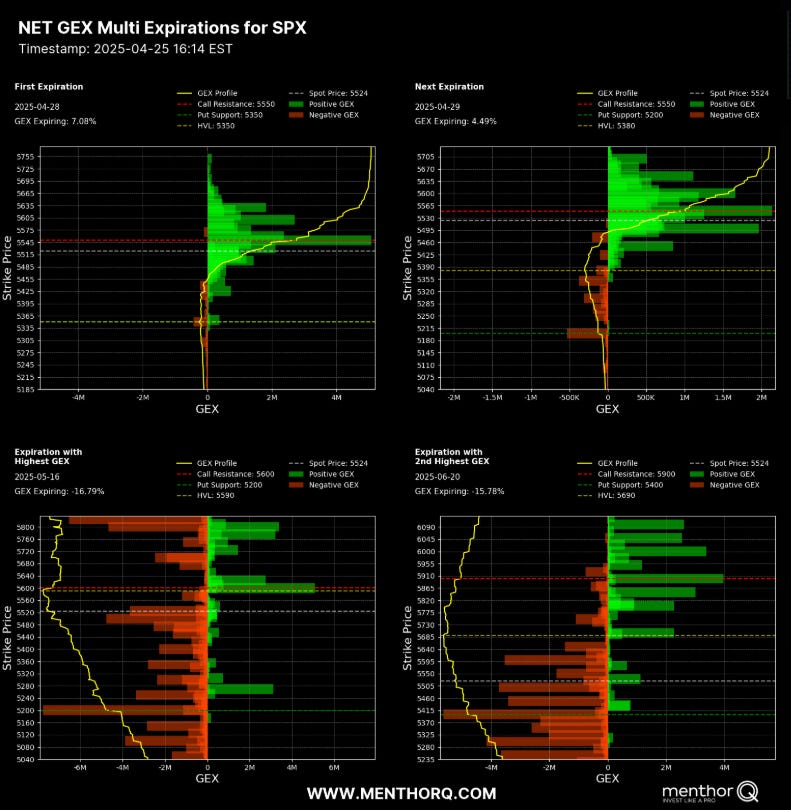
Top‐Left: Front Week (Apr 28 DTE 1)
Net GEX: +7.08 M (positive)
Call Resistance: 5550
Put Support: 5350
HVL (High‐Vol Level): 5350
Interpretation: Dealers are long gamma into tomorrow’s expiry—front‐week vols are relatively cheap, and you can expect a “pinch” into 5 550–5 350. Price should chop rather than trend, making single‐expiry condors or back‐month calendars attractive here.
Top‐Right: Next Week (Apr 29 DTE 2)
Net GEX: +4.49 M (mildly positive)
Call Resistance: 5550
Put Support: 5200
HVL: 5380
Interpretation: Still dealer‐long gamma, but much smaller footprint. Front‐week contango has faded slightly, but the pewter‐blue vol surface still supports shorting front‐legs out to 2 DTE. Expect modest chop around the 5 380–5 550 band.
Bottom‐Left: Peak Negative GEX (May 16 DTE 15)
Net GEX: –16.79 M (heavily negative)
Call Resistance: 5600
Put Support: 5200
HVL: 5590
Interpretation: This is a short‐gamma sink—dealers are massively short into mid‐May, so back‐month vols are rich. Any front‐vs‐mid calendar here yields strong vega carry. Also, 5600 and 5200 become magnet levels for dealer hedges.
Bottom‐Right: 2nd Peak Negative GEX (Jun 20 DTE 40)
Net GEX: –15.78 M
Call Resistance: 5900
Put Support: 5400
HVL: 5690
Interpretation: A similar negative‐gamma bulge in late‐June. Selling skew or harvesting carry beyond May, this is where back‐month IV is highest and front‐month cheaper in comparison.
The market maker implied move for the S&P cash index this week is +/- 149 points. The futures closed at 5525, therefore the market maker expected range is between 5674 to 5376.
Long Term rates (10 year Treasury)
The FOMC cut rates (December 2024) a .25 basis point cut. Rates peaked in the first week of January 2025. The yield is currently at 4.37.
At the most recent meeting FOMC left rates unchanged. The fed-fund watch tool shows that there is a 10% probability that short term rates will get lowered by 25 basis points at the next meeting in May.
I have placed bollinger bands around the price action. It shows increasing volatilty and a potential bounce off of the mean.

🧭 Risk Sentiment Matrix (Yields vs SPX)
10Y Yield Level SPX Signal Risk Mood
< 4.10% Bullish SPX Goldilocks, Fed in control
4.10–4.40% Neutral chop Confused regime, data-dependent
> 4.50% Bearish SPX Inflation concern, risk-off
I list the major events below.
Monday, April 28
No events
Tuesday, April 29
09:00 AM ET S&P/Case-Shiller Home Price Index (Feb) TradingCharts
Wednesday, April 30
08:15 AM ET ADP Employment Change (Apr) TradingCharts
08:30 AM ET PCE Deflator & Core PCE (Mar) TradingCharts
Thursday, May 1
10:00 AM ET Construction Spending (Mar) MarketWatch
10:00 AM ET JOLTS Job Openings (Mar) MarketWatch
10:00 AM ET ISM Manufacturing PMI (Apr) MarketWatch
Friday, May 2
08:30 AM ET Nonfarm Payrolls, Unemployment Rate & Avg. Hourly Earnings (Apr) Investopedia
Corporate Earnings Highlights
Big cap reports include Apple, Amazon, Microsoft, Meta, ExxonMobil, Coca-Cola, McDonald’s, Visa, Mastercard, PayPal, Pfizer, AstraZeneca, Chevron, and others — all due to drop Q1 results mid-week Investopedia.
Anytime During the week
Potential Commentary or Speeches from the US President
– Look for any remarks by the United States President and or high ranking cabinet officials which may move the market. This is NOT date specific.
These events collectively offer a comprehensive view of the current economic landscape, encompassing monetary policy, corporate performance, housing dynamics, and consumer behavior. Investors and analysts will closely monitor these developments to inform their strategies and forecasts.
QQQ Daily Chart
Looking at the QQQs or the Nasdaq100 futures are an important part of my trading plan. The XLK (technology ETF) represents a 33% component of the S&P500. Therefore I use this as an indicator to trade the S&P 500. QQQs closed at 474. From a momentum view, the QQQs are overbought. price also closed near a supply zone.
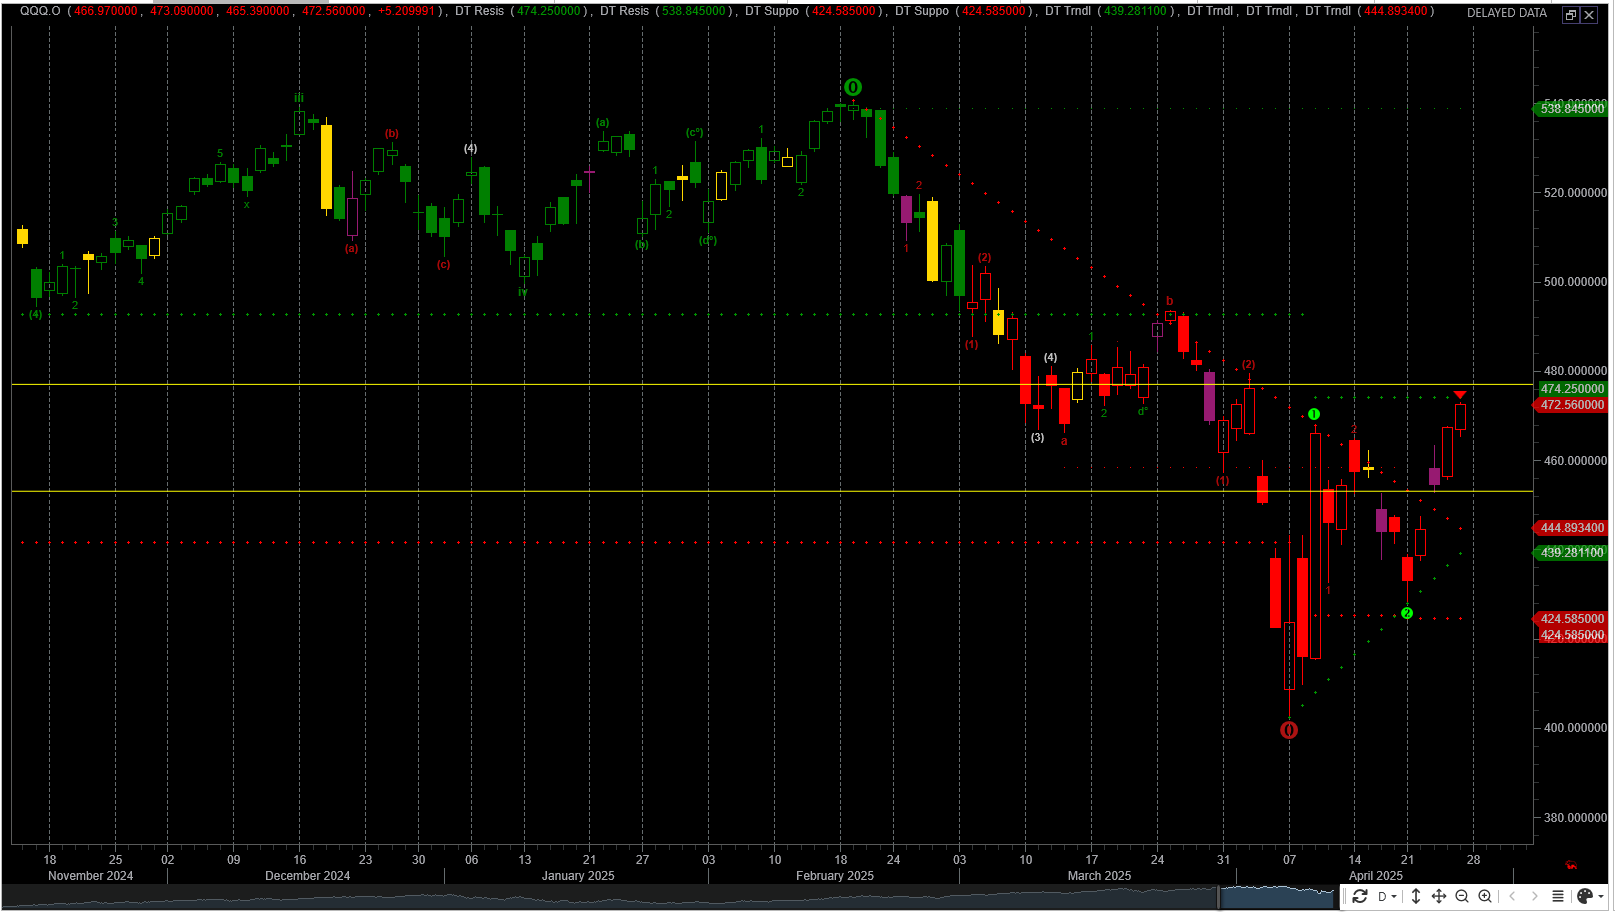
🔍 Key Observations
On a hold/rejection at 474.25: look for a pullback toward 444–440 to re-test trend support.
If 474.25 gives way on strong volume: the path is open toward 500+ as the next psychological zone, with 538.85 as the longer-term target.
As long as QQQ stays above ~440, this up-trend structure remains in force; a break back below 440 shifts the bias negative into the 424 region.
The QQQ has rallied strongly, but it’s bumping into a well-proven ceiling at ~474. A failure there probably means a pullback to the 444–440 area. A decisive push through 474, however, would suggest the bulls have re-asserted control all the way back toward the mid-500s.
QQQ Gamma levels
The chart below shows the positioning information for QQQ.
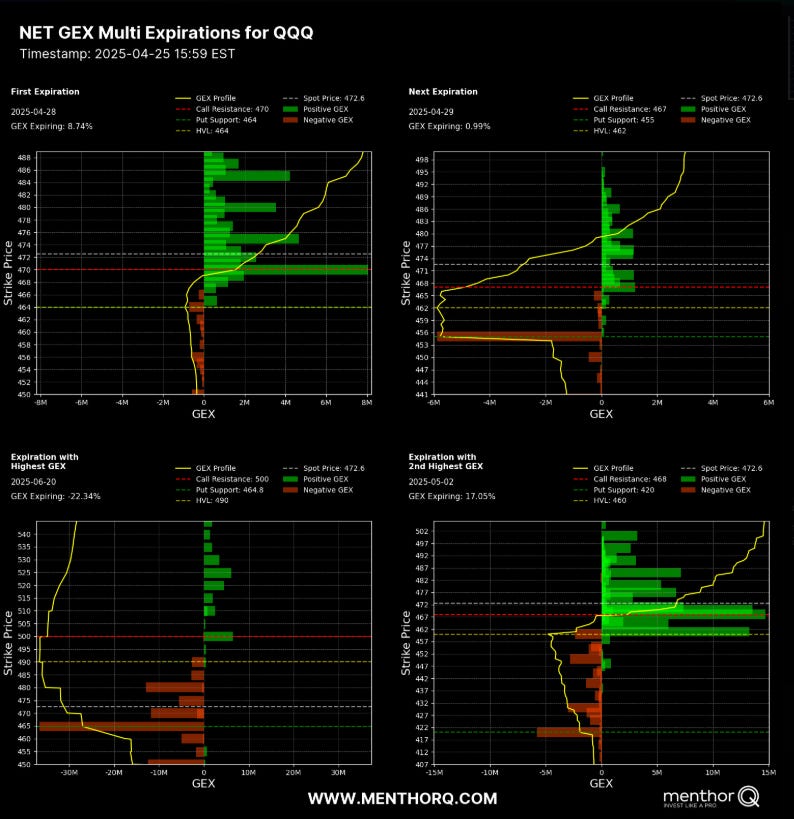
1. April 28 Expiry (Front-Week) – Top-Left
Net GEX ≈ +8.7 M (7 % of total) → dealers are net long gamma into tomorrow’s expiration.
Call Resistance: 470
Put Support & HVL: 464
Implication: Front-week vol is relatively cheap (gamma backstop), and you’ll tend to see pinning between 464 – 470.
2. April 29 Expiry (Next-Week) – Top-Right
Net GEX ≈ +1.0 M (≈1 %) → virtually neutral gamma.
Call Resistance: 467
Put Support: 455
HVL: 462
Implication: Next-week vols are also inexpensive but carry almost no gamma-carry edge. Price can wander freely through 455 – 467.
3. May 2 Expiry (2nd Highest GEX) – Bottom-Right
Net GEX ≈ +17.1 M → dealers heavily long gamma into the first Friday of May.
Call Resistance: 468
Put Support: 420
HVL: 460
Implication: Early-May vol is extremely cheap—selling structures into 460 – 468 nets you maximum front-leg theta and positive vega carry.
4. June 20 Expiry (Highest Negative GEX) – Bottom-Left
Net GEX ≈ –22.3 M → massive short gamma.
Call Resistance: 500
Put Support: 464.8
HVL: 490
Implication: Mid-June vol is very expensive—buying back-month against any front expiry captures the richest carry. Dealers here will be forced into aggressive hedges if large moves hit 490 – 500.
Trade SPX Trade based on movement within the QQQs:
Use QQQ’s 474 ceiling / 440 trend-line / 460–468 pin band as a template:
Use QQQs 474 ceiling / 440 trend-line to 460-468 pin band as a template
Target a pullback toward 5 300–5 450 if QQQ rolls over from 474
Lean bullish if QQQ decisively breaks above 474 → look for SPX to clear 5 600 next.
The Weekly Plan and trading idea
My general strategy for the current market is limit the weekend exposure to the market. With that being said, I am generally more than 75 percent in cash on any given weekend.
With the details I provide above, I pick my spots of trade entry judiciously. I am trading spreads in this market. As the market has been mostly down, I look to exploit large upward spikes in CALL premium. I will structure trades as broken wing butterflys where I am a net seller of call premium.
This article gives a general idea of the trade strategy.
Structuring of trades this way, allows the trade to work in two different ways:
I collect a credit premium upon trade entry. If the market continues to fall then the trade wins via credit collection.
I am selective in picking the long strike and short strike of the trade, such that if a gamma squeeze occurs, the short call will have neglible impact.
I am mindful of the fact that the market can squeeze much higher then I initially accounted for. In this situation, I adjust the middle strike higher to mitigate risk providing more room for the trade to work. As the trades are short term 3 - 10 days out, I attempt to exploit option time decay (theta). Market don’t move in a straight line up or down and I count on this concept as part of my edge in trading.
If the above point does not mitigate risk sufficiently, and the market continues to squeeze than I will simply close the trade.
My strategy also includes trading small as well as different dates of expiration, different strikes and ranges to mitigate risk.
In trading, it is fool hardy to believe that every trade will win. I am mindful of this fact and constantly monitor my risk. I am playing the long game and I understand that losses are part of the game!
One additional idea is to buy a calendar spread in SPX for the middle of May. If the SPX continues to stay range bound, then this strategy takes advantage of theta decay (time decay) and vega carry.
This would capitalize on the high volatility for the week and short time to expiration.

Have a successful trading week, by waiting for your trade setups to come to you. Always manage your risk and understand what you expect to lose prior to trade entry. By managing risk, you unlock profitability.
Remember to size down your trades, as volatility is high!
Gamma Level data (netgex data) and skew data (market sentiment) was provided by menthorQ.com
Presentation on VIX
Last week I did a presentation on the VIX.

How I trade
I did a number of presentations of my trading process with menthorQ. You can find them here. This is under the highlights section of my “x” account found here.
Follow me on X formerly twitter . I post my market view during the week.
Disclaimer
Please don’t follow my idea(s) blindly. Do your own due dilligence before you attempt to trade. Always manage your risk.
Thank you for reading my weekly plan.
Joel
