


Weekly Plan for April 6
With a historical down move and increased volatility, the S&P traded lower more than 500 points for the week. I discuss my weekly plan below.

Summary
The price action last week in the S&P 500 was historical to say the least. I am providing the historical data showing the context of last week’s price action. The grid below shows periods in the USA history where the US stock market dropped more than ten percent within a weekly period.
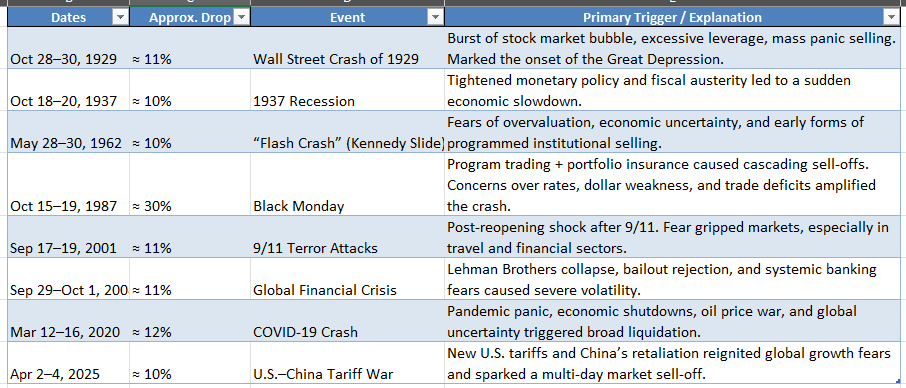
A chart showing the historical nature of the move.

I can not stress enough that risk management is key to trading this market. Current volatility in the market as measured by the VIX is at 45. That is a potential move up or down of 350 points for this week.
Markets oscillate from balance to trend and currently we are experience a trending move. It is hard to tell where this market will stop trending lower. Predicting is really a fool's errand. Observation is key, and look for areas where support and demand lie.
Prior to the market meltdown the S&P 500 had a price to earnings ratio of nearly 28. This is historically high and therefore a market sell was anticipated to some degree. Historically, the average of the S&P was approximately 19. The PE after this current market selloff brings it near 25. If the S&P 500 price moves based on historical norms then price could move to 3885 ( PE of 19). This implies a fair value.
This estimation does not account for any positive and or negative impact of the current administration’s fiscal policy and the federal reserve’s monetary policy. Understand that momentum moves markets in both an upward and downward trajectory.
This is the current S&P 500 future’s chart.

In past weeks, I have noted areas of demand which turned into supply. The S&P is in a distribution phase after many years of rising. In the past I have pointed to the 5850 price zone which was an area of support. There were multiple touches where it bounced higher. In February this area broke lower. This is a significant sign-post of market distribution (SELLING).
This past week the S&P broke another key area of support. This is the 5680 price zone region.
On Friday the S&P 500 made a nearly four standard deviation move lower.
1σ move: 50 points up or down
2σ move: 100 points up or down
3σ move: 150 points up or down
4σ move: 200 points up or down
I discuss various data points that suggest the S&P will move higher this week.
The trendline is drawn from the August 2024 low. There have been multiples touches to this area of support recently. That is the 5550 - 5500 area. The most recent touches have occured in March 2025.
Current Context
Price: ~5,110
Market recently experienced a sharp breakdown, losing key trendline support.
The recent red candle shows high momentum to the downside, indicating panic or liquidation.
🔻 Key Support Levels
5,000 – Psychological Round Number
Just below the current price.
Historically significant and marked with a yellow horizontal line.
A likely area for buyers to attempt stabilization.
4,800 – 4,850 Zone
Previous consolidation and minor pullback area.
May act as intermediate support if the 5,000 level breaks.
4,500 (Red Horizontal Line)
Major former resistance from mid-2023.
Now a strong support zone and a potential bounce candidate.
4,100 – 4,200
Base of the rally from October 2023.
Critical level for long-term trend support.
🔼 Key Resistance Levels
5,550 – 5,600 Zone
Recent swing low that was broken.
Now acts as resistance on any bounce.
Matches with the green uptrend line it broke below.
5,727.50 – 5,853.26 (DT Trendline + Supply Zone)
Area of heavy selling and breakdown.
Bears are likely to defend this level aggressively.
6,130 – 6,200 Zone
Previous swing highs.
Marked by green horizontal resistance.
Would need a major trend reversal to retest this zone.
I have summarized key levels of support and resistance here:

Note, the analysis completed here is using the ESM2025 contract and or the SPX cash index. The future’s contract expires the 3rd Friday of June 2025.
When converting equivalent pricing between ESM2025 and SPX (S&P 500 cash index) that difference is approximately 30 points. This price spread declines as it gets closer to ES contract expiration.
S&P futures with Fibonacci Retracements
This chart shows S&P futures with both fibonocci levels from the most recent high/low and bollinger bands. The chart is using a weekly timeframe.
Bollinger Bands are a popular technical analysis tool that helps traders assess price volatility and identify potential overbought or oversold conditions. For greater insight look here.
I have placed Fibonacci retracements from the high 6165 to the 5074 low. The bands encapsulate 2 standard deviations of price action. Since this is a weekly chart, it demonstrates the longer term bearish trend for the S&P 500.
When looking at the fibonocci levels a key observation is that price stopped at the 61.8 percent level. This is 5110. Price is currently here.
The bands have expanded over the past number of weeks. Note the break down of the lower bollinger band during the week ended 3/7/2025.
I have highlighted potential key fibonicci targets:

Here is a summary of the key Fibonacci target level for the S&P 500 futures.


Understand that these price levels are potential targets. Markets donot move in a straight line, therefore expect price to trap higher before a move is made into a lower potential supply zone.
Investors Business Daily BULLS vs BEARS sentiment
This chart shows a sentiment indicator taking from the Investors Business Daily. It supports the potential idea of the market having a potential bounce this week.

The Volume Profile View
The chart below shows the S&P futures (contract ES) 10 day daily volume profile/market profile chart. The data aggregation is done in 30 minute periods.
The market has moved out of balance over the last few days.

As shown above, the market is trending lower. I will observe the market form a new balance area. Note the large gap down.
Potential targets using this view:
Bottom of the Gap: 5317
Top of the Gap; 5427
If the market can move higher above 5317 area, then there is little resistance that the upside target of 5427.
For the early part of the week, that is Monday or Tuesday, I view there is greater risk to reward to upside target.
The Volume Profile View ( 5 days )
The chart below shows the S&P 500 futures volume profile for the last 5 days aggregated by 30 minute periods. I am showing the candlesticks on the left with the profile histogram on the right.
The area boxed in on the right is the value area for the last 5 days. As you may recall the value area contains 70 percent of the trading volume for the period with the point of control indicating the highest area of volume.
The move has been severe to the downside. I have pointed to the value area low. The S&P futures are 328 below the value area low.
This is a potential target on a short cover rally.

Note that the 5 day value area low is near the current price. Potentially, an oversold market ready to move higher.
The key levels are:
Value Area High: 5718
Point of Control: 5674
Value Area Low: 5428
Read about market profile and auction market theory here.
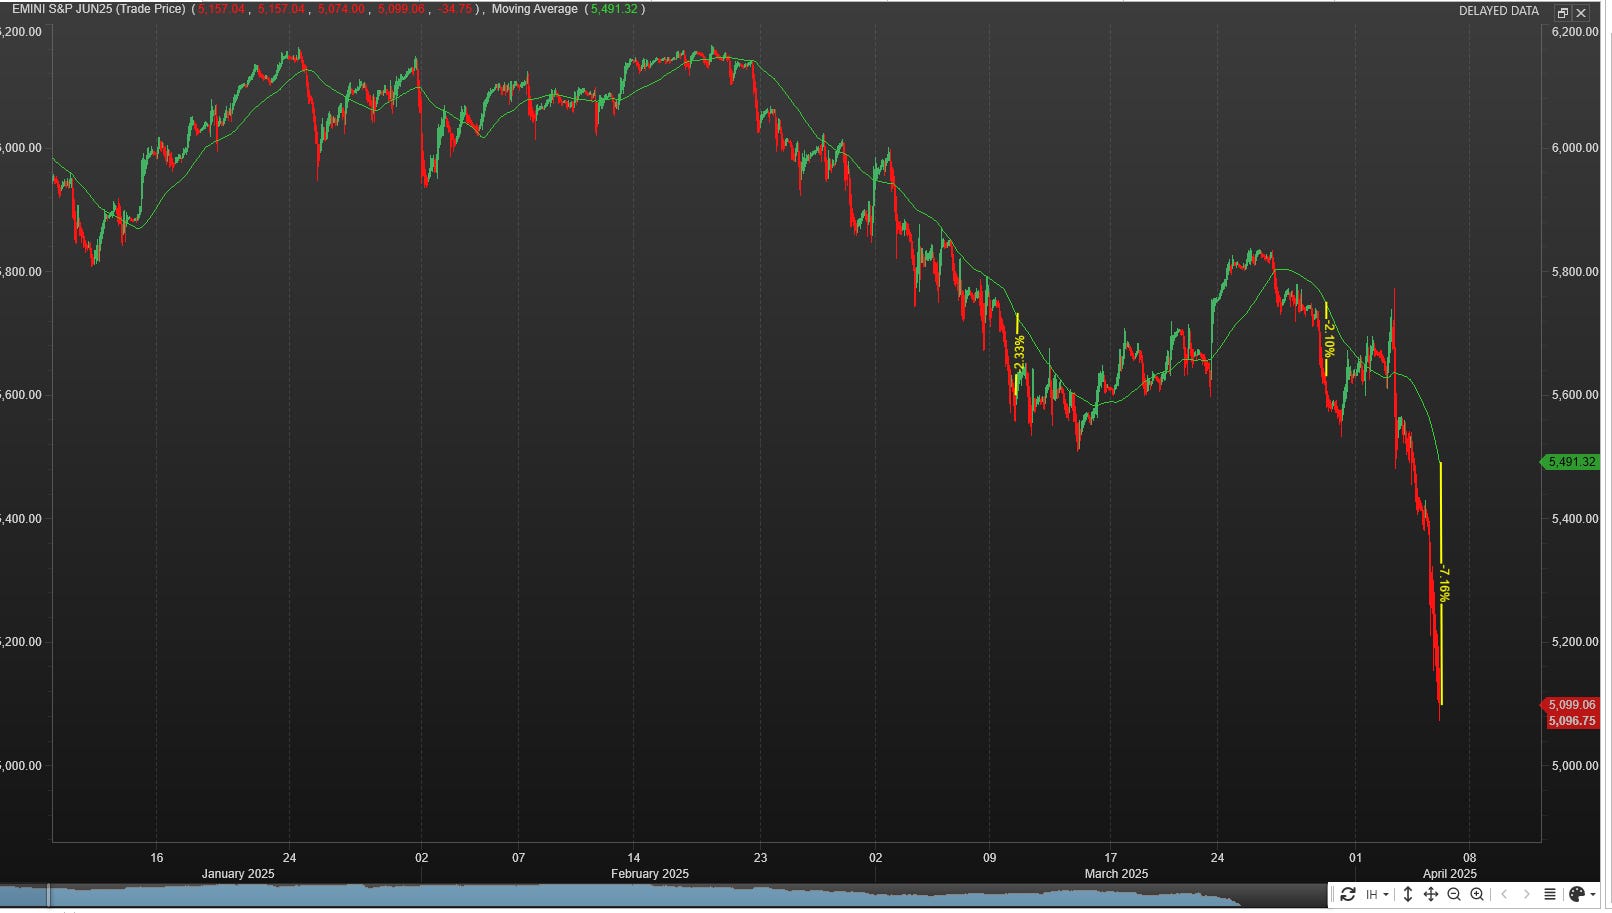
S&P 500 futures hourly chart
This chart shows the last 60 days of trading price action. The chart shows heikin candles using a 65 period simple moving average. Price is currently approximately 7 percent below this moving average.
Over the last 4 - 5 months this area acted as good area of short term support or resistance. This is also a potential target. The moving average is at 5491 approximately 390 points above the current price.
CTA Positioning
The chart shows the CTA positioning (Commodity Trading Advisor). CTA positioning shows that positioning is at a extreme low for S&P 500. This adds to the bullish case, for a bounce higher early next week.

Management of last week’s plan
Each week I sell calls for credit via broken wing buttefly stratedgy. I wait for a short squeeze and sell above.
Currently, I am out of all short call spreads with the large lower in the S&P 500 lower.
You can review all of my posts here.
The MenthorQ SMILE curve
The MenthorQ skew smile curve chart of the S&P 500 cash index.

🧠 Interpretation / Sentiment Insight
This is a classic "fear regime" volatility smile:
High demand for puts → downside hedging
Call IV lagging → low upside conviction
Broad IV elevation → uncertainty + event risk pricing in
Likely implications:
Traders expect further drops or violent reversals.
Options are now expensive — both for hedging and speculating.
Strong potential for vol crush if fears subside suddenly.
Long Term rates (10 year Treasury)
After the FOMC cut rates (December 2024 .25 basis point cut) there has been a steady Rates peaked in the first week of January 2025. Since this time they have declined. The yield is currently at 3.989.
At the most recent meeting FOMC left rates unchanged. The fed-fund watch tool shows that there is a 25% probability that short term rates will get lowered by 25 basis points at the next meeting in May.

🔁 SPX Correlation
In normal conditions, lower yields = higher stock prices due to discounted cash flows.
But in this panic-driven scenario, yields dropping reflect a flight to safety, and that usually means:
SPX selling continues or stays under pressure.
Investors are reallocating to bonds for safety, not chasing risk.
S&P 500 Term Structure
The chart below shows the $SPX term structure. The green line shows today’s term structure. It is at the highest level over the last month.
The short-term IV spike over the next few days suggests continued risk. Over the next few weeks the term structure suggests that volatility will get sold.

I list the major events below.
S&P 500 Cash Gamma levels
The chart shows four different GEX chart with the highest level of GEX. Market participants are mostly positioned bearish. Price is still well below the high volume level (5700) for this week.
Aspect Key InsightsAll Expirations
Net negative gamma across the board → high volatility regime.
Short-term (Apr 7–8) 5,000–5,100 is near-term battleground. Breach = more downside pressure.
Medium-term (Apr 17) 5,200–5,500 is a dealer-pinned range.
Longer-term (Jun 20) Persistent dealer risk and volatility; strong overhead gamma resistance at 6,000+.

The market maker implied move for the S&P futures this week is +/- 348 points. Therefore the market maker expected range is between 5421 to 4727.
US Market Moving Events for the current week
I have listed the events in the order of significance (highest to lowest).
For the week of April 7 to April 11, 2025, several key economic events and notable earnings reports are scheduled in the United States.
Implementation of New Tariffs:
April 9: The U.S. is set to enforce a 10% blanket tariff on all imports, with higher rates targeting specific countries—54% on Chinese goods, 20% on EU imports, and 24% on Japanese products. Barron's+2news+2New York Post+2
April 10: China plans to retaliate with a 34% tariff on U.S. goods, escalating trade tensions and raising concerns about a potential global recession. The Australian
Federal Reserve Communications:
April 9, 2:00 PM ET: Release of the Federal Open Market Committee (FOMC) minutes from the March meeting, providing insights into the Fed's economic outlook and potential policy adjustments.
April 10: Multiple speeches from Fed officials, including Governors Michelle Bowman and Adriana Kugler, and Presidents Jeff Schmid (Kansas City Fed) and Patrick Harker (Philadelphia Fed), offering perspectives on monetary policy amid current economic challenges. MarketWatch
Inflation Data Releases:
April 10, 8:30 AM ET: Publication of the Consumer Price Index (CPI) for March, a key indicator of inflation trends. Investopedia
April 11, 8:30 AM ET: Release of the Producer Price Index (PPI) for March, providing insights into wholesale inflation.
Corporate Earnings
April 11: Major financial institutions, including JPMorgan Chase, Wells Fargo, and BlackRock, are scheduled to report quarterly earnings.
Anytime During the week
Potential Commentary or Speeches from the US President
– Look for any remarks by the United States President and or high ranking cabinet officials which may move the market. This is NOT date specific.
These events collectively offer a comprehensive view of the current economic landscape, encompassing monetary policy, corporate performance, housing dynamics, and consumer behavior. Investors and analysts will closely monitor these developments to inform their strategies and forecasts.
QQQ Weekly Chart
Looking at the QQQs or the Nasdaq100 futures are an important part of my trading plan. The XLK (technology ETF) represents a 33% component of the S&P500. Therefore I use this as an indicator to trade the S&P 500. QQQs closed at a 423.
I have highlighted an area that has strong support. This is approximately 380 - 395 area.

QQQ Gamma levels
The chart below shows the positioning information for QQQ. Current GEX profile is showing a slight negative gamma environment. Currently price is 423. The key inflection point is 485 (high volume level).
Observations:
Massive long-dated put exposure.
Dealer gamma is net negative all the way to sub-400 levels.
Very little near-term stabilization.
Implication:
Sustained negative gamma suggests continued fragility. Long-term traders are still pricing in hedging flows and downside pressure.

The QQQs should act as a break on the upward progression of the SPX. Since the QQQs are in negative gamma environment, expect large price moves.

Here is a SPX vs QQQ Net Gamma Exposure. The QQQs should act as a break and or impede any upward movement in SPX.

The Weekly Plan and trading idea
My general strategy for the current market is limit the weekend exposure to the market. With that being said, I am generally more than 75 percent in cash on any given weekend.
With the details I provide above, I pick my spots of trade entry judiciously. I spend large amount of time analying the S&P 500 and I am trading spreads in this market. As the market has been mostly down, I look to exploit large upward spikes in CALL premium. I will structure trades as broken wing butterflys where I am a net seller of call premium. This article gives a general idea of the trade strategy.
Structuring of trades this way, allows the trade to work in two different ways:
I collect a credit premium upon trade entry. If the market continues to fall then the trade wins via credit collection.
I am selective in picking the long strike and short strike of the trade, such that if a gamma squeeze occurs, the short call will have neglible impact.
I am mindful of the fact that the market can squeeze much higher then I initially accounted for. In this situation, I adjust the middle strike higher to mitigate risk providing more room for the trade to work. As the trades are short term 3 - 10 days out, I attempt to exploit option time decay (theta). Market don’t move in a straight line up or down and I count on this concept as part of my edge in trading.
If the above point does not mitigate risk sufficiently, and the market continues to squeeze than I will simply close the trade.
My strategy also includes trading small as well as different dates to mitigate risk.
In trading, it is fool hardy to believe that every trade will win. I am mindful of this fact and constantly monitor my risk. I am playing the long game and I understand that losses are part of the game!
Going into this current week, I have a small long position in QQQ. As I expect mean reversion Monday and or Tuesday.
I view this as a short term trade. I am NOT stuck on this idea however with the exterme move last week, I have an expectation of higher prices.
SPX - Key Weekly Levels

Have a successful trading week, by waiting for your trade setups to come to you. Always manage your risk and understand what you expect to lose prior to trade entry. By managing risk, you unlock profitability.
Remember to size down your trades, as volatility is high!
Gamma Level data (netgex data) and skew data (market sentiment) was provided by menthorQ.com
How I trade
I did a number of presentations of my trading process with menthorQ. You can find them here. This is under the highlights section of my “x” account found here.
Follow me on X formerly twitter . I post my market view during the week.
Disclaimer
Please don’t follow my idea(s) blindly. Do your own due dilligence before you attempt to trade. Always manage your risk.
Thank you for reading my weekly plan.
Joel
