


Weekly Plan for December 15
S&P 500 moved approximately 1% lower last week. The parabolic up move since the since the election has paused. Let's get into my weekly plan below.

Summary
The market is in a seasonally bullish period. This is a period from mid-October to late January of the following year. Sentiment became extremely bearish throughout the previous week with the S&P 500 moving lower.
S&P 500 Futures Daily
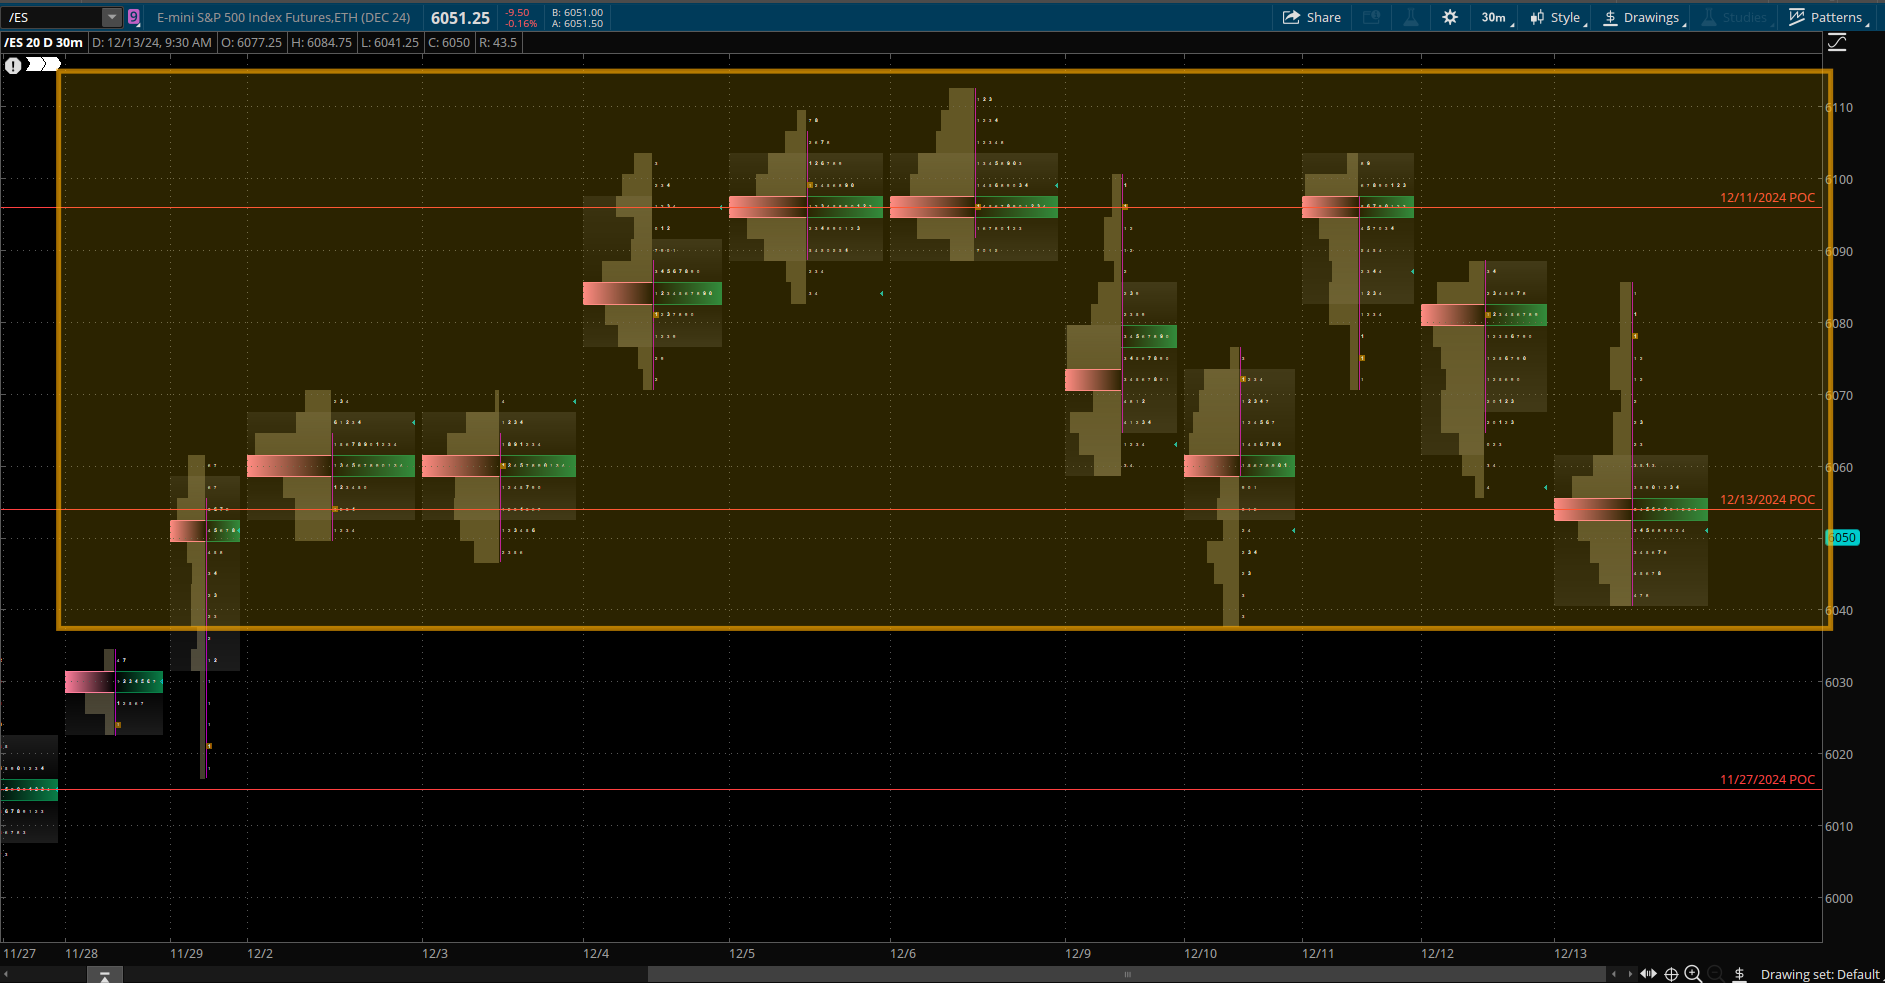
The chart below represents the S&P futures volume profile chart. The highlighted rectange shows that the market has been in a range over the last 11 days. Considering the large move from early November election, it is not surprising the gains made have consolidated.
Note that pink line across each day bar represents the highest volume for the day. The green line represents where the greatest amount of time was spent on the day. These lines are defined as the point of control.
The range for this period is 6040 - 6100 and is defined for the last two weeks of trading.
The Weekly S&P futures chart.
Both market and volume sentiment was bearish over the last 8 trading days. This is depicted by the chart below. This chart shows the McClellan Oscillator. The two histograms in chart represent market and volume sentiment. The S&P 500 price is shown in lower section of the chart.
The fact that the S&P 500 moved a small distance lower after a large up move from the election is bullish. From the election to the peak it moved 380 points higher with give back of only 50 points.

The S&P 500 Skew is shown here. The skew is currently showing a very bearish market. I have circled other recent times where S&P 500 appeared at extreme bearish levels. Within a couple of days of hitting the peak, the S&P500 reversed higher. Therefore when sentiment is extreme, it is generally positive to take the trade in the opposite direction. Understanding that the market was extremely bearish from a sentiment view, I would look for only bullish trades in the coming week.

S&P 500 Cash Gamma levels
For the current week market participants are positioned mostly bearish early in the week. If price breaks below the 6045 - 6030 zone then S&P 500 cash index could fall to an area between 5980 - 6000.
Above 6045 - 6060 zone, positioning is supportive of a bullish narrative. A potential target is 6100. This is the top of the most recent consolidation range.
The chart below shows extreme bearishness for Monday and Tuesday. For the expiration of 12/20 and 12/30 positioning is very bullish. Therefore, I expect the puts to get monetized (sold) into the end of day Tuesday. This potentially can act as fuel to generate a bullish reversal into the end of the week as well as the end of year.

The market maker implied move for the S&P futures this week is +/- 78 points. Therefore market maker have an expected range between 5977 to 6133.
US Market Moving Events
The market moving events for the week of 12/15/2024
U.S. Economic Data:
Housing Market Data: Housing starts and building permits for November will be released on December 19, 2024. These metrics can influence investor sentiment regarding the health of the housing market and broader economy.
Leading Economic Indicators (LEI): The Conference Board's LEI for November is also set for release on December 21, 2024. This report often provides insights into potential economic trends and recession risks.
Federal Reserve Impacts:
Markets are digesting the outcomes of the Federal Reserve's policy meeting held earlier in December. Any shifts in the Fed’s tone or forward guidance about interest rates and inflation could continue to influence market direction during this week.
According to Fed watch tool, the federal reserve is expected to lower rates by 25 basis points.
QQQ Weekly Chart
Looking at the QQQs or the Nazdaq 100 futures are an important part of my trading plan. The XLK (technology ETF) represents a 33% component of the S&P500. Therefore I use this as an indicator to trade the S&P 500.
The QQQs made a new 52 week last week, therefore I remain bullish into this week.

QQQ Gamma levels
The chart below shows the positioning information for QQQ. Price falling below 527 would signal bullish to bearish positioning. A potential pause area is 525. Note that positioning is mostly bullish throughout the remainder of the year.

The Weekly Plan and trading idea
Going into this week, I have both bullish and bearish trades on the SPX ( the S&P 500 cash index). Therefore my current bias is neutral.
Current Bullish trade
For December 24 expiry I am net short puts with the following trade:
1 Long 5920 put, 2 Short 5910 put, 1 Long 5890 put.
This trade was put on for 1.80 credit per contract. It currently has probability of success of 85 percent to expire worthless.
Current Bearish trade
For Demember 24 expiry I am net short calls with the following trade:
1 Long 5165 call, 2 Short 6180 call, 1 Long 6220 call.
This trade was put on for 1.50 credit per contract. It currently has probability of 95 percent to expire worthless.
If I let the trades run till December 24, I will collect the full credit. I plan on closing these trades this week and potentially monetizing most of the credit received.
These two trade ideas combined form an iron condor. My trades are not in the purest view an iron condor, however contextually it is. I expect price to stay within a specific range of 5920 and 6180.
S&P futures Weekly Scenarios
Scenario 1
If price falls below 6050 then I would target 5980 - 6000
Scenario 2
If price moves above 6050 then I would target 6070 to 6100.
Curently, I am not adding to either of the trades listed, however I will look to take risk out of the trades (close them), once the profit hits 80 percent of the amount collected. If either trade goes against me, trades will get closed at break even or small loss. Currently both trades are profitable.
To compute the S&P 500 cash values, just subtract 10 from the S&P 500 futures to get the equivalent prices.
Have a successful trading week, by waiting for your trade setups to come to you. Always manage your risk and understand what you expect to lose prior to trade entry. By managing risk, you unlock profitability.
Gamma Level data (netgex data) and skew data (market sentiment) was provided by menthorQ.com
Disclaimer
Please don’t follow my idea(s) blindly. Do your own due dilligence before you attempt to trade. Again, always manage your risk.
Thank you for reading my weekly plan.
Joel
