


Weekly Plan for February 2
The S&P 500 was lower approximately .5 percent last week. Lots of volatility over the last month however the S&P 500 remained in a large trading range. I describe my weekly plan below.

Summary
S&P500 has been in a large trading range over the last three months. That is 5740 - 6128. Lots of volatility, large price swings, however going no where for the last 3 months. Ultimately this is very bullish long term as the S&P 500 back to back yearly gains of 20 percent are getting consolidated.
S&P 500 Monthly chart
We completed the month of January with a bullish candle. The highlighted area shows the last three months of consolidation in the S&P 500. Long term this chart is bullish.

Management of last week’s plan
When the trade was entered I was neutral S&P 500. I placed a broken wing CALL butterfly above the all-time high for a credit. This trade was taken off for a debit of .10 making this a win. You can review last week’s post here.
The CALL butterfly is a neutral to slightly bullish strategy as posted. It benefits when makes small upward price movement.
S&P 500 Futures Daily
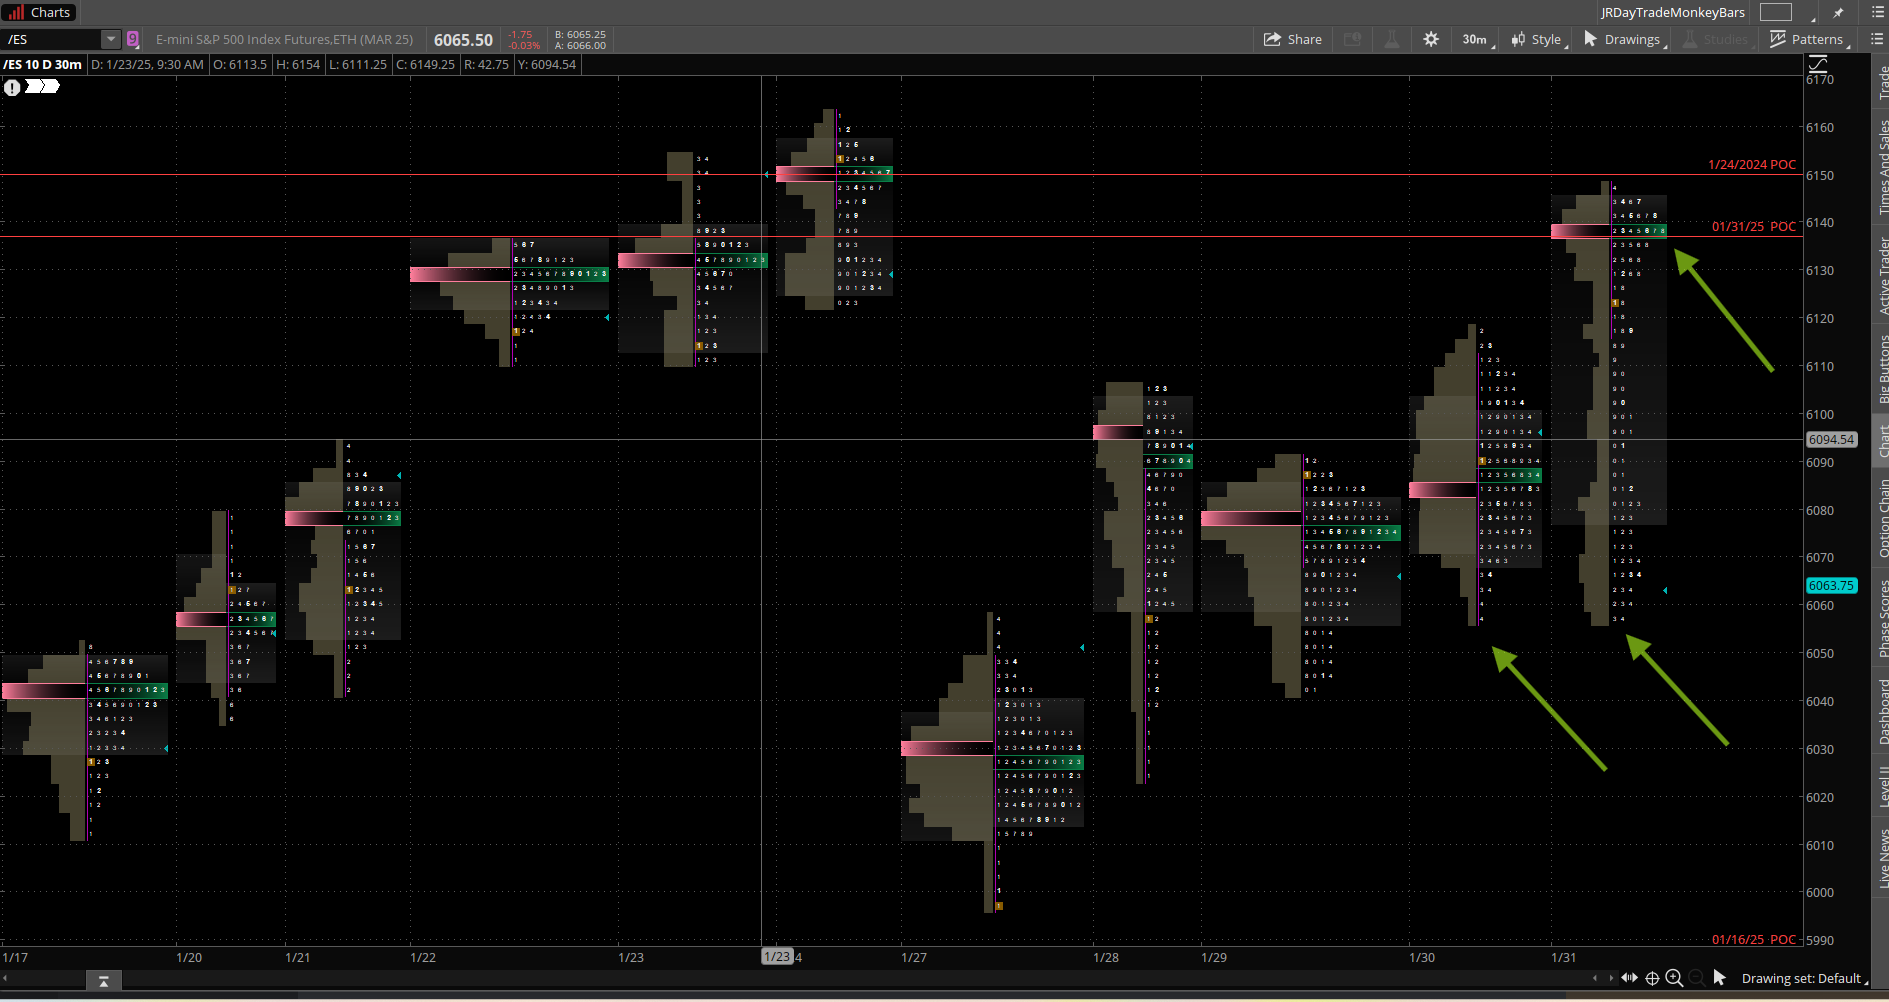
The chart below is the market/volume profile of the S&P futures. This chart is captured from the ThinkOrSwim trading platform. There are a few nuances in the chart which will impact this week’s trading in the S&P 500 futures and the S&P 500 cash index.
I have noted my observations below:
Friday’s price action formed a poor low. The point of control at the top of the chart shows that most of the volume and time was near the high of the day.
The poor low stopped at the exact same price level of the previous day. This indicates that short term players are in control as price stopped at such an exact level. Large players would not have stopped selling at this level and price would have continued lower.
The last 10 - 11 days shows that price has been in a large trading range, implying buy the bottom and sell the top narrative. A marginal new high was made in the S&P 500 cash index and does not reflect in the futures chart. The S&P 500 futures have not made a new high recently. The last new high in the S&P 500 futures was made in December 2024.
This price action indicates that short term momentum players are in control of the market price action.
Read about market profile and auction market theory here.
The Daily S&P futures chart.
The chart below is a 1 hour time-frame chart. It is a linear regression model that I created that helps me identify short term trends in the market. On Friday, it showed that the slope of S&P 500 futures price action went negative. The last arrow down was down. The strength of the downward trend is weak as measured by ADX (15.5). A value greater than 25 is considered a strong trend.

The daily chart is also showing negative momentum with the trend showing weakness. I am cautious this moment and will wait for stronger momentum to trade this chart.

The S&P 500 skew index has moved lower over the last week near 158. Therefore tail risk has moved lower indicating more complancy in the market. A definition of tail-risk hedges can be found here. This value is still relatively high indicating that market participants are still hedged to the downside. Based on current movement i don’t see any edge with this data point.
This chart shows weekly skew values over the past 2 years.

The Nation's Index
This chart shows that market participants are hedged for both long tail and short tail risk. 80% of the chart is red, implying that participants see greater risk to the downside.

Long Term rates (10 year Treasury)
After the FOMC cut rates there has been a steady increase in long term rates. This appears counter intuitative. The bond market is forward-looking, and higher long-term yields can reflect worries about inflation remaining persistent, high government debt levels, or a shift toward stronger economic growth despite lower short-term interest rates.
A rise in long-term rates increases the discount rate used to value future earnings of companies. The higher the discount rate, the lower the present value of future cash flows, which generally depresses stock prices.
This is particularly impactful for growth stocks, where a significant portion of their value is derived from future earnings. Technology stocks ( the nazdaq 100 or 30 percent of the S&P 500), for example, may be more sensitive to rising rates.
Rising long-term rates may make bonds more attractive relative to equities, as the yield on government debt increases. As bond yields rise, investors may shift funds from the equity market (S&P 500) into bonds, causing selling pressure on stocks.
The chart below shows the yield on the 10 year treasury. Yields are near the 4.5 percent level and are near the top of the range. Note that this inversely correlates to S&P 500 most recent up move.

S&P 500 Term Structure
The chart below shows the S&P 500 term structure. The structure implies that a large move in volatility will take place this week. Observe that the trend is higher over the next 5 - 10 days. I list the major events below.

S&P 500 Cash Gamma levels
For the next 15 days market participants are mixed. GEX is neither soldly bullish or bearish.
Customer positioning is from 5950 - 6150 over the week.
Market makers are positioned to trade in the opposite direction of the market movement. Therefore when customers are long a stock position the market maker takes a short in the same position. This accounts for the small staircase type upward trajectory. Additionally volatility is lowered muting the market moves. Market hedge out their risk by selling out of the money calls.
There is not a lot of conviction on either side of this market.

The chart shows the bullish/bearish positioning in the S&P 500 cash index.
The Net Gex chart is showing that 6025 is a key level in the S&P 500 chart this week. This is the high volume level. Price ended the week at 6040.50. Breaking below 6025, puts the market into a negative gamma position. Market makers may accelerate this move lower to 5950 at a minimum.

The market maker implied move for the S&P futures this week is +/- 104 points. Therefore the market maker expected range is between 5921 to 6145. This is a similar range to the previous week.
US Market Moving Events
In the week of February 02, 2025, several key events are expected to influence the financial markets. I have ordered by most significant:
Nonfarm Payrolls (2/7) – Historically the single biggest catalyst in this lineup.
Major Q4 Earnings (tech and other large S&P 500 components) – Can move the index if there’s a big surprise.
ISM Manufacturing PMI (2/3) – First major economic report of the month, key barometer of manufacturing health.
ISM Services PMI (2/5) – Gauges the largest segment of the economy (services).
ADP Employment (2/5) – Serves as an early read on the labor market. Weekly Jobless Claims (2/6) – Ongoing pulse check for labor.
JOLTS Job Openings (2/4) – Secondary labor data, still notable. Corporate/sector-specific news – Varies in impact depending on company size and storyline. Fed Speeches / Commentary – Could move markets if they signal policy shifts.
In summary, the S&P 500's performance this week will be shaped by a combination of domestic policy decisions, corporate earnings, economic data releases, and international developments (White House tweets). Investors should monitor these factors closely to navigate potential market movements.
QQQ Daily Chart
Looking at the QQQs or the Nazdaq 100 futures are an important part of my trading plan. The XLK (technology ETF) represents a 33% component of the S&P500. Therefore I use this as an indicator to trade the S&P 500.
The most recent move higher was weaker relative to the S&P. The current hourly chart shows weakness.

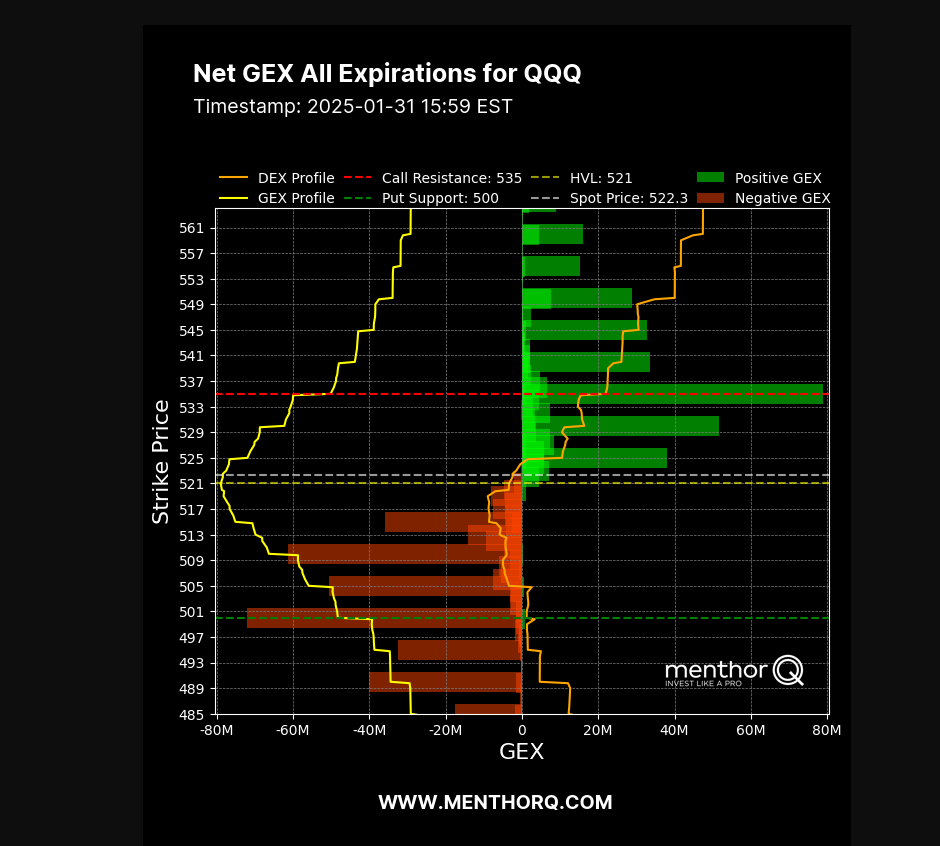
QQQ Gamma levels
The chart below shows the positioning information for QQQ. Price staying below 521 is viewed as bearish positioning. A sharp move down would see the QQQ move into negative gamma environment. This implies that market makers will trade in the direction of the down move and accelerate the move lower. A large down move in QQQ could potentially move the S&P 500 down as well.
The Weekly Plan and trading idea
Going into this week, I have a neutral view of SPX ( the S&P 500 cash index). I am currently flat any SPX trades.
I believe there is too much risk in the market to hold credit positions over the weekend.
S&P Cash Index Weekly Scenarios
Scenario 1
If price falls below 6025 then I would target(s) 5950, 5927, 5875. Each of these levels represent the lower area of the gaps made over the last 10 trading days.
Each of those price areas, could be place where large players go long.
Scenario 2
If price moves above 6120 then I would target 6150 - 6190.
Have a successful trading week, by waiting for your trade setups to come to you. Always manage your risk and understand what you expect to lose prior to trade entry. By managing risk, you unlock profitability.
Gamma Level data (netgex data) and skew data (market sentiment) was provided by menthorQ.com
How I trade
I did a presentation of my trading process with menthorQ on how I trade the S&P 500. You can watch it here.
Disclaimer
Please don’t follow my idea(s) blindly. Do your own due dilligence before you attempt to trade. Again, always manage your risk.
Thank you for reading my weekly plan.
Joel

Whenever key levels are respected whether it is TA, market profile, GEX I view it as smaller players are in control. It does not mean that the following day we will see a continuation of smaller player control. It is one data point to carry forward in your daily trading narrative. Think in terms of probabilities rather than absolutes!
Just found your X account and substack, really great writing, thank you for sharing. Point #2 in your first section - am I oversimplifying to interpret that as: on days when key GEX levels are respected (such as closing right at one of the levels) short term players are dominating so there is a higher likelihood of the levels being respected the next day?