Weekly Plan for February 9
The S&P 500 was lower approximately .25 percent last week. Similar story to the previous week Lots of volatility however a small change. I describe my weekly plan below.

Summary
The narrative has not changed as price remained in a large trading range for the last three months. The range is 5740 - 6128. Trading this market requires agility and a viewpoint of trading small and taking profits when available.
Lots of volatility, large price swings, however staying in a range. Ultimately this is very bullish long term as the S&P 500 had back to back yearly gains of 20+ percent. They are getting consolidated.
S&P 500 Weekly chart
For the weeks begining 1/27 and 2/3 the S&P gapped down approximately 100+ points. Each of these occurances caused strong buying to occur throughout the remainder of the trading week. A mildly bullish week has just completed.
The last three weeks made lower lows and lower highs. Therefore on a weekly time-frame this is bearish price action.
The week showed a long tail at the top indicating selling at the top. Potentially, this could signal a reversal for the coming week(s) with lower prices. The highlighted rectangle shows the last three months of price consolidation in the S&P 500, with the arrow pointing to last week’s price action. This price action is neutral indicating consoladation of last year’s up trending market.
Ultimately, the action is mixed, and trading the range is the current way to trade this market. That is buying the lower end of the range and selling the top.
Another way is to sell put credit spreads below the range when price is at the lower end as well as sell call spreads when price is near the top of the range.

Management of last week’s plan
Last week I remained neutral the market. My thesis was selling call spreads above the all time in the SPX and selling put spreads below the Sunday-Monday gap.
Last week’s plan is here.
S&P 500 Futures Daily
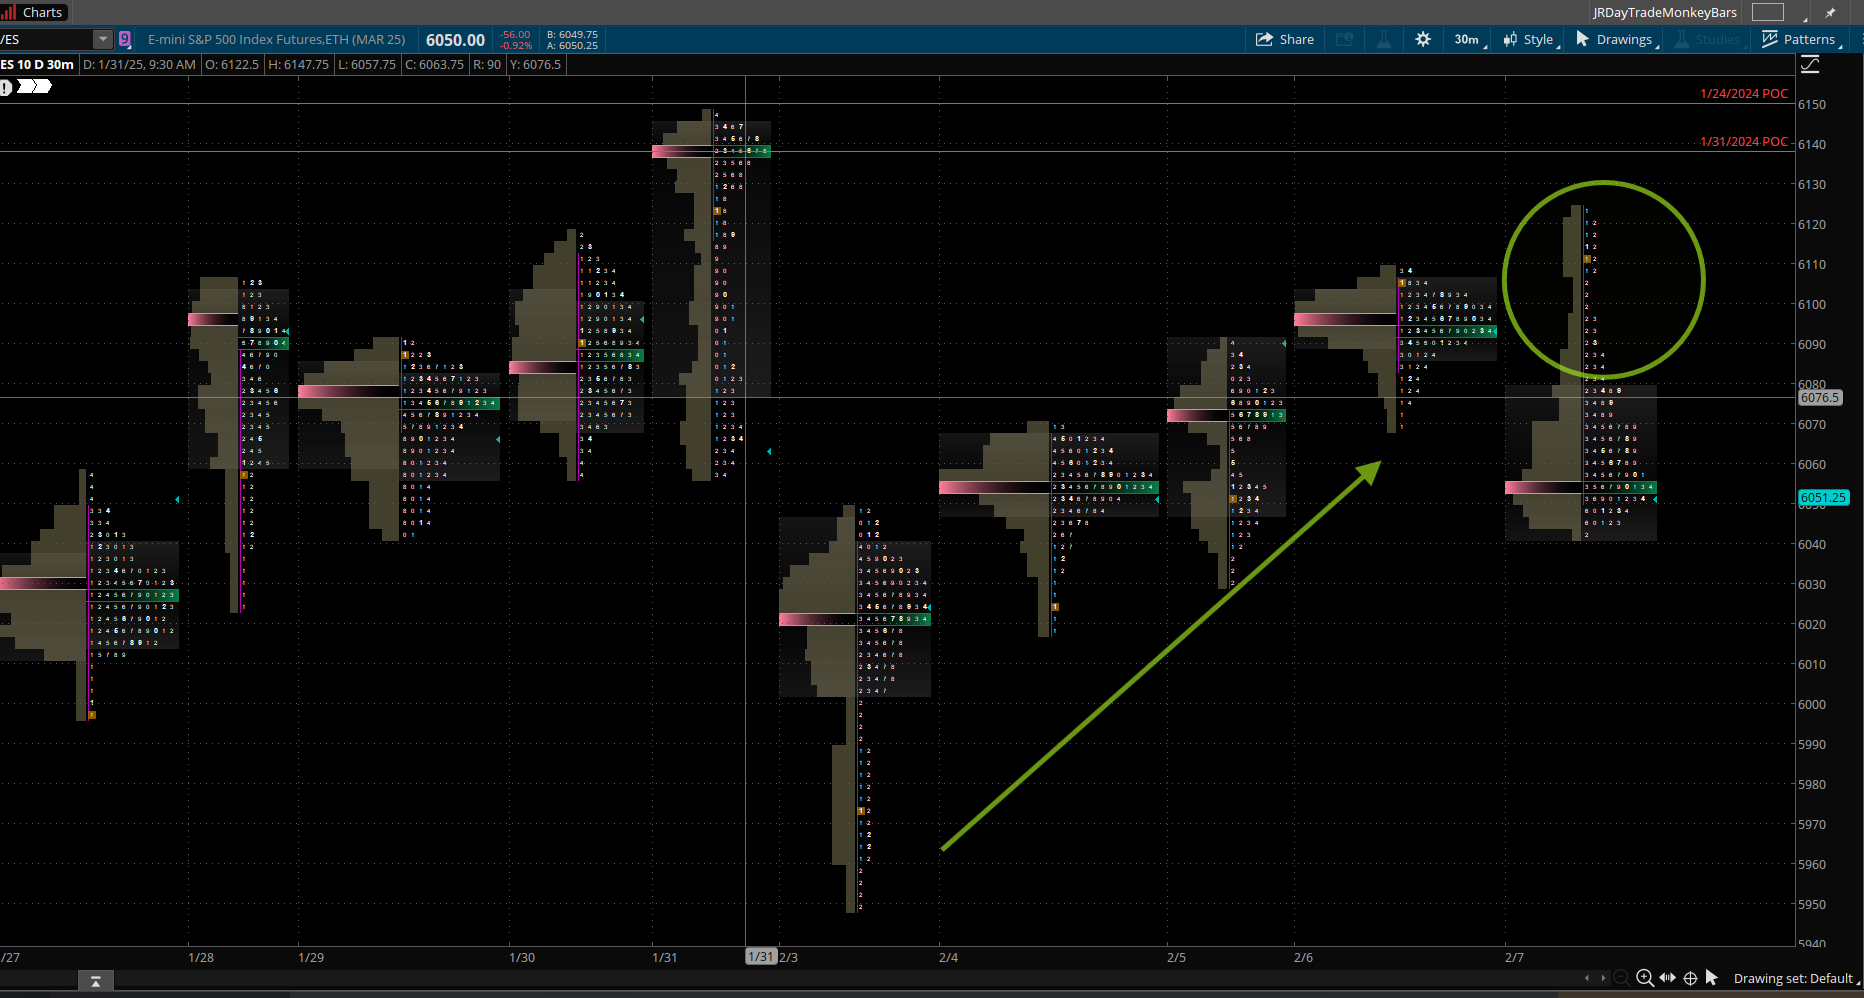
The chart below is the market/volume profile of the S&P futures. It represents the last ten days of trading. This chart is captured from the ThinkOrSwim trading platform. There are a few nuances in the chart which could potentially impact this week’s trading in the S&P 500 futures and the S&P 500 cash index.
I have noted my observations below:
The last 10 - 11 days shows that price has been in a large trading range, implying buy the bottom and sell the top narrative. The last new high in the S&P 500 futures was made in December 2024.
From Monday through Thursday price was one-time framing higher. This implies price was making higher lows and higher highs. The action was not exceptionally bullish as price action was overlapping the previous day and moving higher. The point of control did migrate higher each of these days. Price did not reach previous untested point of control(s) from January 24 and January 31.
Friday’s price action formed an excess high. The value area (70 percent of trading is performed in the value area) is in the lower end of the daily range of the price bar as well as the point of control. This implies that there was some conviction to the selling. Making an excess high or excess low, implies that the current auction is over and that price will mean revert in the opposite direction. Price does NOT have to mean revert. It implies that there is a potential for this outcome.
Read about market profile and auction market theory here.
The Daily S&P futures chart.
The daily chart of the S&P futures provides little information regarding the direction of the next move. Currently price is in the middle of the range. There is no directional bias. The market is range bound between 5900 - 6132 over the past week.

The S&P 500 skew index has moved higher over the last week near 166. It is in the middle of the range and does not provide any advantage for the current week. Therefore tail risk has moved higher from the previous week.
A definition of tail-risk hedges can be found here. This value is still relatively high indicating that market participants are still hedged to the downside. Based on current movement i don’t see any edge with this data point.
This chart shows weekly skew values over the past 2 years.

The Nation's Index
This chart shows that market participants are hedged for both long tail and short tail risk. 80% of the chart is red, implying that participants see greater risk to the downside. Things have not changed much from the previous week.

Long Term rates (10 year Treasury)
After the FOMC cut rates there has been a steady increase in long term rates. This appears counter intuitative. The bond market is forward-looking, and higher long-term yields can reflect worries about inflation remaining persistent, high government debt levels, or a shift toward stronger economic growth despite lower short-term interest rates.
A rise in long-term rates increases the discount rate used to value future earnings of companies. The higher the discount rate, the lower the present value of future cash flows, which generally depresses stock prices.
This is particularly impactful for growth stocks, where a significant portion of their value is derived from future earnings. Technology stocks ( the nazdaq 100 or 30 percent of the S&P 500), for example, may be more sensitive to rising rates.
Rising long-term rates may make bonds more attractive relative to equities, as the yield on government debt increases. As bond yields rise, investors may shift funds from the equity market (S&P 500) into bonds, causing selling pressure on stocks.
The chart below shows the yield on the 10 year treasury. Yields did not move much over the previous week (slightly down from the previous week).

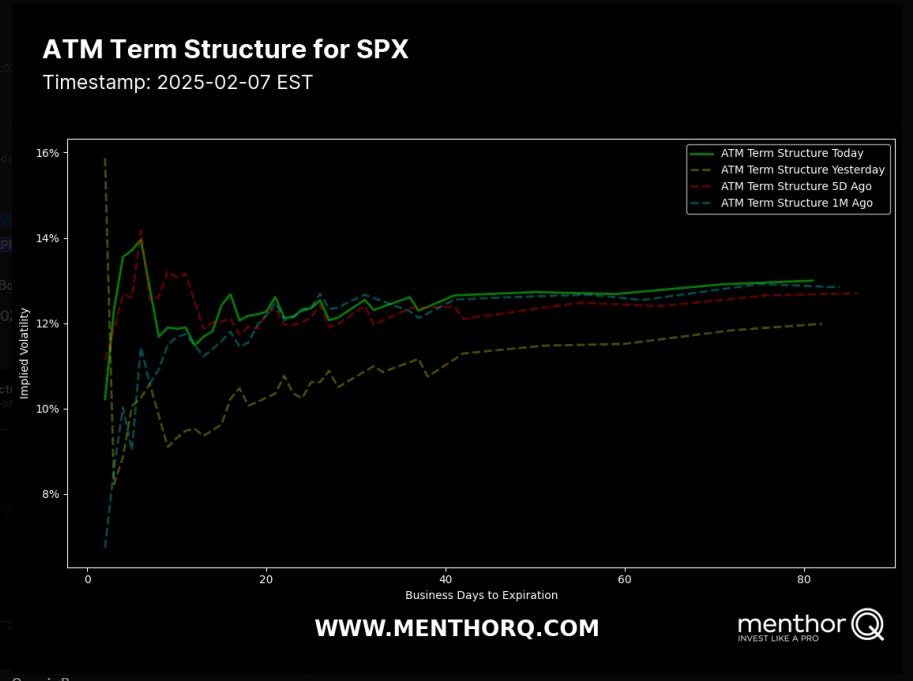
S&P 500 Term Structure
The chart below shows the S&P 500 term structure. The structure implies that a large move in volatility will take place this week. Observe that the trend is higher over the next 3 - 10 days. I list the major events below.
S&P 500 Cash Gamma levels
For the next 15 days market participants are mostly positioned bearish.
Customer positioning is from 5900 - 6150 over the week. Currently the market is in a small negative gamma environment. With negative gamma expect large moves in both directions. The key inflection area is 6055.
Market makers are positioned to trade in the opposite direction of the market movement. Therefore when customers are long a stock position the market maker takes a short in the same position. This accounts for the small staircase type upward trajectory. Additionally volatility is lowered muting the market moves. Market hedge out their risk by selling out of the money calls.

The chart shows the bullish/bearish positioning in the S&P 500 cash index.
The Net Gex chart is showing that 6055 is a key level in the S&P 500 chart this week. This is the high volume level. Price ended the week at 6026. Breaking above 6055 will take the S&P cash towards 6100. Breaking below 6000 will take the S&P 500 towards 5950 - 5920.
Again, as noted previously the S&P 500 is in similar range as the previous week.
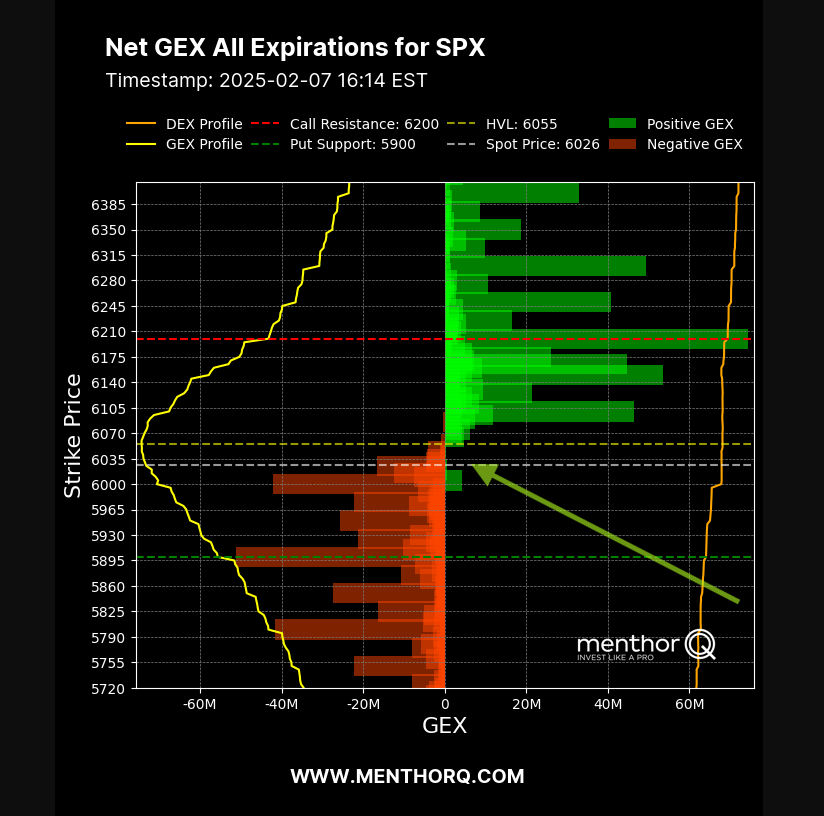
The market maker implied move for the S&P futures this week is +/- 89 points. Therefore the market maker expected range is between 5937 to 6126. This is a similar range to the previous week.
US Market Moving Events for the current week
I have listed the events in the order of significance (highest to lowest).
U.S. Consumer Price Index (CPI)
Projected Release: Wednesday, February 12, 2025 (morning)
Why It Matters: CPI is the most closely watched measure of inflation. Surprises in the inflation rate can significantly shift expectations around Federal Reserve monetary policy—potentially moving both stock and bond markets.
2. U.S. Producer Price Index (PPI)
Projected Release: Thursday, February 13, 2025 (morning)
Why It Matters: PPI tracks wholesale inflation and can be a leading indicator of consumer inflation trends. A big deviation from forecasts can spark market volatility, especially if it suggests future CPI surprises.
3. Retail Sales
Projected Release: Friday, February 14, 2025 (morning)
Why It Matters: Shows the health of consumer spending, a huge driver of the U.S. economy. Strong or weak retail data often drives immediate market reactions, especially in consumer-focused stocks.
4. Weekly Jobless Claims
Projected Release: Thursday, February 13, 2025 (morning, alongside PPI)
Why It Matters: Although it’s a weekly data point, jobless claims can shift market sentiment if there’s a notable uptick or drop. It provides a near-real-time gauge of the labor market’s health.
5. University of Michigan Consumer Sentiment (Preliminary)
Projected Release: Friday, February 14, 2025 (late morning)
Why It Matters: Offers insights into consumer confidence—another key factor in spending behavior and overall economic outlook.
Additional Possible Market-Movers That Week
Earnings Releases:
Monday, February 10, 2025:
McDonald's Corporation (MCD): The fast-food giant is expected to release its quarterly earnings before the market opens.
Tuesday, February 11, 2025:
The Coca-Cola Company (KO): Known for its global beverage portfolio, Coca-Cola will announce its earnings.
Shopify Inc. (SHOP): The e-commerce platform is set to report its financial results.
Wednesday, February 12, 2025:
Cisco Systems, Inc. (CSCO): The technology conglomerate will release its earnings report.
Robinhood Markets, Inc. (HOOD): The financial services platform is scheduled to announce its earnings.
Thursday, February 13, 2025:
Coinbase Global, Inc. (COIN): The cryptocurrency exchange platform will report its earnings.
Airbnb, Inc. (ABNB): The online marketplace for lodging is set to release its financial results.
Friday, February 14, 2025:
Moderna, Inc. (MRNA): The biotechnology company is expected to announce its earnings.
Fedspeak / Speeches:
Even if no Federal Open Market Committee (FOMC) meeting is scheduled in early February, speeches or interviews by Fed officials can influence interest rate expectations.
Geopolitical or International Data:
Key developments abroad—such as European GDP or Chinese trade data—can affect global sentiment and spill over into U.S. markets.
Keep an eye on OPEC (if any meeting is scheduled) for potential energy market volatility.
Treasury Budget Statement:
Often released around the 10th–12th of the month. It’s less impactful than CPI/PPI but can become more significant if fiscal policy is in focus.
QQQ Daily Chart
Looking at the QQQs or the Nasdaq100 futures are an important part of my trading plan. The XLK (technology ETF) represents a 33% component of the S&P500. Therefore I use this as an indicator to trade the S&P 500.
This chart is also range bound. Price found support at the 20 week moving average. This has been a key area of support over the last few weeks.

QQQ Gamma levels
The chart below shows the positioning information for QQQ. Price staying below 524 is viewed as bearish positioning. Currently price is slightly below the key inflection area of 524. That is 522.

The Weekly Plan and trading idea
Going into this week, I have a neutral view of SPX ( the S&P 500 cash index). The S&P index is range bound and I am selling credit spreads below the current area of support.
Sample Trade idea:
sell bull put spread for the end of week. This spread was put on for 1.4 per spread and was on the end of day friday.
Sold 1 put at 5910, Buy 1 put at 5900
This is a 1 hour chart of SPX. Spreads were sold below the volatilty curve for the end of week.

S&P Cash Index Weekly Scenarios
Scenario 1
If price falls below 6025 then I would target(s) 5950, 5927, 5875. Each of these levels represent the lower area of the gaps made over the last 10 trading days.
Each of those price areas, could be place where large players go long.
Scenario 2
If price moves above 6120 then I would target 6150 - 6190.
Have a successful trading week, by waiting for your trade setups to come to you. Always manage your risk and understand what you expect to lose prior to trade entry. By managing risk, you unlock profitability.
Gamma Level data (netgex data) and skew data (market sentiment) was provided by menthorQ.com
How I trade
I did a presentation of my trading process with menthorQ on how I trade the S&P 500. You can watch it here.
Disclaimer
Please don’t follow my idea(s) blindly. Do your own due dilligence before you attempt to trade. Again, always manage your risk.
Thank you for reading my weekly plan.
Joel