Weekly Plan for January 19
Last week saw the largest up move of 2025. The S&P 500 had a short covering rally of 250 points. Will buyers continue this move higher? I describe my weekly plan below.

Summary
S&P500 staged a large short covering rally equating to 240 points. Short term I expect consolidation before a move higher.
Management of last week’s plan
When the trade was entered I was positioned in a neutral to bearish trade for S&P 500. The market was below its short term moving averages (5, 8, 20 simple moving averages). Positioning was bearish at the begining of the week. I closed out the trade for a small profit in the early part of the week.
S&P 500 Futures Daily
The chart below is the market/volume profile of the S&P futures. Two large gaps were formed in the overnight session and are marked in the graphic below as the rectangles. Generally this can be construed as bullish price action. On Friday, most of the bullish action was in the overnight session with a relatively small advance in the day session. I will monitor price action and see if Friday’s gap is closed this week. That price is 6002 in the S&P futures. If price can not close Friday’s gap, then the price action can be construed as bullish and I have an expectation of seeing higher prices.
The price bar to right is Monday’s action. This is a market holiday (Martin Luther King day) and therefore this action is less relevant than the day timeframe price action. The arrow is pointing to this day.

The Daily S&P futures chart.
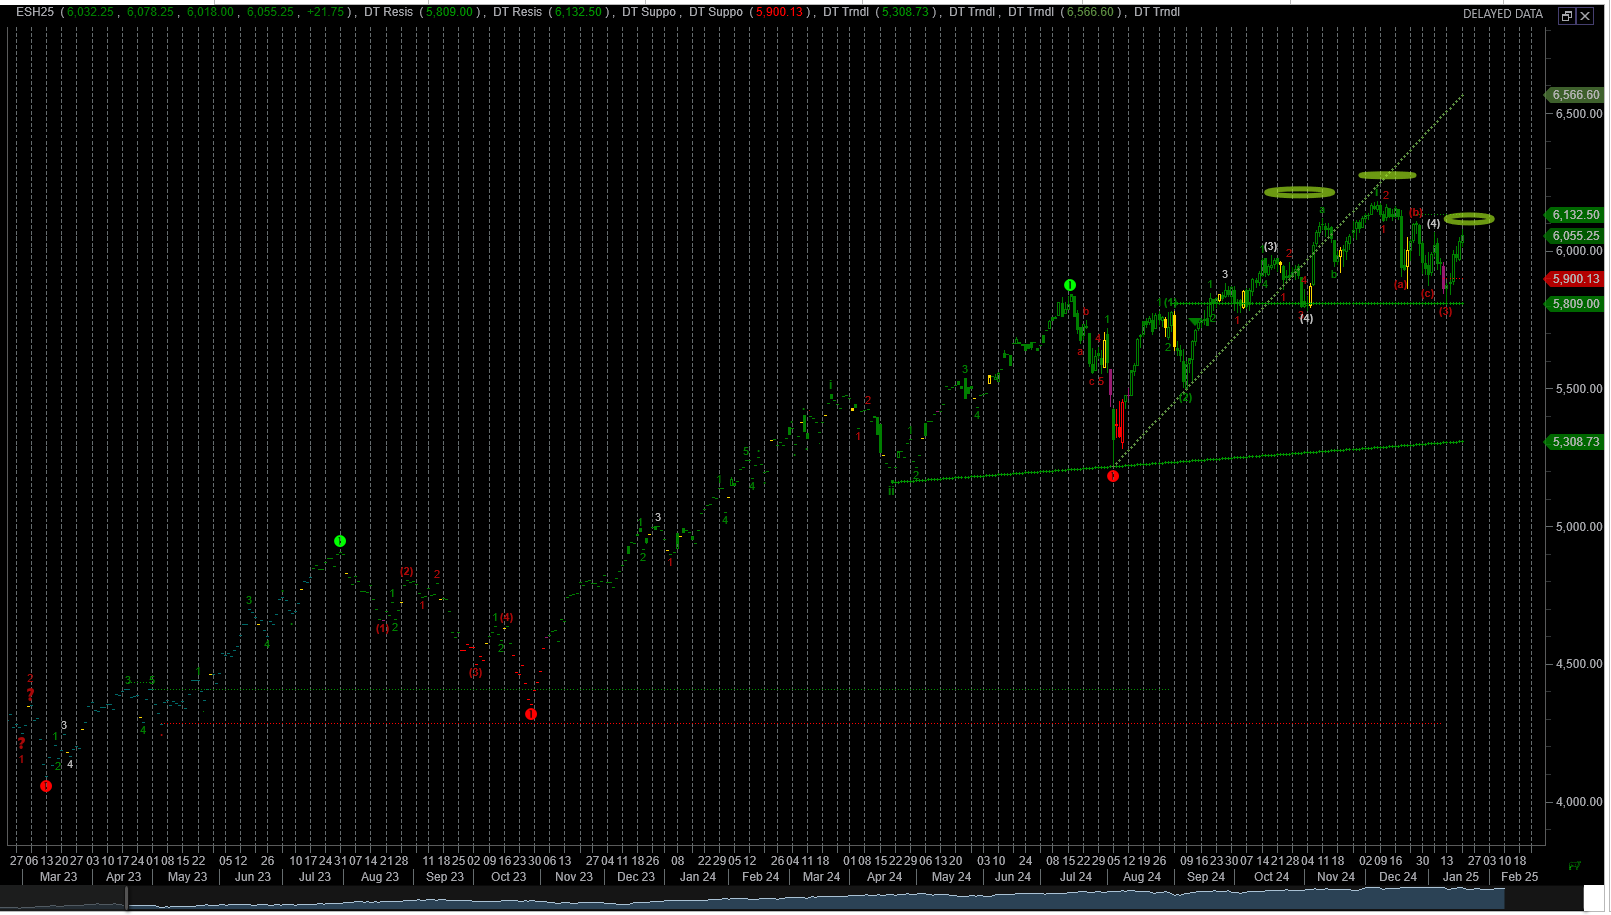
The chart below is the daily chart, including the price action from Monday’s holiday. I have placed a rectangle around an area which acted as resistance before. Therefore I would expect a pause in the upward price movement in this zone. This range is defined between 6050 and 6100.

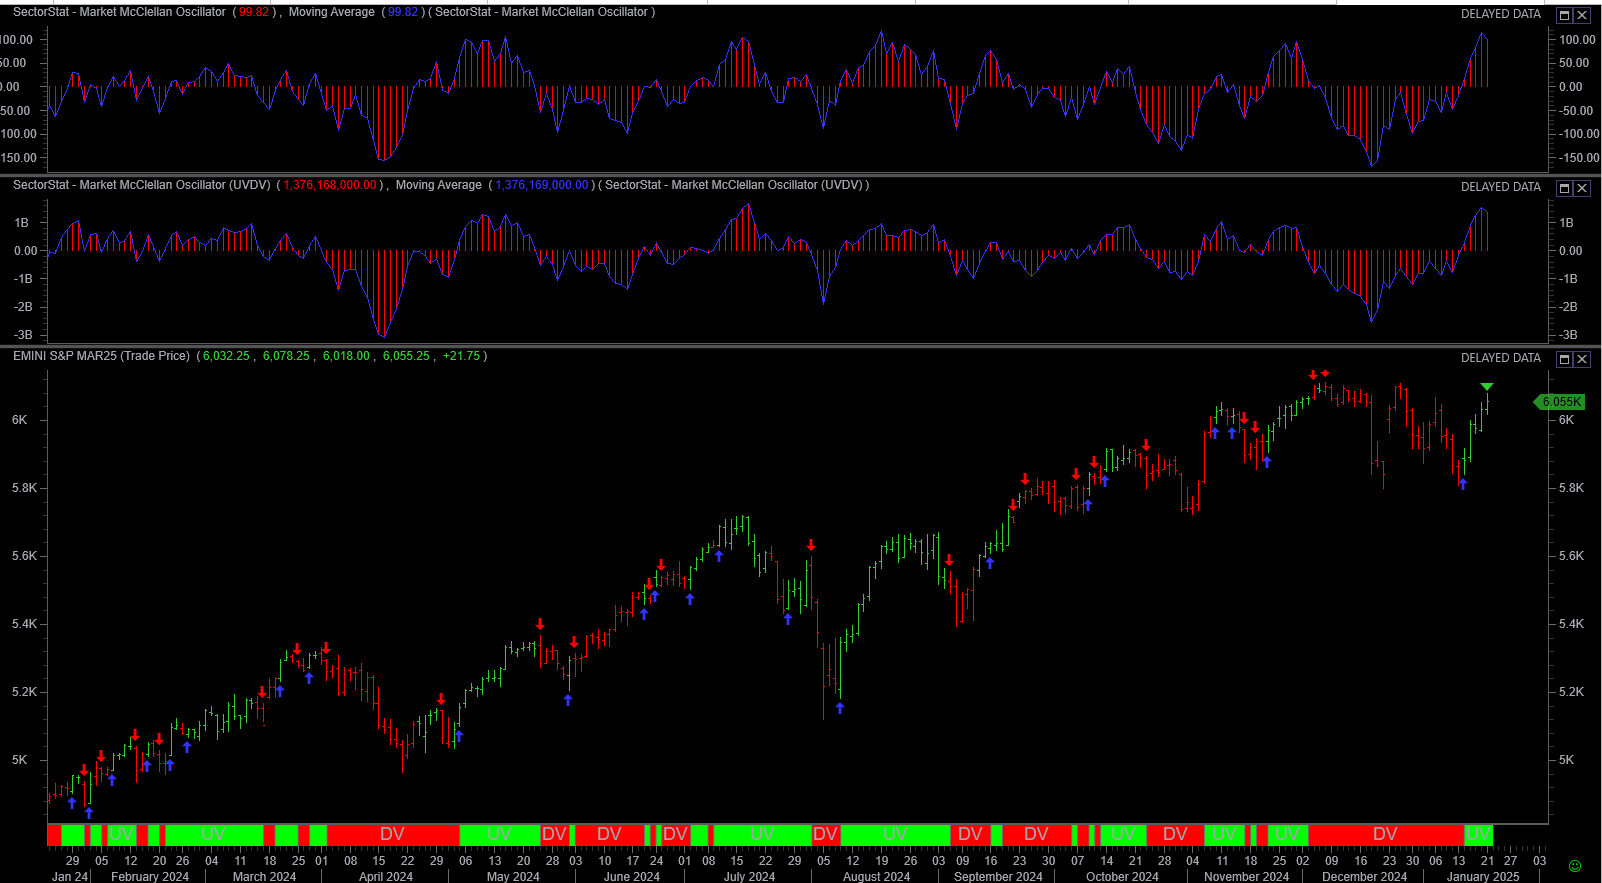
Both market and volume sentiment has moved from bearish to bullish over the last few days of trading. This is depicted by the daily chart below. This chart shows the McClellan Oscillator. The two histograms in chart represent market and volume sentiment. The S&P 500 price is shown in lower section of the chart.
The odds favor a move above this consolidation area after a brief pause.
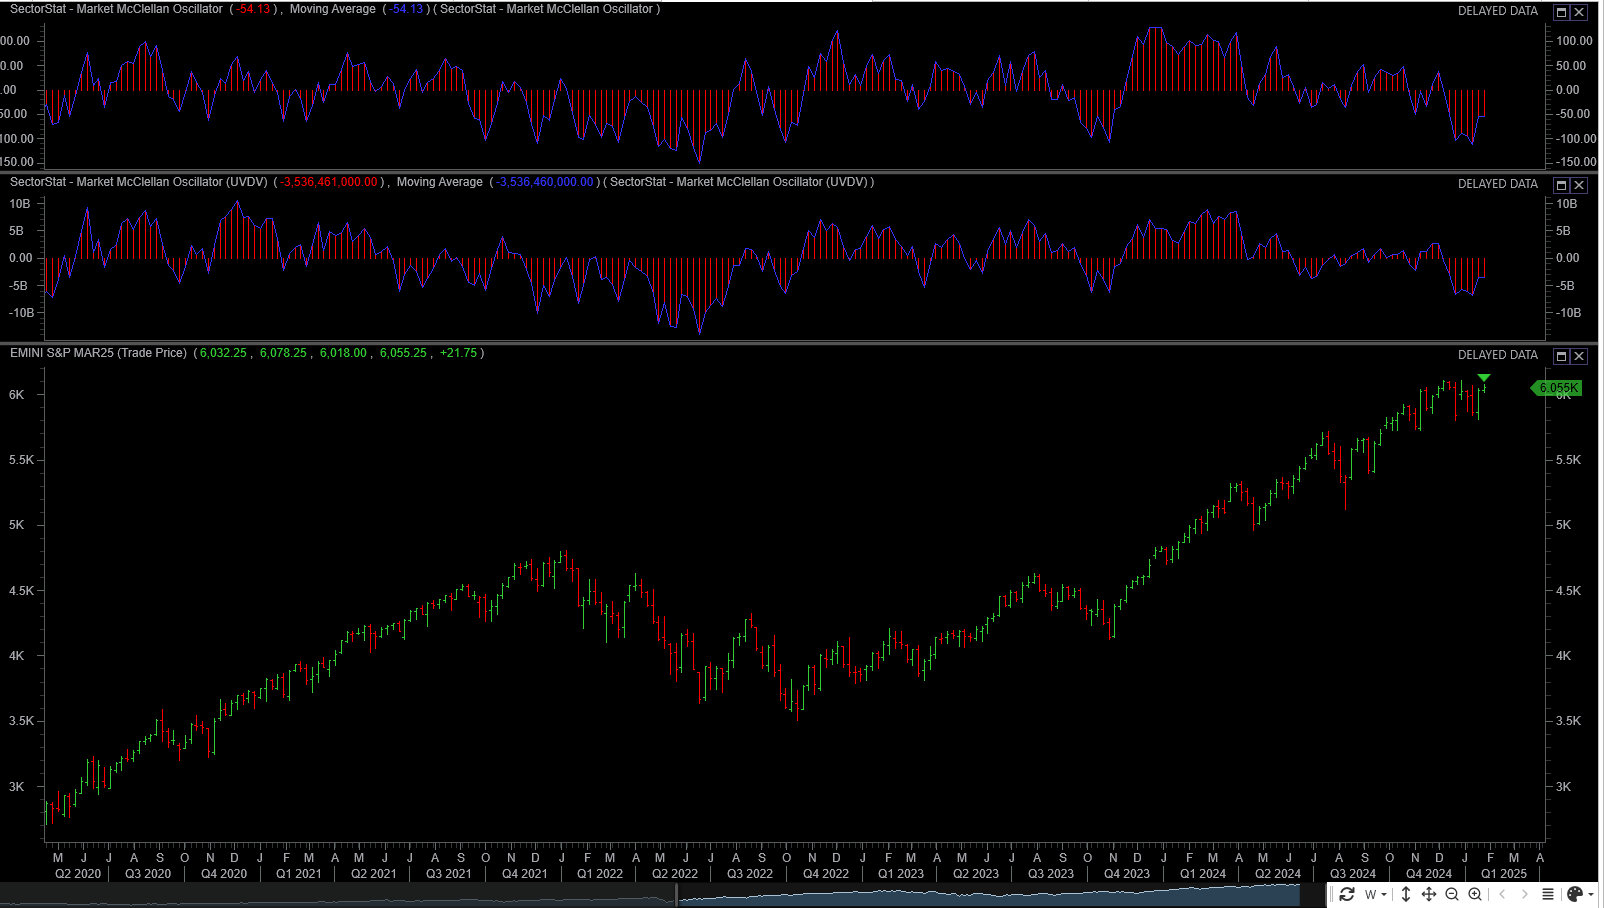
The weekly short shows that longer term market sentiment and volume sentiment is bearish. Therefore after this short term move plays out, I expect the S&P 500 to move lower.
Another interesting pattern is showing a head and shoulders’s pattern. This is a bearish pattern with a strong potential for greater downside price action. Currently price is approaching the right shoulder in the chart. For invalidation, price would need to break above the most recent high at 6170.
The S&P 500 skew has moved higher over the last week near 167. Therefore risk has moved higher for out of the money puts ( tail-risk hedges). This value is still relatively high indicating the market participants are still hedged to the downside.
This chart shows weekly skew values over the past 2 years.

Long Term rates (10 year Treasury)
After the FOMC cut rates there has been a steady increase in long term rates. This appears counter intuitative. The bond market is forward-looking, and higher long-term yields can reflect worries about inflation remaining persistent, high government debt levels, or a shift toward stronger economic growth despite lower short-term interest rates.
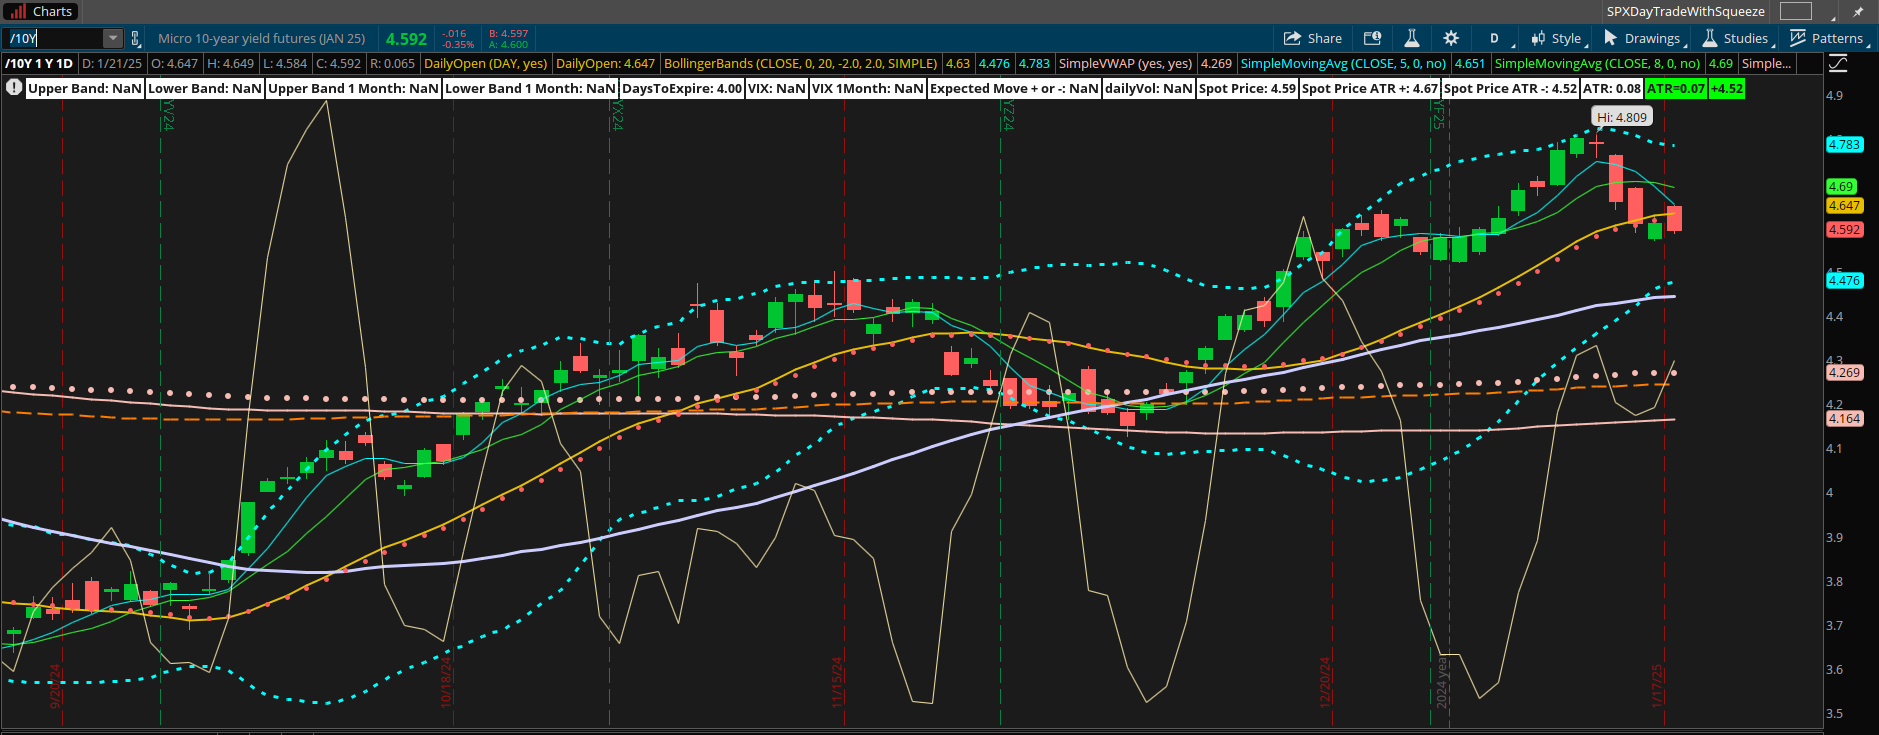
The chart below shows the yield on the 10 year treasury. Yields are near the 4.67 percent level.
A rise in long-term rates increases the discount rate used to value future earnings of companies. The higher the discount rate, the lower the present value of future cash flows, which generally depresses stock prices.
This is particularly impactful for growth stocks, where a significant portion of their value is derived from future earnings. Technology stocks ( the nazdaq 100 or 30 percent of the S&P 500), for example, may be more sensitive to rising rates.
Rising long-term rates may make bonds more attractive relative to equities, as the yield on government debt increases. As bond yields rise, investors may shift funds from the equity market (S&P 500) into bonds, causing selling pressure on stocks.
Rates have declined over the last four days, which probably corresponds to the large move in equities during the same time frame.
1/13/2025 was the most recent swing high in the 10 year treasury yield. This corresponded to the recent low in S&P 500.
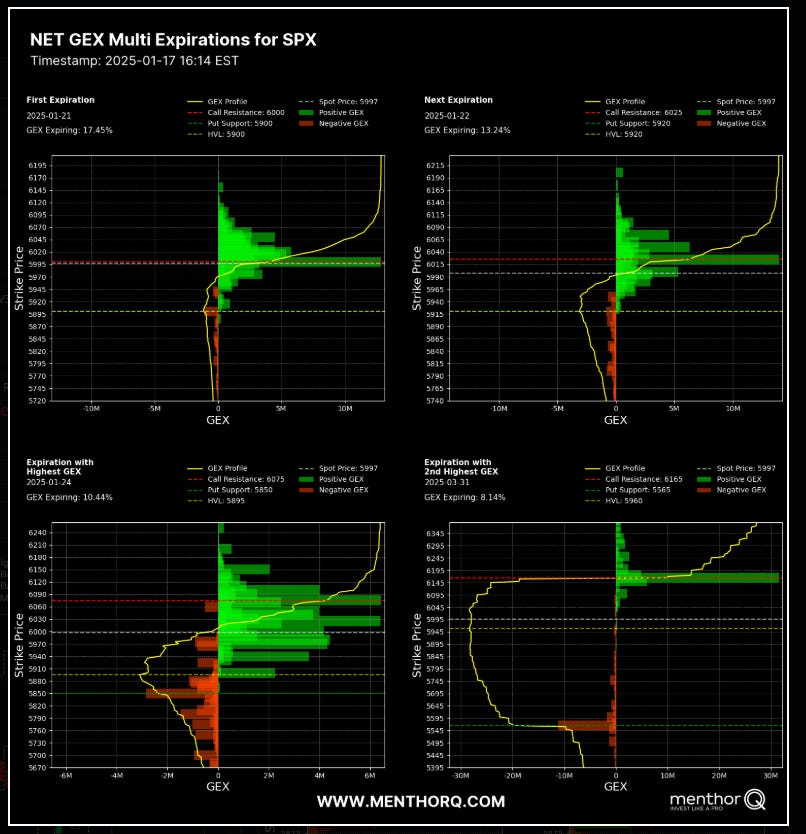
S&P 500 Cash Gamma levels
For the next 15 days market participants are positioned mostly bullish. The upward trajectory being 6100 in the S&P futures.
Market makers are positioned to trade in the opposite direction of the market movement. Therefore when customers are long a stock position the market maker takes a short in the same position. This accounts for the small staircase type upward trajectory. Additionally volatility is lowered muting the market moves. Market hedge out their risk by selling out of the money calls.
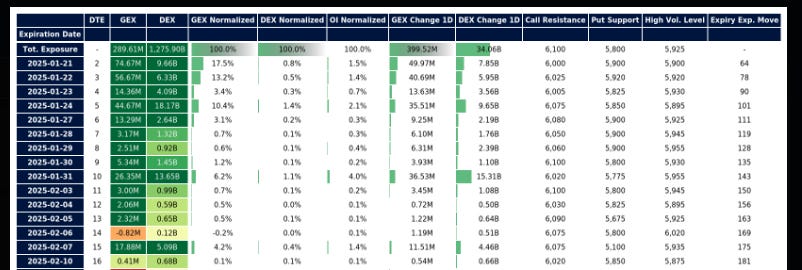
Market positioning is pictured here. Customer positioned is in the range of 6000 - 6070 for this week. Key upward price levels are 6025, 6050 and 6070 in the S&P 500 cash index.
The market maker implied move for the S&P futures this week is +/- 81 points. Therefore the market maker expected range is between 5920 to 6080.
US Market Moving Events
In the week of January 20, 2024, several key events are expected to influence the financial markets:
. Presidential Inauguration and Policy Announcements
Donald Trump's inauguration on January 20 marks the beginning of his second term as U.S. President. Investors are optimistic about his pro-business agenda, which includes trade reform, tax cuts, and deregulation. However, concerns persist regarding potential protectionist measures, such as tariffs on imports from Mexico, Canada, and China, which could impact global trade and market stability.
2. Executive Orders and Regulatory Changes
President Trump plans to sign numerous executive orders immediately after his inauguration, targeting areas like immigration, energy, and financial regulations. These actions could introduce market volatility, especially if they affect major sectors such as technology, energy, and finance.
3. Fourth-Quarter Earnings Reports
The earnings season continues with major corporations like Netflix, Johnson & Johnson, Procter & Gamble, and American Express scheduled to release their fourth-quarter results. These reports will provide insights into corporate performance and consumer demand, influencing investor sentiment and potentially impacting the S&P 500.
4. Economic Indicators
The release of January flash Purchasing Managers' Index (PMI) data will offer a snapshot of business activity and economic health. Previous data indicated robust growth in the U.S., contrasting with slower expansions in other developed economies. These trends could have implications for monetary policy and market expectations.
5. Global Events and Geopolitical Developments
President Trump's stance on international conflicts, including those in Ukraine and the Middle East, as well as his virtual address at the Davos summit, could influence global markets. Additionally, Europe's challenges with higher borrowing costs and energy prices, along with potential policy shifts from the Bank of Japan, may affect investor sentiment and market dynamics.
In summary, the S&P 500's performance this week will be shaped by a combination of domestic policy decisions, corporate earnings, economic data releases, and international developments. Investors should monitor these factors closely to navigate potential market movements.
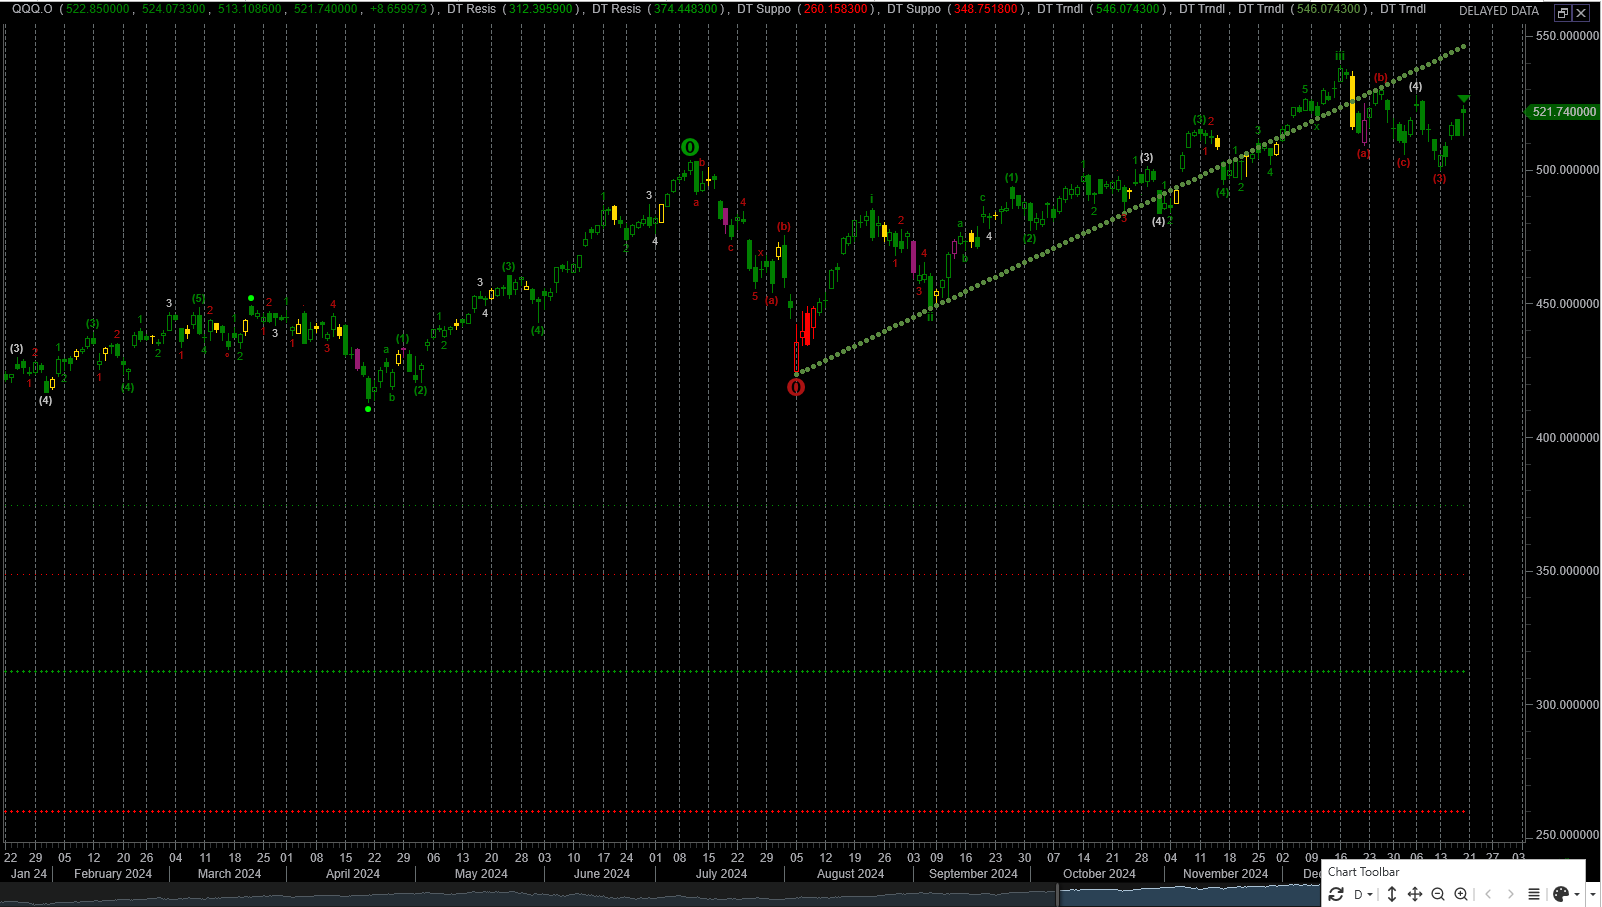
QQQ Weekly Chart
Looking at the QQQs or the Nazdaq 100 futures are an important part of my trading plan. The XLK (technology ETF) represents a 33% component of the S&P500. Therefore I use this as an indicator to trade the S&P 500.
The QQQs broke a long term trend line and I have bearish current view. A possible upside target is 527 - 530 in the short term.
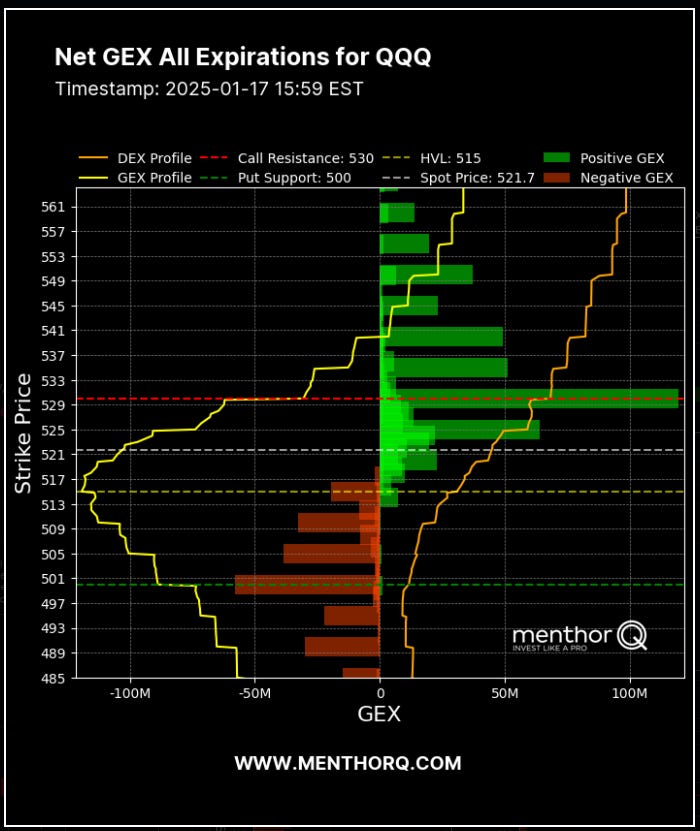
QQQ Gamma levels
The chart below shows the positioning information for QQQ. Price staying below 515 is viewed as bearish positioning. Above the 525 level is constructive to the bullish narrative with a target of 530.
The Weekly Plan and trading idea
Going into this week, I have a neutral to bearish trades on the SPX ( the S&P 500 cash index). I believe the current rally is short covering in nature.
Current trade
For January 31 expiry I am net short calls with the following trade:
1 Long 6080 call, 2 Short 6100 call, 1 Long 6150 call.
The trade is defined as a broken wing butterfly. I am viewing this as a credit collection trade, however the trade does have the potential to make 20 points on expiration. A standard butterfly is symetrical in that the long options are equdistant from the short option. In my trade, I have the higher purchased option a greater distance from the short strike in order to place this trade as a credit.
This trade was put on for $3.50 credit per contract. It currently has probability of 70 percent to expire worthless. The short strike was placed above the 20 simple moving average.
trade management
With the large move in S&P 500 last week (240 points) i will move the short strike higher by 10 points. This trade was placed after the initial gap in the futures. This provides a larger profit window with a smaller initial credit. With this change, the butterfly has a 60 point window of profit. It also cuts back on the initial credit received. This lowers the risk on the trade.
S&P futures Weekly Scenarios
Scenario 1
If price falls below 6030 then I would target 5950 - 5975. At approximately 5950, I would expect buyers to step in and for price to revert higher. An extensive move lower would target 5878.
Scenario 2
If price moves above 6050 - 6075 then I would target 6120. A secondary target is 6205. I expect price to mean revert from here.
To compute the S&P 500 cash values, just subtract 35 points from the S&P 500 futures to get the equivalent prices.
Have a successful trading week, by waiting for your trade setups to come to you. Always manage your risk and understand what you expect to lose prior to trade entry. By managing risk, you unlock profitability.
Gamma Level data (netgex data) and skew data (market sentiment) was provided by menthorQ.com
How I trade
I did a presentation of my trading process with menthorQ on how I trade the S&P 500. You can watch it here.
Disclaimer
Please don’t follow my idea(s) blindly. Do your own due dilligence before you attempt to trade. Again, always manage your risk.
Thank you for reading my weekly plan.
Joel