


Weekly Plan for July 7
The SPX squeezed higher for 9 consecutive days. Does the index have any gas left in the tank?

Summary
The S&P has put in a staggering 350-point rally over the last nine days making a number of new all-time highs. Moves like this are rare and may occur only once or twice a year. The week was a holiday shortened week, so major players were probably off on vacation. This can be seen from the lower volumes throughout the week.
One should not be surprised—after such a strong two-week run—to see price discovery to the downside.
The VIX appeared to have found a bottom last week, settling in the low 16s, an area where it typically turns higher over the last year. Therefore, I expect volatility to increase as the week progresses.
In the plan below, I will walk through areas where I believe price will find zones of support. Major players will seek liquidity in support zones and drive price higher.
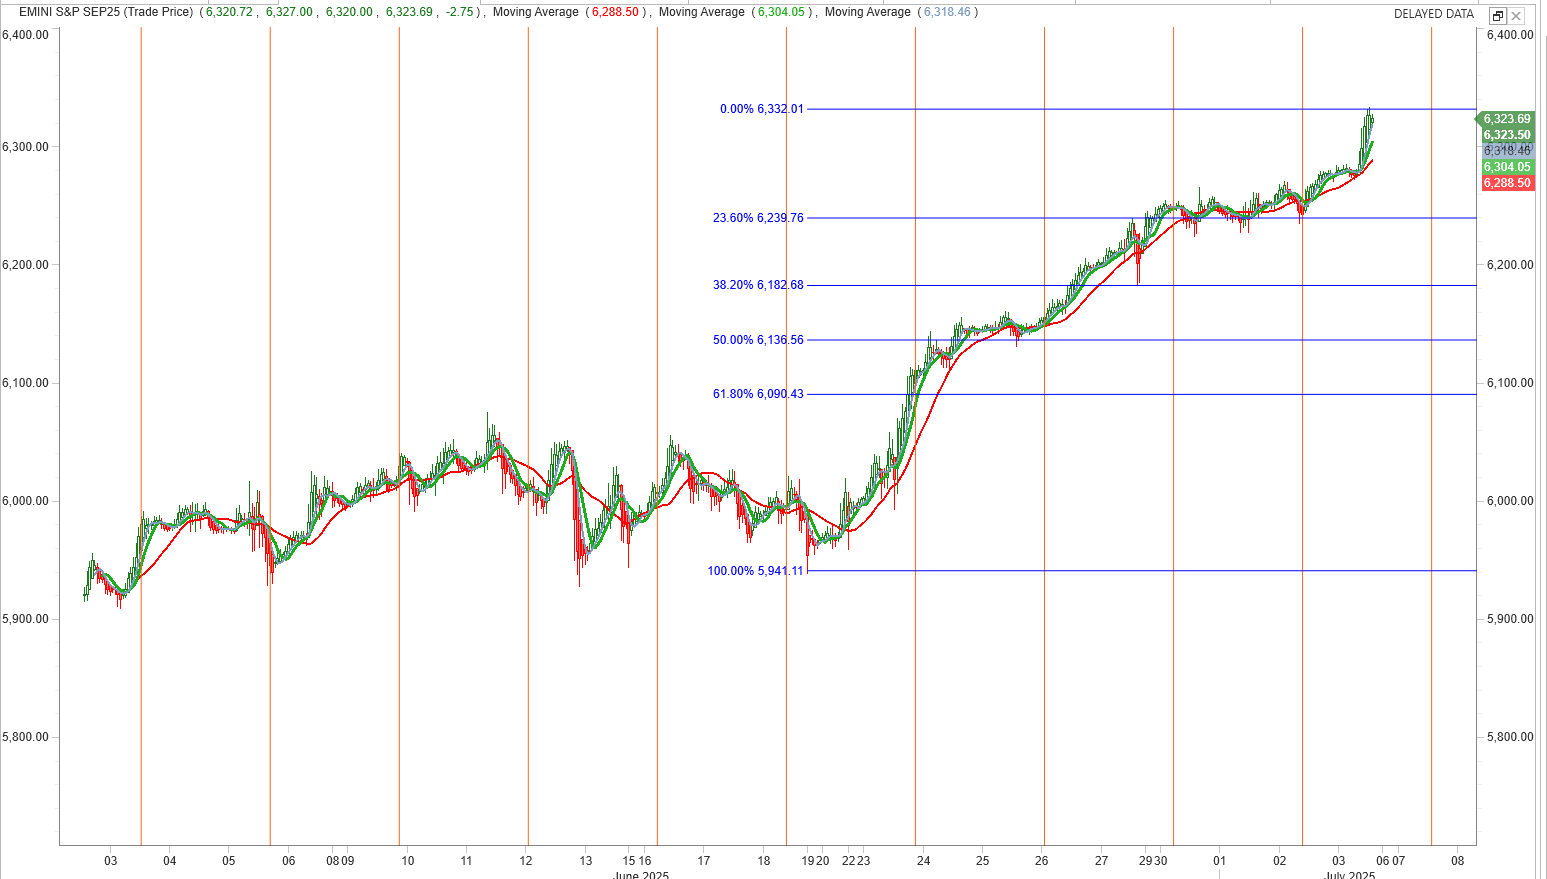
Below is the hourly chart of the S&P futures, showing price making higher highs. I have drawn fibonocci retracements from the most recent breakout to the high on Wednesday. Price bottomed at 5941 and the swing high is 6332.
In the sections below, I’ll walk through a range of data points that support both the bullish and bearish narratives heading into the upcoming week.
Absent a break below 5,941, the data remain bullish. I expect a consolidation of the recent rally this week For this week, I expect price to pause and consolidate the large move from the last two weeks.
I post weekly market updates, and you can find all of them here.
We begin with the S&P 500 futures monkey bars chart, incorporating both price action and positioning data to outline a trading plan for the week ahead. The monkey bar chart incorporates volume profile which provides clues into the current auction process.
📊 S&P Futures Daily Volume Profile chart
The image below shows a ThinkOrSwim Monkey Bars chart from last week, which combines volume data with market-profile information. My analysis concentrates on the volume-profile section. The pink bars on the left mark the Point of Control (POC)—the price level that attracted the greatest trading volume during the selected period. You can get a definition of it here. There are plenty of sources on the internet and books which provide excellent insight into its value.

The last price bar was generated on July 4 (holiday sesssion), so it’s treated as an overnight session—typically a low-volume period. From the graphic, price continues to make higher highs, higher lows and hasn’t revisited previous POCs. There are currently five stacked VPOCs (Virgin Point of Control) below the current price.
In subsequent days a point of control POC that was not touched becomes a virgin point of control VPOC.
In my experience, once seven or eight VPOCs go untested, price often mean-reverts to test those levels.
Each day’s high-volume node is higher than the last, signaling consistent acceptance at elevated levels and a clear bullish auction.
Conclusion & Trade Signals
1. Low-Volume Nodes (Single-Print Areas)
6 220–6 260 (between 6/27 and 6/30) sits as a low-volume gap.
6 300–6 320 (between 7/1 and 7/2) is another thin zone.
These zones become your first support on any pullback—price tends to “fall” into these holes and find buyers quickly.
2. Distribution Width & Holiday Compression
Pre-holiday (6/30–7/1) profiles are modestly wide—normal two-range days.
Post-holiday (7/2–7/3) distributions narrow substantially, reflecting very light summer tape and indecision around fresh highs.
3. Key Levels to Watch
6,330–6,340: Current high‐volume POC zone (7/2–7/3) — near-term magnet and resistance
6,300–6,320: Low-volume node between 7/1–7/2 — primary support on mild pullbacks
6,280: 6/30 POC — secondary support if 6,300–6,320 breaks
6,220: 6/27 POC — major fallback support and trend-confirmation level
Read about market profile and auction market theory here.
📊 S&P Futures Hourly chart
The chart shows hourly bars with a 20-period simple moving average. You can see how price has hugged this moving average throughout its ascent. The chart begins at the most recent breakout, and I’ve concluded that July 2 may have marked the peak of this move, which ran higher for nine consecutive days. Assuming price did top last Wednesday, I’ve overlaid Fibonacci retracement levels.

1. Fibonacci Retracement Levels details
Drawn from the June 18 low (5,941) to the July 2 high (6,332):
Uptrend intact: Hourly price is consistently above the 20-period SMA, which has a steep upward slope and catches buyers on each pullback.
Immediate support:
20-period SMA ≈ 6,292
23.6% Fibonacci retracement at 6,240
Secondary support:
38.2% Fib at 6,183
50% Fib (and June 25 POC) near 6,137
Trend invalidation: A close below the 61.8% Fib at 6,090 (and the SMA) would signal a deeper pullback or trend reversal.
Resistance: July 2 high at 6,332—needs a clean break and hold above to resume higher.
Tactical edge:
Lean into dips toward 6,292–6,240 with stops below 6,183.
Monitor failure below 6,183–6,137 to shift to neutral.
Only a sustained move above 6,332 reopens the next leg up.
Current Market Outlook Using Sectors
🔺 Broad Market Sector Summary

S&P 500 climbed +0.83% last week
Leaders:
Technology (XLK): +1.32%
Financials (XLF): +1.08%
Industrials (XLI): +0.85%
Solid performers:
Utilities (XLU): +0.75%
Communication Services (XLC): +0.55%
Consumer Discretionary (XLY): +0.55%
Flat-to-modest:
Energy (XLE): +0.12%
Health Care (XLV): +0.10%
Real Estate (XLRE): +0.05%
Laggards:
Materials (XLB): –0.07%
Consumer Staples (XLP): –0.05%
Takeaway: Growth-and-rate-sensitive sectors led, while traditional defensives (Staples, Materials) slightly underperformed.
📉 VVIX Chart
The VVIX is the CBOE volatility of volatility for the S&P 500. Whereas the VIX measures the market’s expectation of SPX volatility over the next 30 days, the VVIX measures the market’s expectation of how much the VIX itself will move over the next 30 days.
This index can signal potential turning points when an ongoing trend may mean revert.
How to interpret it
Rising VVIX often precedes or accompanies spikes in the VIX itself, signaling that volatility may accelerate (even if VIX is currently low).
Falling VVIX suggests implied volatility is calm and that VIX is likely to grind sideways or drift lower.
VVIX sits near the bottom of its one-month range and below its 20-day MA, with ultra-narrow Bollinger Bands—implying very muted expected moves in the VIX itself.
This would introduce a spike in the VIX.


📉 VIX Summary & Implications for SPX
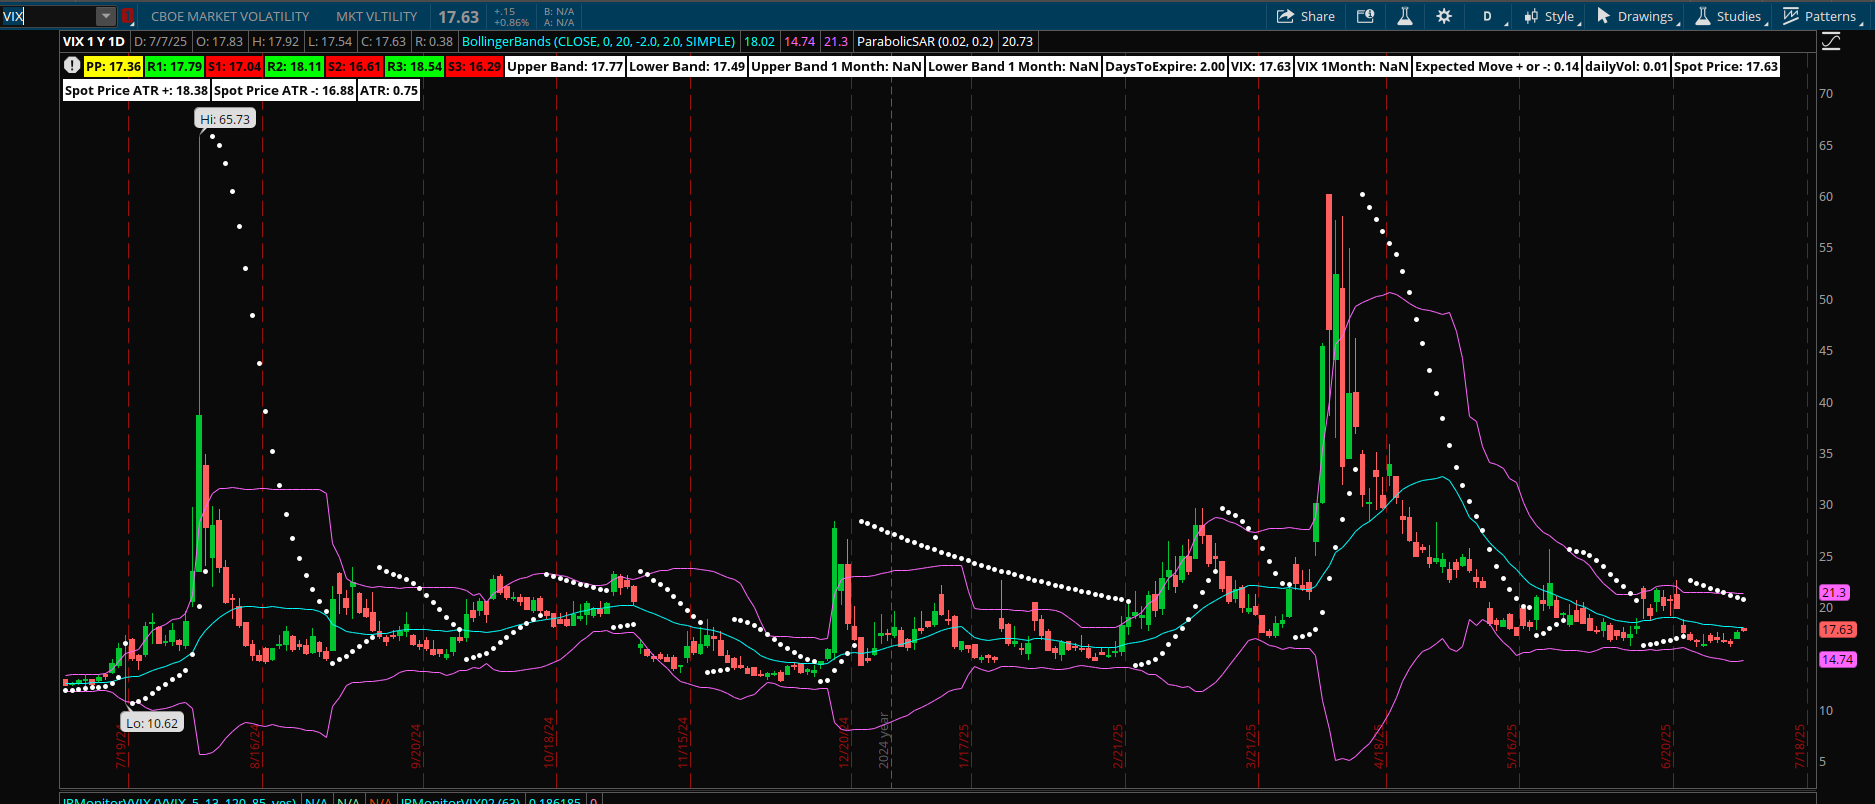
Observe that the VIX is in a narrow channel. A potential for a squeeze higher. If it sqeezes higher than we will see lower prices in the S&P 500.
Current VIX Readings
Level: 17.63, up modestly from mid-June’s low near 15.9
20-Day SMA: 18.02 (VIX still below, so the downtrend remains intact)
Bollinger Bands (20, ±2σ): Upper ≈ 21.3 / Lower ≈ 14.7 — bands remain constricted, signaling low vol
Parabolic SAR: Dots above price (20.7) confirm the prevailing downward bias in volatility
Pivot Points: Trading between PP (17.36) and R1 (17.79), so minor resistance sits just overhead
What This Means for SPX
Range-Bound Bias: VIX’s continued compression implies SPX will likely trade in a narrow, low-volatility range until a fresh catalyst arrives.
Bullish Tilt on Dips: With volatility subdued, buying small pullbacks in SPX (or selling front-end options premium) remains favorable.
Watch for a Vol Reversal: A sustained break of VIX above its 20-day MA (~18) or outside the upper BB (~21) would warn of rising equity risk—expect SPX to struggle and potentially test support zones.
Tactical Edge:
Sell near-dated credit spreads/iron condors on SPX to harvest accelerated theta.
Keep light vega hedges in 1-month options; front-end protection is expensive relative to realized calm.
The MenthorQ SMILE curve
The MenthorQ skew smile curve chart of the S&P 500 cash index.

🧭 Key Observations
Stable ATM vols: All four curves converge around 10–12% at ATM strikes (≈6 000–6 200), showing virtually no change in near-the-money expectations.
Put-wing easing: The deep-OTM put wing (<≈3 500 strikes) has ticked lower versus yesterday’s peak, yet remains elevated relative to five days and one month ago, reflecting persistent tail-risk premium.
Call-wing softening: OTM calls (>≈7 000 strikes) have also flattened modestly from yesterday’s levels, suggesting slightly reduced demand for upside protection.
Minimal day-to-day shift: Today’s (green) and yesterday’s (olive) smiles almost overlap across most strikes, indicating a very calm skew environment post-holiday.
S&P 500 Term Structure
The chart below shows the SPX term structure. The green line represents today’s curve, which is lower than it was over the past five days.
As the week progresses, the curve rises relative to last week, indicating a potential impending volatility shock.

The ATM term structure slopes up for the next handful of days, but it’s a much shallower, lower‐lying slope than we have seen recently. Therefore, we can observe that not a lot of risk in the current market.
S&P 500 Cash Gamma levels
The chart shows the positioning information over the next couple of weeks. It is heavily skewed to the upside.

Gamma SPX Summary
The current positioning implies that S&P 500 melt up will continue.
The heaviest dealer‐hedging will focus on 6,300–6,350 call walls and 6,100–6,180 put floors into the July 7–9 expiries.
A quarter of total gamma sits in the first week of July (DTE 2–6), with a single bucket (Jul 18) holding over 20%.
Expected moves remain sub-100 pts for the next three expiries, widening only after DTE 4—ideal conditions for defined-risk, premium-selling strategies around these strikes.
Economic Events for the Week
Here are the key economic events for the upcoming week, all times Eastern.
Here are the highest‐impact economic releases and speeches likely to drive volatility in U.S. markets this week (July 7–July 11):
Monday, July 7
No major data (markets reopen after the July 4 holiday)
Tuesday, July 8
10:00 am ET — JOLTS Job Openings (June)
A key gauge of labor demand; a big upside or downside surprise often ripples through equities and rates.3:00 pm ET — Consumer Credit (May)
Tracks household borrowing; can influence consumer‐spending narratives.
Wednesday, July 9
8:15 am ET — ADP Employment Change (June)
The private‐sector payrolls print, a soft lead on Friday’s official jobs data.2:00 pm ET — FOMC Meeting Minutes (June 17–18)
Provides detail on policymakers’ views—often sparks volatility in rates and equities.
Thursday, July 10
8:30 am ET — Initial Jobless Claims (week ending July 5)
A real‐time read on layoffs; a key high‐frequency labor market gauge.8:30 am ET — Wholesale Inventories (May)
Business‐spending indicator that can sway the manufacturing outlook.
Friday, July 11
10:00 am ET — Univ. of Michigan Consumer Sentiment (July prelim)
Measures consumer confidence; big swings can move both equities and bonds.
📉 Key Points
Keep an eye on any unscheduled Fed speeches or geopolitical headlines for outsized volatility.
NQ Futures Daily Chart
Looking at the QQQs or the Nasdaq100 futures are an important part of my trading plan. The XLK (technology ETF) represents a 33% component of the S&P500. Therefore I use this as an indicator to trade the S&P 500.
When both futures (e.g., S&P 500 and Nasdaq) align in the same direction, the probability of the prevailing price trend continuing increases.
For example, during the rally in early May 2025, both ES (S&P futures) and NQ (Nasdaq futures) moved higher in tandem—confirming bullish momentum and leading to a sustained uptrend across major indices.

⚠️ Key Takeaways
Near-term resistance:
23 000–23 050 – today’s local high and minor congestion zone
23 200–23 300 – February swing high
Upper trend-channel: ~24 864 – the rising channel’s top (dynamic resistance)
Immediate support (daily PSAR): ~22 265 – Parabolic SAR beneath price
First horizontal support: 22 150 – July swing low and early pullback pivot
Trend-line / low-volume node support: 21 750 – June consolidation low, lower bound of the rising channel
Secondary support: 21 000 – April–May congestion zone (breakout origin)
Major invalidation zone: 20 000–19 600 – April low (~19 900) and static dynamic support at ~17 583
Trend signal:
SAR dots remain below price → uptrend intact
A SAR flip above price (and a close under 21 750) would mark the start of a corrective phase.
QQQ Gamma levels
The chart below shows the positioning information for QQQ. The QQQ is the ETF for nazdaq 100.
📌 Summary Outlook for QQQ
QQQ Option Matrix: Key Takeaways (July 7–July 11)

Front-Week Gamma Concentration:
Jul 7 (DTE 2): 56 M GEX (11.1%) → Call wall: 555 • Put floor: 548 • Exp. move: ±9 pts
Jul 9 (DTE 4): 34.5 M GEX (6.8%) → Call 545 • Put 540 • ±12 pts
Jul 10 (DTE 5): 10.9 M GEX (2.1%) → Call 560 • Put 539 • ±14 pts
Jul 11 (DTE 6): 85.2 M GEX (16.7%) → Call 560 • Put 545 • ±15 pts
QQQ is likely to trade within 548–560 today and 540–560 into Thursday, with the biggest hedging flows focused around Jul 7 and Jul 11 expiries. Defined-risk, premium-selling structures around these pin/floor levels remain high-probability setups on this thin tape.
🧠 Implications for SPX (Correlation View)
Call‐Wall Mapping
QQQ 555–560 call walls (DTE 2 & 6) ↔ SPX 6 200–6 250
If Qs pin below 555, SPX is likely to stall into that 6 200–6 250 zone. A sustained breach in Qs drives SPX toward the next gamma wall (~6 300).
Put‐Floor Mapping
QQQ 540–548 put supports ↔ SPX 6 000–6 100
A drop under 540 in Qs tends to drag SPX into the 6 000–6 100 support cluster. Holding these levels in Qs generally keeps SPX buoyant.
Expected Range Alignment
QQQ’s ±9 pts (DTE 2) → SPX ±60 pts (~1%)
QQQ’s ±15 pts (DTE 6) → SPX ±100 pts (~1.6%)
Watch QQQ’s intraday move vs. its corridor—breakouts often foreshadow SPX punching out of its own implied ±50–100 pt ranges.
Gamma‐Hedge Timing
QQQ peaks in 1-day gamma on July 7 and in larger gamma on July 11 will coincide with SPX DTE 2 (~July 7) and DTE 6 (~July 11) expiries, triggering dealer delta‐hedging flows in both underlyings on those days.
Tactical Edge
Bullish Lean: QQQ holding above 555/560 → add defined‐risk SPX structures around 6 200–6 250.
Bearish Lean: QQQ breaking 540 → favors SPX put‐spread entries near 6 050–6 100.
Monitor QQQ for early signals—tech‐led pin or break usually drags/slingshots SPX in the same direction.
Management of last week’s plan
Last week I was short bear call spreads and they were hedged with long calls.
This week I am cautiously bullish. After a sustained 9 day push higher, I am looking for price discovery to the downside. Currently, no short dated option trades for this week.
I have a long dated hedge at this time with the expectation that price may mean revert.
You can review all of my posts here.
The Weekly Plan and trading idea
My general strategy for the current market is limit the weekend exposure to the market. With that being said, I am generally more than 75 percent in cash on any given weekend.
Since the market has become bullish, i would look for only bullish strategies. I would wait for price to make a small pullback prior to entry. For this week, I expect mean reversion from all time highs.
For S&P 500 futures analysis, I used the ESU25 contract (expires in September). I treat NQ and QQQ interchangeably in my analysis, and all trades are executed in SPX.
Sample trade ideas:
SPX-focused trade ideas for the week. They use weekly expiration
Bull Put Spread
Sell 6100 P / Buy 6075 P @ ~1.80 credit
Rationale: Leans into the 6000–6100 support cluster; strong front-end theta on a low-volume tape
Call Calendar Spread
Sell Jul 11 6 200 C / Buy Jul 18 6 200 C @ ~0.50 net debit
Rationale: Sells cheap front-end vega, retains a touch of one-week-out protection if a surprise shock hits
Have a successful trading week.
Let your trade setups come to you—don’t chase. Remember to size down your trades and always define your risk in advance. Patience and size discipline are edge amplifiers, especially in high-volatility environments.
Managing risk is what keeps you in the game; discipline is what makes you profitable.
Gamma Level data (netgex data) and skew data (market sentiment) was provided by menthorQ.com
Presentation on GOLD
I did a presentation on trading gold June 17.
You can watch it here:
How I trade
I did several presentations with menthorQ. You can find them here. This is under the highlights section of my “x” account found here.
Follow me on X formerly twitter . I post my market view during the week.
Disclaimer
The trade ideas provided are for educational purposes only. These ideas are based on the analysis I have performed. Make sure you do your own due dilligence prior to taking on any risk! Always manage your risk.
Thank you for reading my weekly plan.
Joel
