Weekly Plan for June 15
S&P Hits Snooze at 6000. Dealer Hedging Could Make Juneteenth/OPEX a Range-Bound Grind. Let's review the previous week and get into the weekly plan.

Summary
After a 1,110-point surge from April 9 to May 14, the S&P 500 has shifted into classic digestion mode. Last week’s range was a scant 1.1 percent—evidence of time-based consolidation rather than price retracement. Geopolitical flare-ups sparked brief volatility, yet the index keeps posting higher weekly lows, maintaining its one-time-framing structure.
Below is the weekly chart of the S&P futures, showing weekly higher lows.
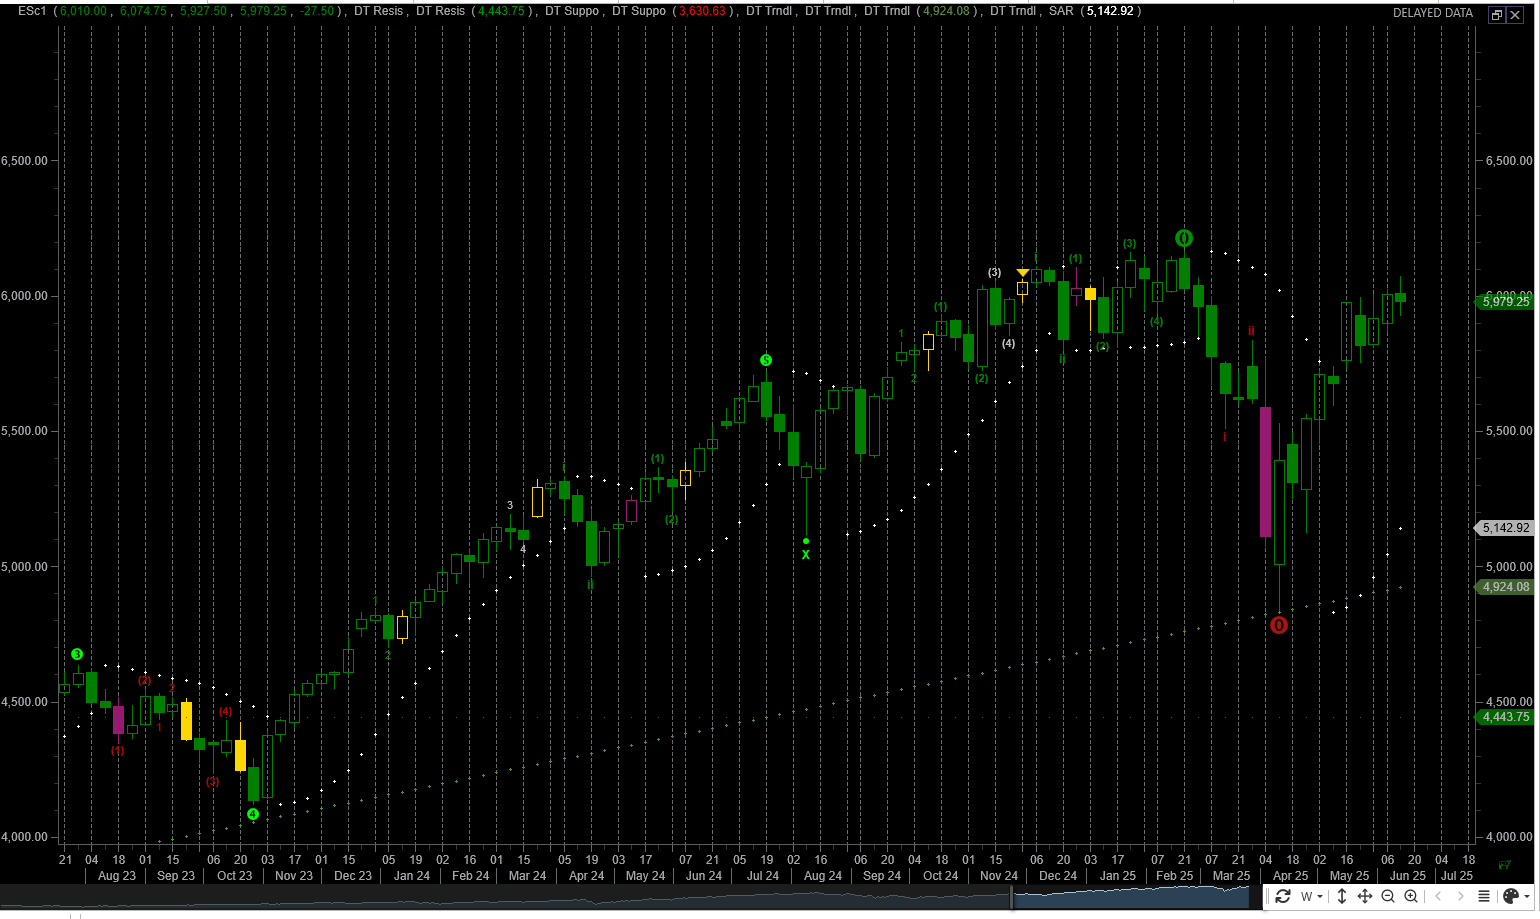
Even with the geopolitical action, the S&P mostly ignored the noise. Until a weekly bar finally breaks its predecessor’s low, the dominant bias stays up. The chart’s rising staircase tells us consolidation is still constructive rather than distributive—treat shallow dips as opportunities, not preludes to collapse.
In the sections below, I’ll walk through a range of data points that support both the bullish and bearish narratives heading into the upcoming week. With several key economic catalysts on deck, there is a potential for a volatility spike around these events.
I post weekly market updates, and you can find all of them here.
We begin with the S&P 500 futures monkey bars chart, incorporating both price action and positioning data to outline a trading plan for the week ahea.d. The monkey bar chart incorporates volume profile which provides clues into the current auction process
📊 S&P Daily Volume Profile chart
The image below shows a ThinkOrSwim Monkey Bars chart, which combines volume data with market-profile information. My analysis concentrates on the volume-profile section. The pink bars on the left mark the Point of Control (POC)—the price level that attracted the greatest trading volume during the selected period. You can get a definition of it here. There are plenty of sources on the internet and books which provide excellent insight into its value.

The chart contains a few subtle features that shed light on the current price action. I’ve highlighted two critical zones with arrows:
Poor low (Friday’s session): The bar on the right displays a “poor low,” where multiple time-periods halted at the same price, signaling unfinished auction business. Price initially rejected this level and bounced, however poor lows are often revisited and resolved later.
Downside target (5920–5 900): The arrow on the left marks this support band; 5916 is a prominent high-volume node. Futures already gapped down to this zone in Friday’s overnight session (not shown on the chart), reinforcing its significance.
Given these factors, I expect the market to probe the 5920–5900 area again before any sustainable move higher develops.
Read about market profile and auction market theory here.
📍 Updated Parabolic SAR (PSAR) Analysis

Bias still higher while above 5 896 (SAR)
• Friday’s fade merely tagged the first intraday support band; momentum traders will defend that area on any early dip.Support ladder: 5896 → 5772 → 5102
• Each rung sits roughly 120–150 pts apart—room for optionality trades that monetise pullbacks without assuming a trend break.If the 5900 zone holds, the up-channel remains the path of least resistance. A daily settlement beneath it would be the first real evidence that the two-month rally is handing control back to sellers.
🌊 Elliott Wave Count (Tentative Interpretation)
The market is presently carving out Wave 4. The 5,780–5,720 ES zone—about a 23–26 % retracement of Wave (iii) and aligned with a high-volume shelf—stands out as the most probable termination area for this corrective leg.
🎯 Projected Upside Targets – Wave (5)
Once wave 4 completes, the potential upside targets are listed below:
6 120 – 6 160: Minimum Wave-5 objective—retest and slightly exceed the May-14 all-time high (6 162).
≈ 6 200: Wave-5 = 38.2 % of Wave (iii) (≈ +155 pts from a 5 780 Wave-4 low); round-number magnet.
6 250 – 6 275: 1.272× external Fib extension of Wave-4 and midpoint of the rising April channel.
6 320 – 6 350: Channel top plus 1.382× extension of Wave (iii); typical spot for Wave-5 exhaustion.
6 375 +: 1.618× extension—“stretch goal” reached only under euphoric sentiment and continued vol compression.
Spot Up Vol Up:
One sign the market was approaching a short-term top was the unusual combination of a rising ES price and a rising VIX. When volatility increases in tandem with S&P prices, it usually suggests the rally is losing stability and a near-term pullback is likely.
Current Market Outlook Using Sectors
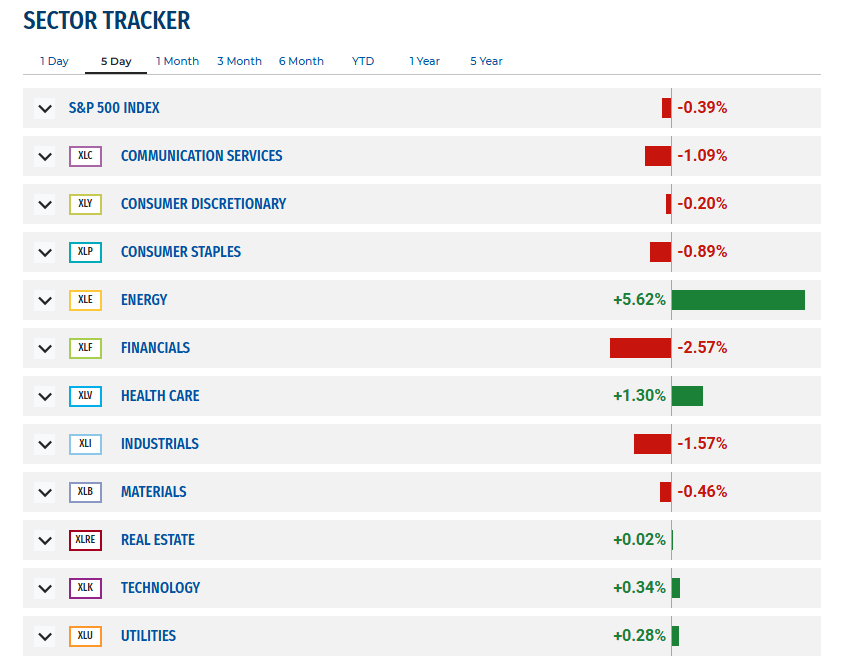
🔺 Broad Market Showed Sector rotation
Risk-on leadership flipped to Energy as crude prices popped; this sector contributed the bulk of index support.
Defensive pockets (XLV, XLU) outperformed the tape, hinting at a mild safety bid.
Cyclicals (XLF, XLI) and communication megacaps cooled, dragging the broad market slightly red.
Overall, the week showed sector dispersion rather than broad risk-off: strength was concentrated in Energy and select defensives, while financials bore the brunt of selling.
📝 Weekly Sector Summary – Implications for the Week
Tactical Take-Aways
Narrow leadership = fragile tape. One sector (Energy) accounted for virtually all index support; breadth deterioration means any pullback in oil could drag SPX below the 5 960–5 930 shelf.
Defensive tilt hints at caution into FOMC/OPEX. Keep an eye on XLV & XLU relative strength; if they accelerate while SPX chops, treat it as a “stealth” risk-off signal.
Financials are the canary. Regional-bank ETF (KRE) under its 20-dma would amplify downside gamma on any negative Fed surprise—hedge broad longs below XLF $40.80.
Rotation opportunity: Consider a pairs trade—long XLE vs. short XLF/XLI—until the curve steepens or oil rolls over. Tighten stops going into Friday’s OPEX.
VIX Chart
The VIX is a number that measures how much people think the S&P 500 will move (up or down) over the next 30 days.

📉 VIX Summary & Implications for SPX
Volatility has stopped falling: Spot VIX has bounced from ~15 to ~20.8 and just crossed above its 20-day SMA (≈18.6).
Implication: The low-volatility “tailwind” that kept SPX pinned near 6 000 is fading; headline risk now matters.Down-trend line in VIX is broken, but SAR hasn’t flipped bullish yet (needs ≳22–23).
Implication: Until VIX closes above 22–23, expect SPX to stay in a broad chop(5930–6045). A decisive VIX break higher would likely crack the 5927 weekly low and open the 5880/5850 shelf.
Bollinger Bands on VIX are widening after a May squeeze.
Implication: Larger intraday swings in SPX become more probable; size positions lighter and harvest theta faster, especially into Wednesday’s FOMC and Friday’s OPEX.If VIX quickly mean-reverts back under 18 post-FOMC:
Look for SPX to re-test 6 045 and potentially launch Wave-5 extension toward 6 120+.If VIX accelerates through 24:
Prepare for an SPX slide toward 5 780–5 720 (Wave-4 target zone) and a possible gamma-flip that magnifies downside speed.
The MenthorQ SMILE curve
The MenthorQ skew smile curve chart of the S&P 500 cash index.
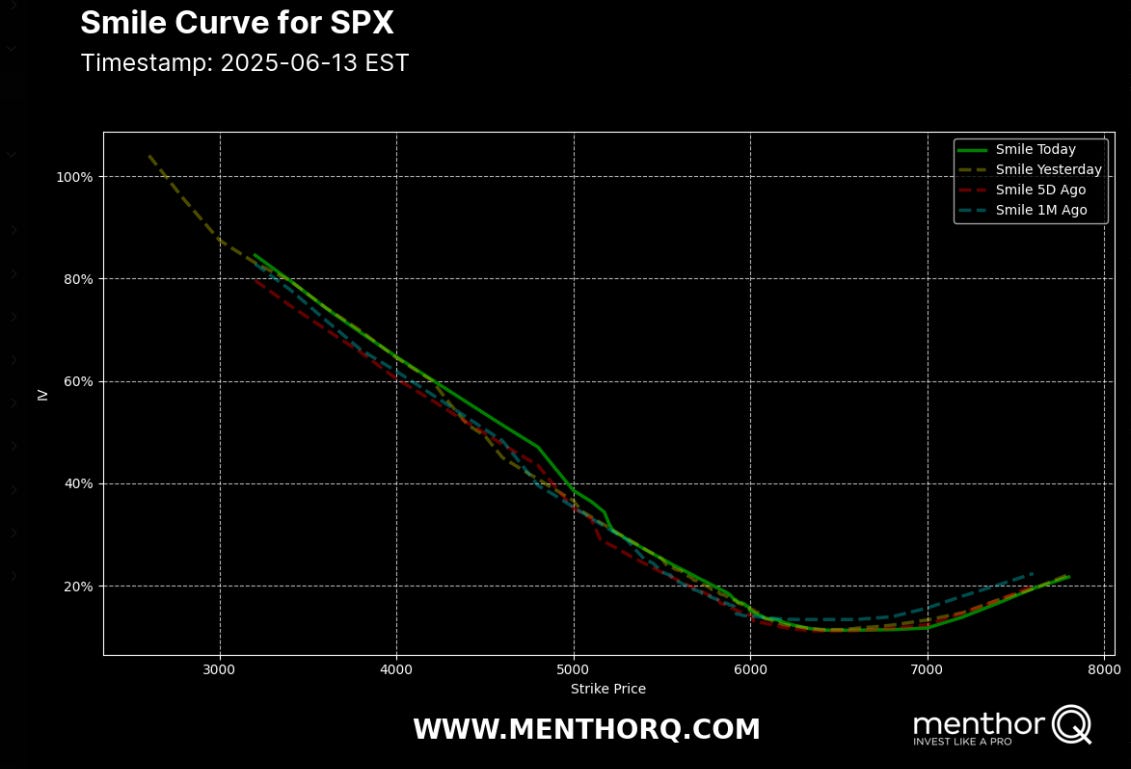
🧭 Key Observations
Overall shift higher:
The entire curve (green = today) sits above both yesterday’s (yellow dashes) and the 5-day line (red dashes), especially on the left-hand put wing. Implied vols have been repriced upward in step with the recent VIX bounce.Steeper downside skew:
Strikes ≤ 5 000 now carry 4–6 vol points more premium than they did a week ago and >8 vol points versus a month ago (blue dashes). Traders are paying up for crash protection.ATM firmness:
Around the 6 000 strike the smile trough is ~15–17 %, roughly 2 vol points higher than one month ago. The volatility “floor” is rising.Mild call-wing lift:
OTM calls ≥ 7 000 show a slight uptick compared with last week, but remain far below the put wing—upside speculation is present, yet priced modestly.
S&P 500 Term Structure
The chart below shows the $SPX term structure. The green line shows today’s term structure. It is higher compared to the last five days indicating price consolidation.
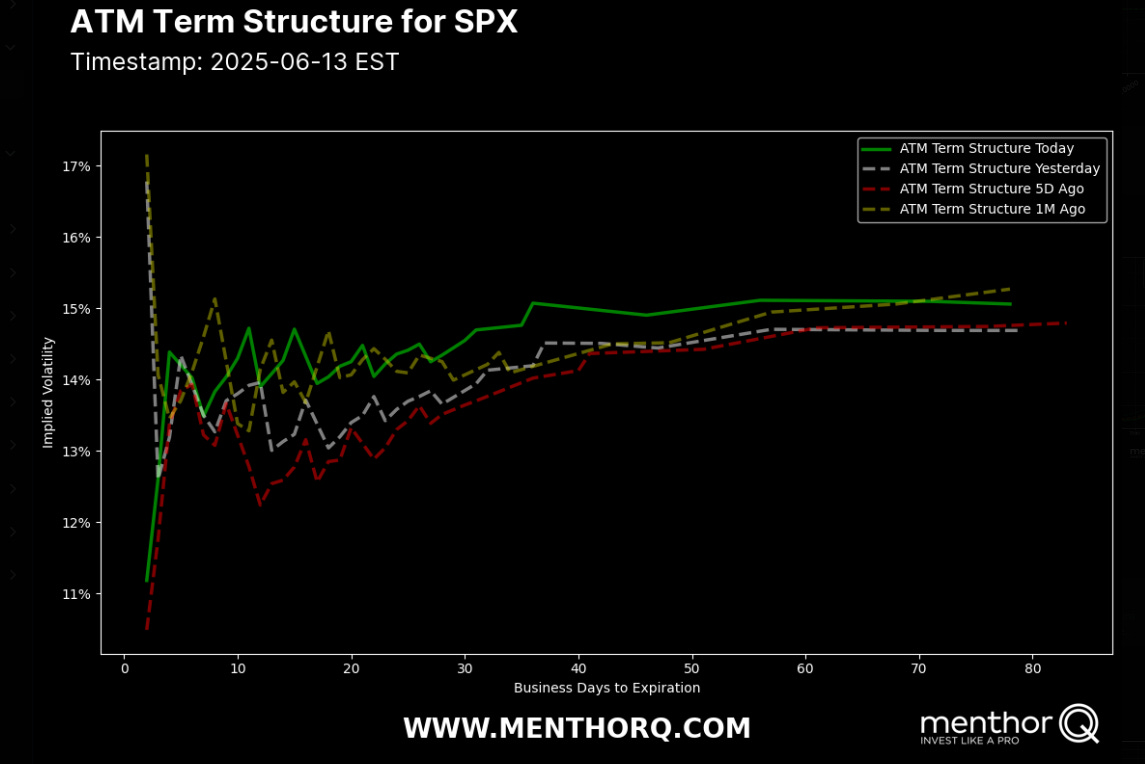
Noticeable front-end bump:
Options expiring in the next 5-10 business days price 14–15 % IV, roughly +1 vol-point vs. last week.
This jump is classic “event rent” for Tuesday/Wednesday’s FOMC statement, Powell press conference, and Friday’s monthly OPEX.
Trading implications into FOMC:
• Short-dated premium is expensive → good terrain for 0–1-week calendars, iron-flies, or tight credit spreads if you expect a mostly “hold & wait” Fed.
• Long-dated premium hasn’t budged → still attractive for diagonal call spreads or rolling downside hedges.
S&P 500 Cash Gamma levels
The chart shows the positioning information over the next couple of weeks. It is heavily skewed to the downside. Currently, the S&P 500 is a negative gamma situation therefore, market makers will trade in the direction of the market.
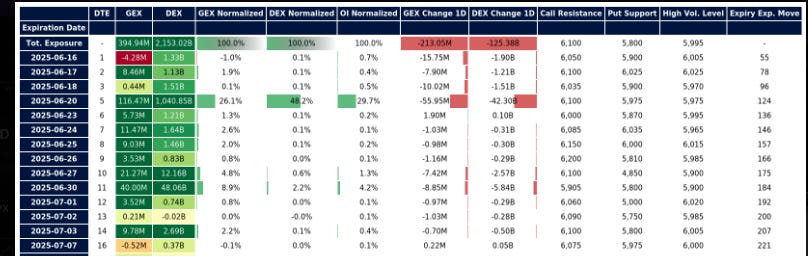
Gamma SPX Summary
Gamma profile: starts slightly negative Monday, fades to neutral into the FOMC meeting (June 18), then balloons positive for OPEX – implying most of the week’s real movement risk lies Tuesday PM → Thursday globex, before the Friday pin sets in.
Key strike to watch: 6 000–6 025 remains the dominant high-volume zone across all expiries; every excursion has pulled back toward it.
Upside trip-wire: a post-FOMC drive above 6,100 flips dealers from sellers to buyers and could unleash a squeeze toward 6,150.
Downside air-pocket: a break of 5900 (shared put floor for Mon/Wed) would find little gamma support until the 5 780–5 720 Wave-4 target band.
🔍 Technical Setup’
Base case (range) – FOMC in-line → front-month vol crush; expect chop between 5 930 & 6 045, pinning into OPEX. Fade extremes with intraday futures or 0-DTE iron-flies.
Bull surprise – dovish dots / lower inflation path: surge through 6 075 → vanna chase toward 6 150. Deploy call-diagonals or debit call-flies 6100 / 6150 / 6200.
Bear surprise – hawkish dots or geopolitical shock: VIX ≥ 22, break < 5900 → fast drop toward 5780–5720 wave-4 target. Hedge with July 5850-5750 put-fly or short MES.
The FOMC press conference is scheduled for this Wednesday. What are the implications?
Rate hold is priced in: Fed-funds futures give ~90 % odds of no change to the 4.25 – 4.50 % target range.
Market movers instead:
Dot-plot (number of 2025 cuts)
Powell’s press-conference tone
If dots shift hawkish: VIX > 22 likely; SPX downside to 5 930 → 5 780 opens.
If dots stay neutral/dovish: Event IV crush; SPX re-pins near 6 000–6 025 and can push toward 6 075+.
Economic Events for the Week
Here are the key economic events for the upcoming week, all times Eastern.
Mon 16 Jun
08:30 ET – NY Empire State Manufacturing Index (Jun) marketwatch.com
10:00 ET – NAHB Housing-Market Index (Jun) tradingeconomics.com
Tue 17 Jun
08:30 ET – May Retail-Sales & Control-Group + Import/Export prices tradingeconomics.com
09:15 ET – May Industrial Production & Capacity Util. tradingeconomics.com
10:00 ET – Business Inventories (Apr) tradingeconomics.com
All day – FOMC meeting (Day 1) federalreserve.govfederalreserve.gov
VIX futures/options final settlement (pulled forward because of the Thursday holiday)
Wed 18 Jun
08:30 ET – May Housing Starts & Building Permits + Weekly Jobless Claims (released a day early) tradingeconomics.com
10:30 ET – EIA Weekly Crude-Oil Report tradingeconomics.com
14:00 ET – FOMC rate decision & Summary of Economic Projections
14:30 ET – Chair Powell press conference federalreserve.gov
Thu 19 Jun – U.S. markets closed (Juneteenth) federalreserve.gov
Fri 20 Jun
08:30 ET – Philadelphia Fed Manufacturing Survey (Jun) tradingeconomics.com
09:45 ET – S&P Global Flash PMIs (Jun) tradingeconomics.com
10:00 ET – Conference Board Leading Index (May) tradingeconomics.com
June monthly options expiration (OPEX) – SPX/SPY/ETF & single-stock options roll off
The ESM25 futures contract will expire this week. Going forward I will be referring to the ESU25 contract which expires in September.
NQ Futures Daily Chart
Looking at the QQQs or the Nasdaq100 futures are an important part of my trading plan. The XLK (technology ETF) represents a 33% component of the S&P500. Therefore I use this as an indicator to trade the S&P 500.
When both futures (e.g., S&P 500 and Nasdaq) align in the same direction, the probability of the prevailing price trend continuing increases.
For example, during the rally in early May 2025, both ES (S&P futures) and NQ (Nasdaq futures) moved higher in tandem—confirming bullish momentum and leading to a sustained uptrend across major indices.

⚠️ Key Takeaways
Momentum marker: Parabolic-SAR dots flipped long on 22 April and trail price near 21 130—first trend-reversal trigger on a close below that level.
Immediate support ladder:
20405 – former “DT Resis” now first support.
18700 – 18900 (yellow horizontal band) – March congestion / value shelf.
17605 / 17583 – twin red “DT Support” lines and April base; loss of these would negate the rally.
Elliott count hint: Labels suggest price is in a minor wave (3) advance; a pause or shallow pullback could mark wave (4) before a final thrust toward 22 9xx.
NQ Gamma levels
The chart below shows the positioning information for QQQ. The QQQ is the ETF for nazdaq 100.
📌 Summary Outlook for QQQ
QQQ option‐positioning map for the FOMC / OPEX week (Mon 16 → Fri 20 Jun 2025)
Monday 16 Jun (0-DTE)
+ 68 M GEX → dealers long gamma – keeps moves contained.
Call wall 540, put floor 525; high-volume node 535.
Expect a tight, mean-reverting session before event risk builds.
Tuesday 17 Jun (VIX-settlement)
– 41 M GEX → dealers short gamma; delta still small.
Call wall 540, put floor 520; high-vol zone 529; expiry move ≈ 9 pts.
First real volatility window as hedges roll ahead of FOMC.
Wednesday 18 Jun (FOMC day)
– 9 M GEX (near-flat), DEX –0.33 B – tape highly sensitive to Powell / dot-plot.
Call resistance 534, put support 531, high-vol 532; expected move ≈ 11 pts.
With almost no positive gamma, any surprise can fuel a directional burst.
Friday 20 Jun (June monthly OPEX)
+ 165 M GEX (≈ 40 % of all positive gamma) – strong pinning force.
Call wall 540, put floor 510, high-volume node 524; expiry move ≈ 15 pts.
Unless FOMC shock sticks, price likely gravitates toward the 524–530 zone into the close.
🧠 Implications for SPX (Correlation View)
QQQ’s options natrux says tech will dictate the week’s velocity; SPX will largely mirror the move, then likely re-pin with QQQ into Friday’s OPEX—unless the Fed delivers a genuine surprise.
Management of last week’s plan
Last week I was short bull put spreads and they were closed profitably. Currently, I don’t have any weekly positions going into the week.
You can review all of my posts here.
The Weekly Plan and trading idea
My general strategy for the current market is limit the weekend exposure to the market. With that being said, I am generally more than 75 percent in cash on any given weekend.
Since the market has become bullish, i would look for only bullish strategies. I would wait for price to make a small pullback prior to entry.
Sample trade ideas:
SPX-focused trade ideas for the FOMC/OPEX week
Harvest rich short-dated IV (Mon–Wed)
Sell 0–1-week iron-flies or narrow strangles centered on 6000.
Run a 1-week calendar: short Wed (6/18) ATM, long next Fri (6/28).
Quick downside insurance
Hold a cheap Jul 5 850/5 750 put-fly to cover a hawkish-dot surprise/VIX > 22.
Upside participation if Fed stays dovish/neutral
Call diagonal: short 28 Jun 6050 / long 26 Jul 6150.
FOMC day “un-pin” play: 0-DTE call-fly 6025/6050/6100.
Acceleration hedge on bearish break
Jul 5900/5800 bear-put spread activates after a daily close below 5900.
Have a successful trading week.
Let your trade setups come to you—don’t chase. With volatility elevated, remember to size down your trades and always define your risk in advance. Patience and size discipline are edge amplifiers, especially in high-volatility environments.
Managing risk is what keeps you in the game; discipline is what makes you profitable.
Gamma Level data (netgex data) and skew data (market sentiment) was provided by menthorQ.com
Presentation on GOLD
This week I will be doing a presentation on trading gold.

You can watch it here:
How I trade
I did several presentations with menthorQ. You can find them here. This is under the highlights section of my “x” account found here.
Follow me on X formerly twitter . I post my market view during the week.
Disclaimer
The trade ideas provided are for educational purposes only. These ideas are based on the analysis I have performed. Make sure you do your due dilligence prior to taking on any risk! Always manage your risk.
Thank you for reading my weekly plan.
Joel