


Weekly Plan for June 1
The market rally has entered a consolidation phase and appears poised for a significant move, however the direction remains uncertain.

Summary
The 1,110-point rally from April 9 through May 14 has paused. Over the past two weeks, the S&P 500 has consolidated within a trading range between 5,800 and 6,000. This consolidation is constructive, as the market has corrected through time rather than price—a sign of healthy digestion following a strong move.
From the 4,836 low to the 6,162 high, the index has retraced more than 62% of the February through April decline, reclaiming the majority of lost ground. Given the strength and structure of the recovery, the likelihood favors an upside continuation—with a retest of the all-time high appearing more probable than a deeper retracement at this stage.
Last week, the S&P 500 closed higher on the week, marking a continuation of its broader uptrend.
In the sections below, I’ll walk through a range of data points that support both the bullish and bearish narratives heading into the upcoming week. With several key economic catalysts on deck, there is a strong likelihood of a volatility spike around these events.
I post weekly market updates, and you can find all of them here.
We begin with the S&P 500 futures chart, incorporating both price action and positioning data to outline a trading plan for the week ahead.
📊 S&P Daily futures & Fibonacci Retracements
The chart below displays the S&P 500 futures daily chart overlaid with the Commodity Channel Index (CCI) standard momentum indicator. Vertical lines highlight periods where the S&P 500 exhibited extended momentum conditions—both to the upside and downside.
The most recent overbought signal occurred on May 13, offering an early clue that upward momentum was poised to pause. The current consolidation zone is circled on the chart, indicating that much of the upside froth has been absorbed, helping reset short-term conditions.
The CCI (Commodity Channel Index) is a momentum oscillator that identifies overbought and oversold conditions relative to a statistical mean. Readings above +100 typically suggest overbought conditions and potential exhaustion, while readings below –100 point to oversold conditions. These threshold breaches often precede trend pauses or reversals, especially when paired with price structure and volume context.

Additionally, the 200-day simple moving average (SMA)—a key long-term trend indicator—has acted as a dynamic support zone, currently aligned near the 5,800 level. The 200 SMA has acted as a dynamic anchor of institutional support. Holding above this level suggests the broader uptrend remains intact.
Price has also oscillated around the 5,850 zone over the past two weeks, establishing it as a critical inflection point. This area has repeatedly served as support, resistance, and pivot, reinforcing its significance for short-term directional cues.

📍 Updated Parabolic SAR (PSAR) Analysis
The PSAR dots flipped below the candles on May 29, marking a renewed bullish signal after a brief period of sideways consolidation.
This flip is significant because it follows a multi-session pause and coincides with price reclaiming key short-term levels, including the 5,850–5,875 range.
The current PSAR dot is at 5,761.53, which now acts as active trend support. As long as price stays above this level, the short-term uptrend remains intact.
🌊 Elliott Wave Count (Tentative Interpretation)
The chart appears to show a completed 5-wave decline from the February high (~6,162) to the April low (~4,832), followed by a new impulsive structure upward.
🎯 Projected Upside Targets – Wave (3)
~6,045–6,060:
100% extension of Wave (1) — a conservative target for Wave (3)~6,130.50:
Structural resistance zone (DT Resis) — near-term resistance based on prior highs~6,220–6,240:
161.8% extension of Wave (1) — a typical full-strength Wave (3) target
🔺 If price breaks and holds above ~6,045, the odds increase for a test of 6,130 and possibly 6,200+.
🎯 Downside Risk Levels
~5,761.53:
Current Parabolic SAR level — loss of this level would signal weakening short-term momentum~5,771.88:
DT Support & Wave (2) low — break below invalidates current bullish impulse wave count~5,702–5,720:
Minor support zone — corresponds to the April 30 candle body and top of prior consolidation range
📊 The Volume Profile View
The chart below shows the S&P futures (contract ES) 10 day daily volume profile/market profile chart.
The data aggregation is done in 30 minute periods. The pink line to the left shows the volume POC while the green line to the right shows the POC of time. Volume and time do not always line up to the exact location.
🧭 Context Overview (as of 6/1/2025)

🔄 Context Summary
Price has returned to the composite POC (5,916.75) after bouncing off the 5,780 support area.
The market is balancing, but any breakout from here (above 5,930 or below 5,880) could lead to range expansion.
Above 5,930–5,940, price could revisit the 5,977–5,987 resistance zone.
A failure to hold above the POC may lead to a quick move through the low-volume pocket toward 5,820 or lower.
Read about market profile and auction market theory here.
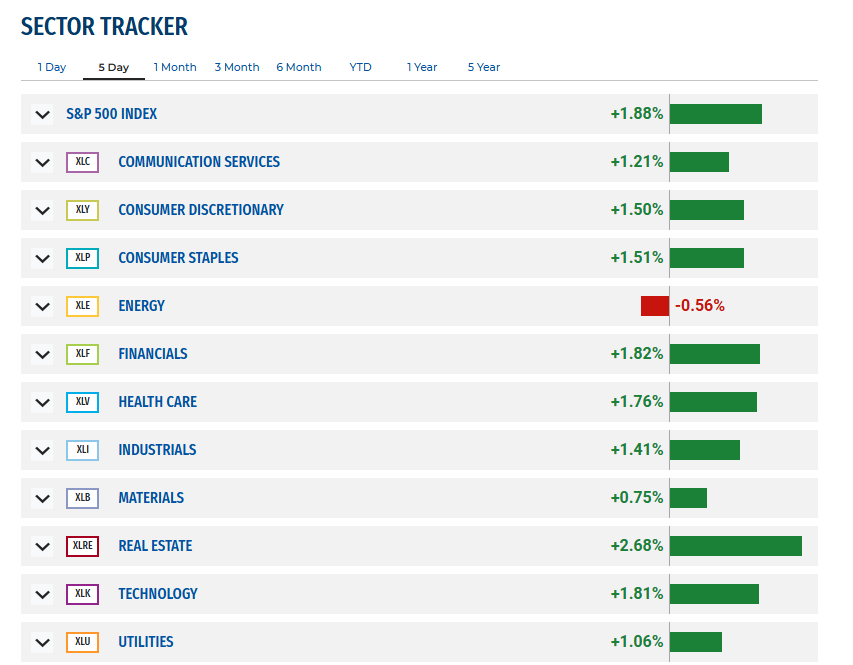
Current Market Outlook Using Sectors
🔺 Broad Market Strength
The S&P 500 Index gained +1.88%, reflecting a healthy rebound and risk-on tone across most sectors.
10 out of 11 sectors posted positive returns, signaling broad-based participation in the rally.
The market rally showed broad participation, led by real estate, financials, and technology, which are traditionally sensitive to macro drivers like interest rates and earnings expectations.
Defensive sectors like health care and staples also performed well, suggesting a balanced risk appetite.
Energy's underperformance stands out, possibly indicating macro uncertainty or sector-specific headwinds.
📝 Weekly Sector Summary – Implications for the Week
Broad sector strength (10 of 11 sectors green) supports continued bullish momentum.
Leadership in real estate, tech, and financials signals healthy breadth across growth and rate-sensitive areas.
Defensives (health care, staples) also participated, suggesting balanced positioning amid macro uncertainty.
Energy weakness may hint at global growth concerns; worth monitoring.
Upcoming macro events (ISM, ADP, NFP) could drive volatility and determine whether the market breaks higher or retraces.
Outlook: Constructive but data-dependent. Favor the upside above key support levels, with caution into macro catalysts.
VIX Chart
The VIX is a number that measures how much people think the S&P 500 will move (up or down) over the next 30 days.

📉 VIX Summary & Implications for SPX
🔹 Current VIX Reading: 18.57
VIX is off recent lows but still within a muted volatility regime, suggesting complacency or equilibrium in SPX.
VIX is in contango (+3.19%), which generally supports bullish or neutral equity conditions.
🔹 Bollinger Bands & SAR
VIX is sitting near the midline between its upper and lower Bollinger Bands.
Parabolic SAR dots are above current price, indicating downward momentum in volatility (bullish for SPX short term).
🔹 Skew & Risk Sentiment
SKEW: 138.25 → Elevated skew suggests heavy demand for downside SPX protection, even while VIX remains subdued.
This implies tail risk is being priced in, possibly due to upcoming macro catalysts (e.g., NFP, ISM).
🔹 Trend Context
VIX has been trending lower since peaking in mid-April (near 44).
Previous sharp VIX spikes coincided with sharp SPX drawdowns—these now appear to be digesting and stabilizing.
🧭 Implications for SPX
VIX contango + low spot VIX = supportive environment for equities.
Elevated skew + near-term event risk suggests complacency may be fragile.
Unless VIX reclaims 20–21, SPX is more likely to grind higher or consolidate than to break down sharply.
A sudden VIX reversal above 21–22 would warrant caution as it would likely trigger broad SPX volatility expansion.
The MenthorQ SMILE curve
The MenthorQ skew smile curve chart of the S&P 500 cash index.

🧭 Key Observations
Left tail (put skew) remains steep — the green line ("Smile Today") is elevated on the far left, indicating continued demand for downside protection.
The smile curve is fairly stable compared to yesterday (yellow) and 1 month ago (blue), showing little day-to-day volatility shift.
The curve is lower across most strikes than 5 days ago (red), reflecting a decrease in implied volatility since last week’s elevated levels.
Implied volatility is at its lowest around ATM (near 6000 strike) and gradually increases at both tails, consistent with a typical smile structure.
S&P 500 Term Structure
The chart below shows the $SPX term structure. The green line shows today’s term structure. It is lower compared to the last five days indicating price consolidation.
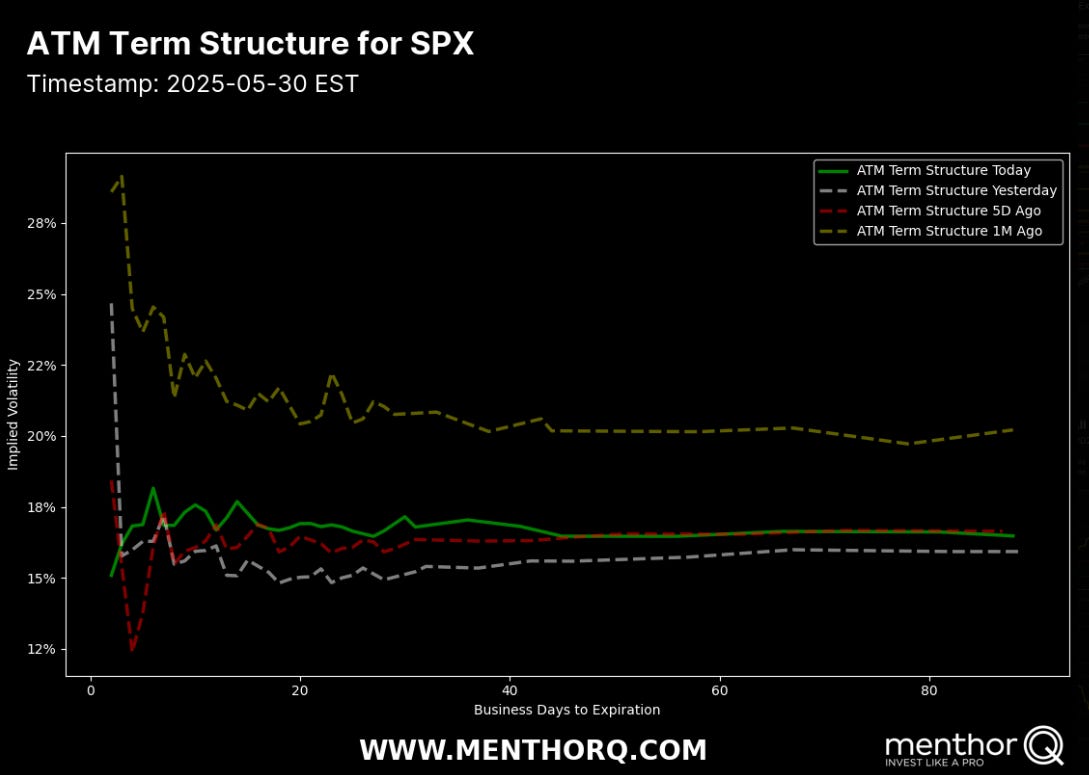
Traders expect short-term turbulence but remain confident in the medium-term outlook. Volatility spikes could be brief unless macro surprises shift sentiment sharply.
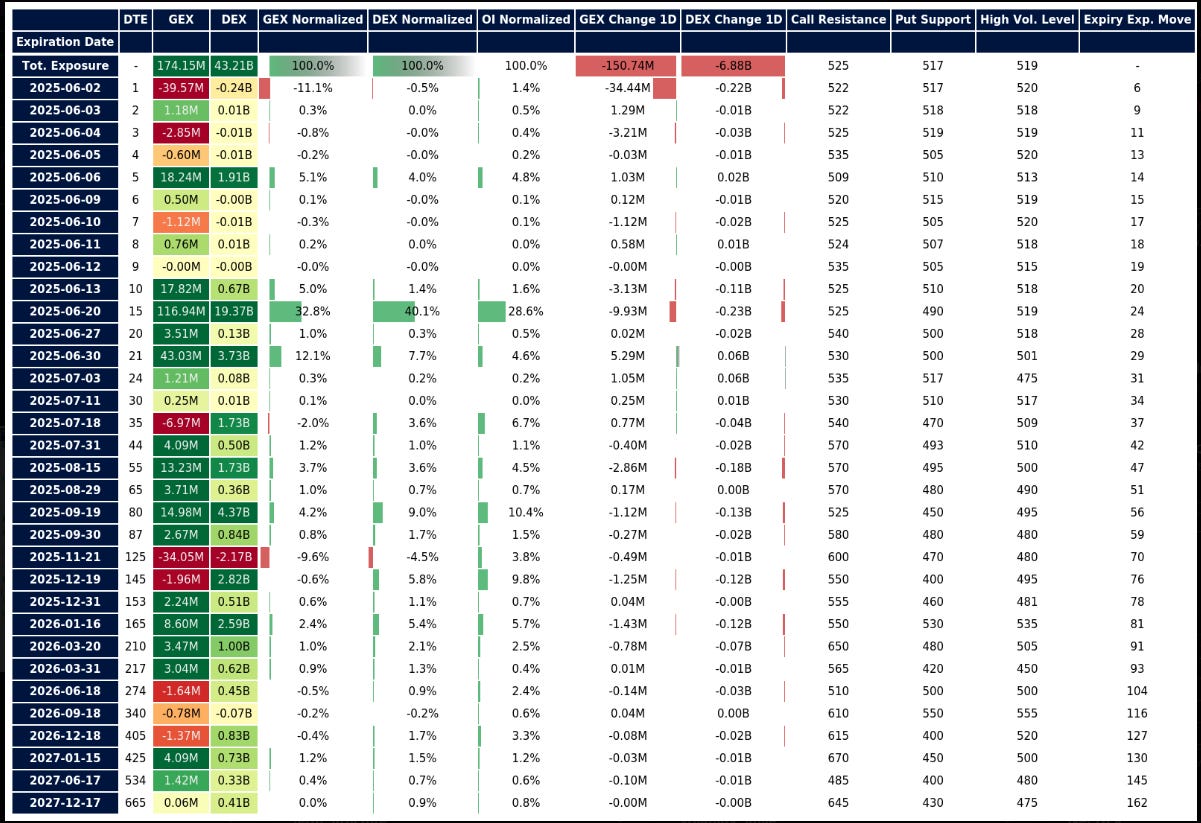
S&P 500 Cash Gamma levels
The chart shows the positioning information over the next couple of weeks. It is heavily skewed to the downside. Currently, the S&P 500 is a negative gamma situation therefore, market makers will trade in the direction of the market.

Gamma SPX Summary
🔻 June 3–6: Negative Gamma Window
GEX is sharply negative; dealers may hedge in ways that amplify moves.
Key support to watch: 5,880 (low-volume node) and 5,780 (200 SMA).
Break below 5,880 could trigger fast downside to 5,780.
Expect high volatility and intraday whipsaws.
🔄 June 10–13: Neutral-to-Mixed Gamma
GEX/DEX stabilizes; less directional pressure from hedging flows.
If price holds above 5,900, upside targets include 6,045–6,130.
Environment favors grind higher or mean-reversion setups.
🛑 June 20 & June 30: High Positive Gamma
Strong dealer long gamma reduces volatility.
Key technical zone: 5,900–6,130 (composite resistance).
Expect range-bound chop or pinning behavior near expiry.
Favor theta-positive strategies like calendars or condors.
🔍 Technical Setup
If SPX holds above 5,880–5,900, price may grind higher toward 6,000–6,045, aligning with:
100% extension of Wave (1)
Structural resistance at 6,045–6,130
Gamma flip zones often serve as pivot points in dealer positioning.
Long Term rates (10 year Treasury)
The FOMC cut rates (December 2024) a .25 basis point cut. Rates peaked in the first week of January 2025. The yield is currently at 4.45.
At the most recent meeting FOMC left rates unchanged. The fed-fund watch tool shows that there is a 5% probability that short term rates will get lowered by 25 basis points at the next meeting in June.
I have placed bollinger bands around the price action.

🧭 Risk Sentiment Matrix (Yields vs SPX)
10Y Yield Level SPX Signal Risk Mood
< 4.10% Bullish SPX Goldilocks, Fed in control
4.10–4.40% Neutral chop Confused regime, data-dependent
> 4.50% Bearish SPX Inflation concern, risk-off
Economic Events for the Week
Here are the key economic events for the upcoming week, all times Eastern.
Monday, June 3
No major releases (market digesting previous week’s data and positioning)
Tuesday, June 4
Factory Orders (10:00 AM) – Insight into business spending
Job Openings – JOLTS (10:00 AM) – Signals labor market tightness
Wednesday, June 5
ISM Services PMI (10:00 AM) – Key read on service-sector strength
Fed Beige Book (2:00 PM) – Regional economic conditions report
Thursday, June 6
Initial Jobless Claims (8:30 AM) – Weekly labor market momentum
Friday, June 7
Nonfarm Payrolls (8:30 AM) – Major event; market-moving jobs report
Unemployment Rate (8:30 AM)
Average Hourly Earnings (8:30 AM) – Inflation & wage pressure indicator
🔍 Implications:
Wednesday’s ISM Services and Friday’s NFP report are likely to drive volatility and directional bias, especially in a short gamma environment.
Markets will watch for signs of labor market softening or inflation pressure, both of which could shift rate cut expectations.
NQ Futures Daily Chart
Looking at the QQQs or the Nasdaq100 futures are an important part of my trading plan. The XLK (technology ETF) represents a 33% component of the S&P500. Therefore I use this as an indicator to trade the S&P 500.
When both futures (e.g., S&P 500 and Nasdaq) align in the same direction, the probability of the prevailing price trend continuing increases.
For example, during the rally in early May 2025, both ES (S&P futures) and NQ (Nasdaq futures) moved higher in tandem—confirming bullish momentum and leading to a sustained uptrend across major indices.

⚠️ Key Takeaways
🟢 Parabolic SAR:
SAR dots remain below the price, indicating bullish momentum is still active.
As of now, SAR sits near 20,788, which acts as short-term trailing support.
🔐 Key Support Levels:
21,000 – Psychological and structural support (former resistance-turned-support).
20,000–20,100 – April breakout zone and base of recent consolidation.
17,583–17,605 – Major swing low support and breakdown level from Q1.
🚧 Resistance Zones:
22,139.50 – Next overhead resistance (DT Resis).
A break above this could initiate a measured move toward 23,000+.
NQ Gamma levels
The chart below shows the positioning information for QQQ.
📌 Summary Outlook for QQQ
✅ Bullish Gamma Skew dominates starting June 6 through June 20 — favors range-bound to mildly bullish price action.
🔻 Below 510 = short gamma resumes and volatility may pick up.
🔺 Above 525 = dealer selling may cap rallies near resistance without a strong catalyst.
🧠 Implications for SPX (Correlation View)
Strong positive GEX in QQQ (June 6, June 13, June 20) reduces volatility and encourages mean-reverting behavior.
SPX may grind higher or consolidate, particularly if it remains above 5,880–5,900, its own gamma flip zone.
✅ Implication:
SPX is likely to experience tightening ranges, dips being bought, and lower realized volatility through mid-June.
Watch for dealer hedging pressure near SPX 6,050 and QQQ 525. Rallies could fade short term.
As long as QQQ remains in a supportive gamma regime, the SPX bias leans bullish with reduced downside tail risk in the near term.
Management of last week’s plan
Last week I was short bull put spreads and they were closed profitably. Currently I am short bull put spreads. I viewed the last week as a consolidation week.
You can review all of my posts here.
The Weekly Plan and trading idea
My general strategy for the current market is limit the weekend exposure to the market. With that being said, I am generally more than 75 percent in cash on any given weekend.
Since the market has become bullish, i would look for only bullish strategies. I would wait for price to make a small pullback prior to entry.
Suggested trade ideas:
bullish put spread capturing 30 percent upon entry. The trade is put on for between 21 - 45 DTE. This is the time where the fastest amount of time decay starts to occur.
bullish diagonal call spread where the longer leg is 60 days out and the shorter leg is 30 days out. The objective is for price to approach the shorter dated option which has a higher delta as compared to the longer dated option. This benefits from time decay in the short leg and delta expansion in the long leg.
My strategy also includes trading small as well as different dates of expiration, different strikes and ranges to mitigate risk.
In trading, it is fool hardy to believe that every trade will win. I am mindful of this fact and constantly monitor my risk. I am playing the long game and I understand that losses are part of the game!
Market momentum has cooled over the past couple of weeks, but QQQ positioning continues to support a bullish outlook. Given the constructive gamma profile in QQQ, I expect any SPX pullbacks to be shallow and met with buying interest. At worst, the index is likely to consolidate; at best, it resumes its upward trend.
Have a successful trading week.
Let your trade setups come to you—don’t chase. With volatility elevated, remember to size down your trades and always define your risk in advance. Patience and size discipline are edge amplifiers, especially in high-volatility environments.
Managing risk is what keeps you in the game; discipline is what makes you profitable.
Gamma Level data (netgex data) and skew data (market sentiment) was provided by menthorQ.com
Presentation on VIX
A few weeks ago I did a presentation on the VIX.

How I trade
I did a number of presentations of my trading process with menthorQ. You can find them here. This is under the highlights section of my “x” account found here.
Follow me on X formerly twitter . I post my market view during the week.
Disclaimer
Please don’t follow my idea(s) blindly. Do your own due dilligence before you attempt to trade. Always manage your risk.
Thank you for reading my weekly plan.
Joel
