Weekly Plan for June 22
After another quiet week for the S&P 500 and with geopolitical tensions rising.I expect the index to break out of its tight 100-point range.
Summary
After a 1,110-point rally from April 9 through May 14, the S&P 500 has entered a classic digestion phase. Futures have since traded sideways in a roughly 200-point range between 5,735 and 6,075.
Will increased volatility this week drive the S&P 500 to break down or break out?
Price continues to consolidate over time rather than through price movement; however, I see a few signals that could point to downside risk. In today’s note, I’ll outline both the bullish and bearish cases for the week, incorporating price charts and positioning data to support my view.
Price has continued to one time frame lower on the daily chart, however the weekly chart shows consolidation. Price did not make a weekly high last week.
Below is the daily chart of the S&P futures, showing price in a tight range. The white dots point to the PSAR indicator (trend indicator), showing the upward trend losing some steam.
Even with the geopolitical action, the S&P mostly ignored the noise this past week. Until a weekly bar finally breaks its predecessor’s low, the dominant bias stays up.
In the sections below, I’ll walk through a range of data points that support both the bullish and bearish narratives heading into the upcoming week. With several key economic catalysts on deck, there is a potential for a volatility spike around these events.
I post weekly market updates, and you can find all of them here.
We begin with the S&P 500 futures monkey bars chart, incorporating both price action and positioning data to outline a trading plan for the week ahead. The monkey bar chart incorporates volume profile which provides clues into the current auction process.
📊 S&P Daily Volume Profile chart
The image below shows a ThinkOrSwim Monkey Bars chart, which combines volume data with market-profile information. My analysis concentrates on the volume-profile section. The pink bars on the left mark the Point of Control (POC)—the price level that attracted the greatest trading volume during the selected period. You can get a definition of it here. There are plenty of sources on the internet and books which provide excellent insight into its value.
The chart contains a few subtle features that shed light on the current price action. I’ve highlighted two critical zones:
Thursday’s U.S. federal holiday session saw price break below the prior week’s balance area, dipping to a low around 5,970. This price bar is circled.
A pronounced selling tail emerged, and the POC settled at the lower end of Friday’s distribution—signaling potential further downside or, at minimum, extended consolidation.
Given these factors, I expect the S&P futures market to probe the 5950–5900 area again before any sustainable move higher develops.
Read about market profile and auction market theory here.
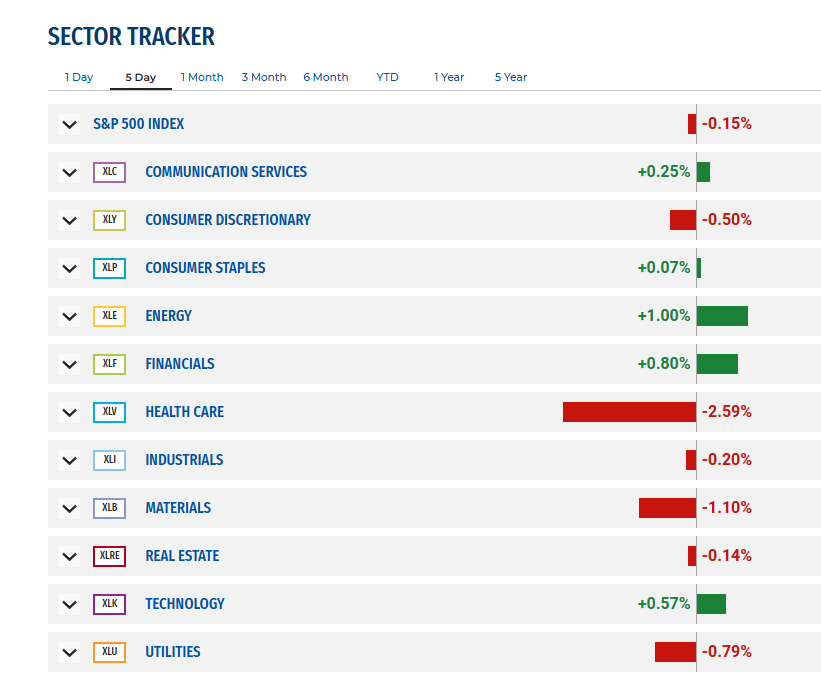
Current Market Outlook Using Sectors
🔺 Broad Market Sector Summary
Energy & Financials Lead
Rising oil prices and steeper Treasury yields have buoyed Energy (+1.0%) and Financials (+0.8%), as those sectors benefit from higher commodity prices and wider net‐interest‐margin prospects.Tech & Communications Modestly Positive
Growth names held in positive territory (Tech +0.57%; Comm Svcs +0.25%), suggesting investors aren’t rotating completely away from momentum, but are selective.Healthcare’s Pullback
Health Care’s 2.6% drop was the biggest drag—likely reflecting profit‐taking in biotech and pharmaceutical stocks amid mixed earnings and regulatory headlines.Defensive underperformance
Traditionally “safer” sectors (Utilities –0.8%, Consumer Staples +0.07%) didn’t rally, indicating risk appetite hasn’t swung fully toward defensives despite the small index decline.Overall Range-bound
With the index off only 0.15%, markets remain in a tight trading range—consistent with my broader view of consolidation into the week ahead.
Chart
The VIX is a number that measures how much people think the S&P 500 will move (up or down) over the next 30 days.
📉 VIX Summary & Implications for SPX
Spot VIX: 20.62
Bollinger Bands (20-day):
Lower: 20.24
Upper: 21.00
Parabolic SAR: Dots sitting just above the VIX candles → a mild downtrend signal in volatility
Front-Month vs. 1-Month VIX: 20.62 vs. 20.68 → nearly flat term structure (very mild contango)
Expected SPX Move (1-day): ±0.38%
What This Means for SPX
Range-Bound Volatility
VIX is squeezed within a very tight 20–21 band, signaling that market fear/uncertainty is subdued.
When VIX trades in a narrow Bollinger range, SPX tends to stay range-bound until a volatility breakout.
Low Volatility Tail Risk
Parabolic SAR’s slight downtrend suggests short-term vol could drift even lower—complacency is building.
Complacency often precedes a volatility spike, so watch for a VIX move below ~20.2 (for a rally signal) or above ~21.0 (for a sell-off warning).
Flat Term Structure
Near-flat front-month vs. one-month VIX means no big roll-down in vol costs—options traders aren’t paying up for extra near-term risk.
If one-month VIX begins to pull away from spot (steeper contango), it would signal rising demand for protection into the next expiration.
SPX Tactical Implications
Bullish Lean: A sustained drop back toward the lower band (~20.2) often coincides with short-covering and a modest SPX bounce.
Bearish Warning: A break above the upper band (~21.0) would mark a volatility breakout—watch for accelerated SPX selling.
Defined-Risk Trades: Consider selling tight short-dated straddles or weak-hand put spreads if VIX stays below ~21, but be ready to hedge if VIX punctures the upper band.
The MenthorQ SMILE curve
The MenthorQ skew smile curve chart of the S&P 500 cash index.
🧭 Key Observations
Stable ATM Vols: Spot-strikes near 6,000 continue to anchor around ~12%, in line with the broader calm in VIX.
Call‐side Interest: The right wing’s small lift suggests some traders are paying up for upside convexity, possibly positioning for a breakout.
Range‐bound Outlook: With both wings having eased and ATM vols near multi-week lows, look for SPX to remain range-bound unless a fresh volatility catalyst emerges.
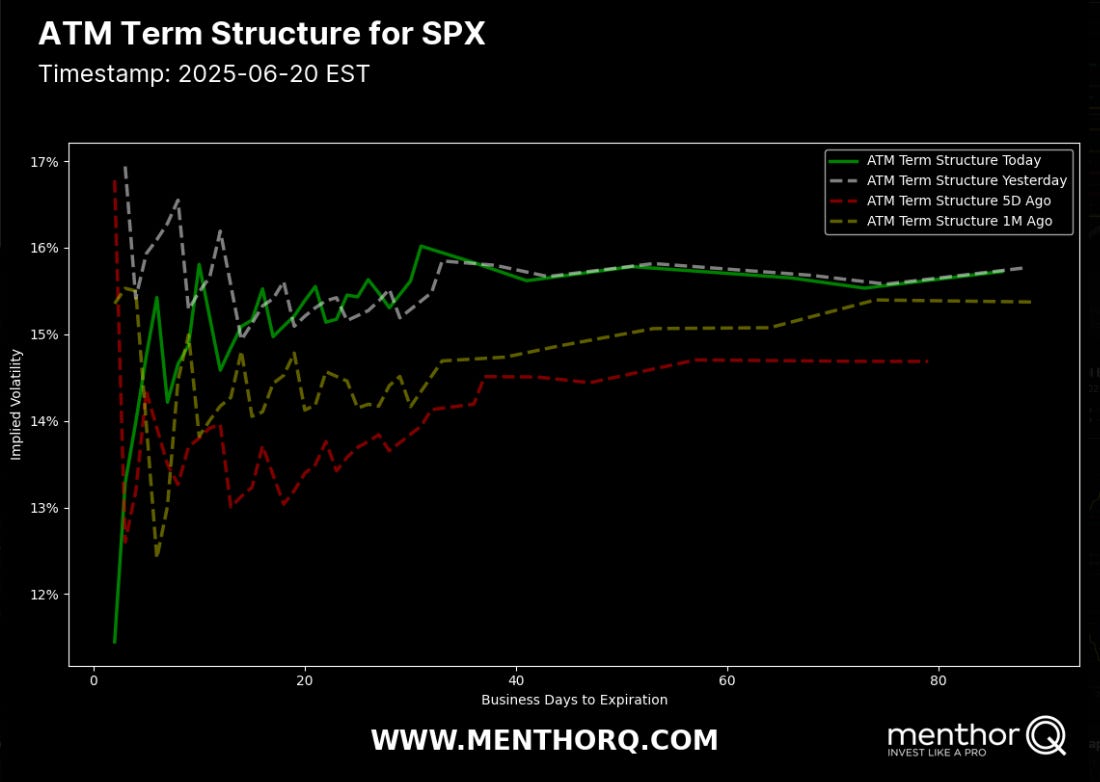
S&P 500 Term Structure
The chart below shows the $SPX term structure. The green line represents today’s curve, which is lower than it was over the past five days—signaling price consolidation. As the week progresses, the curve rises relative to last week, indicating an impending volatility shock.
Near-Term Spike & Normalization (1–5 DTE)
Today’s 1–2 business-day options sit unusually low (~11.5% IV), before jumping to ~15% by 5 DTE.
Yesterday’s curve (gray) was slightly firmer in the 1–5-day bucket, while one-month-ago (yellow) vols were even lower—showing that very short-dated IV has retraced downward over the past month.
Mid-Curve Elevation (5–30 DTE)
Between 5 and 30 business days, IV ranges ~15.2–15.8% today—up ~0.5 pts from five days ago (red).
Compared with one month ago, the entire mid-curve has lifted by ~0.3 pts, reflecting steady demand for one-to-month-out insurance.
Long-End Drift (30–90 DTE)
From 30 to 90 days, vols flatten around 15.5–15.8%—just below yesterday’s levels but ~0.2 pts above reads from five days ago.
Relative to one month ago, the long end has edged up ~0.2 pts, suggesting modest hedging interest across multi-month expiries.
Overall Shape & Implications
The curve remains in mild contango, with front-dated vols below mid- and long-dated vols—typical in stable markets.
The week’s small upward shift in the mid- and long-term suggests traders are modestly re-insuring against swings beyond the very near term.
The split between cheap 1–2 day vols and richer 5–90 day vols hints at a market that’s calm today but wary of a move over the next month
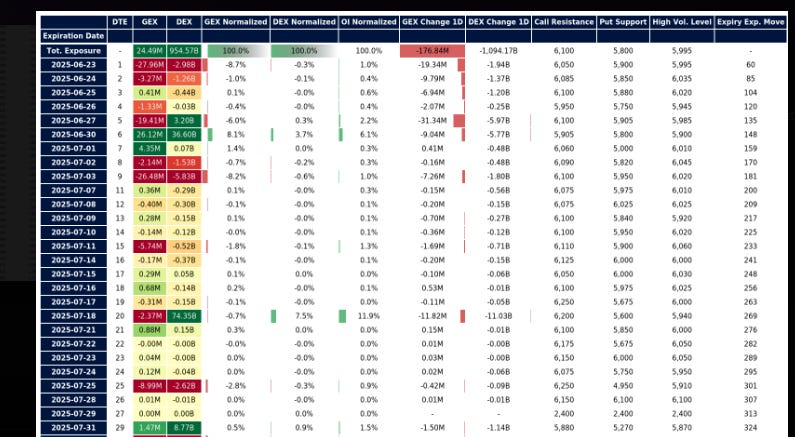
S&P 500 Cash Gamma levels
The chart shows the positioning information over the next couple of weeks. It is heavily skewed to the downside. Currently, the S&P 500 is a negative gamma situation therefore, market makers will trade in the direction of the market.
Gamma SPX Summary
This Week (June 23–27) vs. Next Week (June 30–July 3)
Gamma Roll-Off (Fri 6/20):
–15% of total GEX expired as the large 6,000 call wall rolled off, removing a key source of dealer convexity.
Immediate Effect: Further reduced hedging flows, accentuating this week’s negative net gamma.
This Week (Jun 23–27)
Net Gamma: Heavily negative → dealers short convexity
Pin Risk: Price likely to gravitate toward 5,800–6,100
Expected Move: Rises from ±60 pts (6/23) to ±135 pts (6/27)
Call Walls: 6,050–6,100
Put Floors: 5,800–5,900
Tactical Edge: Favor defined-risk short-premium trades (iron condors, call spreads)
Next Week (Jun 30–Jul 3)
Net Gamma: Turns positive → dealers long convexity
Volatility Kick: Potential for larger directional moves post-roll
Expected Move: ~±148 pts (6/30) and ±159 pts (7/1)
Key Strikes: Resistance 5,900–6,050; Support 5,800–5,805
Tactical Edge: Consider small directional call spreads or put spreads sized to ~±150 pt moves after rollover
Economic Events for the Week
Here are the key economic events for the upcoming week, all times Eastern.
Here are the highest‐impact economic releases and speeches likely to drive volatility in U.S. markets this week (Jun 23–27):
Mon, Jun 23
S&P Global Flash PMIs (Manufacturing, Services, Composite – Jun) at 9:45 am ET
Existing Home Sales (May) at 10:00 am ET
Fed Governor Waller speaks (timing TBA) riotimesonline.com
Tue, Jun 24
Conference Board Consumer Confidence (Jun) at 10:00 am ET
Fed Chair Powell testimony (before Congress; exact slot TBD) riotimesonline.com
Wed, Jun 25
New Home Sales (May) at 10:00 am ET
Fed Chair Powell speaks (post–house testimony; timing TBA) riotimesonline.com
Thu, Jun 26
Durable Goods Orders (May) at 8:30 am ET
Advance Q1 GDP (QoQ) at 8:30 am ET riotimesonline.com
Fri, Jun 27
Core PCE Price Index (YoY) (May) at 8:30 am ET
Personal Income & Spending (May) at 8:30 am ET riotimesonline.com
Every Day
Geopolitical risk
Why it matters:
PMIs set the tone for near-term growth/fed-funds expectations.
Home‐sales data often spark quick stock/fixed‐income moves.
Fed speakers (Powell/Waller) can shift rate‐cut/tightening bets.
Durable goods & GDP reveal the health of manufacturing and overall growth.
PCE & income/spending are Fed’s policy yardstick—big swings here tend to reprice both equities and bonds.
NQ Futures Daily Chart
Looking at the QQQs or the Nasdaq100 futures are an important part of my trading plan. The XLK (technology ETF) represents a 33% component of the S&P500. Therefore I use this as an indicator to trade the S&P 500.
When both futures (e.g., S&P 500 and Nasdaq) align in the same direction, the probability of the prevailing price trend continuing increases.
For example, during the rally in early May 2025, both ES (S&P futures) and NQ (Nasdaq futures) moved higher in tandem—confirming bullish momentum and leading to a sustained uptrend across major indices.
⚠️ Key Takeaways
PSAR Flip to Bearish: The Parabolic SAR dots have just switched from below price to above price (≈22,092), signaling a shift from the recent uptrend into a short-term downtrend.
Resistance at PSAR Dot & DT Resistance:
Today’s SAR dot (~22,092) and the diagonal “DT Resis” line at ~22,140 together form a stiff ceiling.
Any rally back toward those levels is likely to stall.
Immediate Support Levels:
21,600–21,700 zone: Marked by the low of today’s candle (≈21,567) and the recent cluster of minor swing lows.
Major Trend Support: The longer-term trend support line sits down near 19,600.
Elliott-Wave Context:
The chart labels a five-wave advance from early April into mid-June. With the SAR reversal, we may be entering the corrective “wave 2/4” phase off that high.
Candlestick & Volume Profile:
Today’s candle left a modest upper wick, showing rejection back toward the SAR level.
Narrow range on decent volume suggests indecision—watch for confirmation of a lower low to validate the reversal.
QQQ Gamma levels
The chart below shows the positioning information for QQQ. The QQQ is the ETF for nazdaq 100.
📌 Summary Outlook for QQQ
QQQ Option Matrix: Key Takeaways (Jun 23–27)
Heavy Negative Gamma:
Total GEX this week is ~–75 M—dealers are net short convexity, especially into the 6/23 (–36 M), 6/25 (–23 M) and 6/27 (–18 M) expiries.
Expect pinning pressure around the primary strikes as hedging flows absorb large moves.
Delta Skew:
Net DEX is slightly short to flat for 23–27 (ranging from –0.54 B to –0.29 B), so directional bias is muted; flows are more about managing gamma than taking a big bullish or bearish stance.
Volume/Vol Levels:
High‐volatility strikes sit near 529–532, confirming that 520–533 is the active band.
The very small net gamma on 6/26 (–0.3 M) may allow a brief stretch beyond that range mid‐week, but 6/23 & 6/27 should re-pin if broken.
🧠 Implications for SPX (Correlation View)
Scalp & Confirmation: Use QQQ to confirm strong SPX momentum—if QQQ isn’t keeping pace on a breakout, breadth is weak.
Confirm Broad Market Moves: Look for SPX–QQQ divergence as an early signal of sector leadership shifts.
Management of last week’s plan
Last week I was short bear call spreads and they were closed profitably. Currently, I am positioned bearish into this week. This week is a seasonally weak, and therefore have a long dated SPX puts. Additionally, i have sold SPX bear call spreads as well.
You can review all of my posts here.
The Weekly Plan and trading idea
My general strategy for the current market is limit the weekend exposure to the market. With that being said, I am generally more than 75 percent in cash on any given weekend.
Since the market has become bullish, i would look for only bullish strategies. I would wait for price to make a small pullback prior to entry. For this week, I have a slightly bearish lean with a potentially small expected pullback into a support region.
For S&P 500 futures analysis, I used the ESU25 contract (expires in September). I treat NQ and QQQ interchangeably in my analysis, and all trades are executed in SPX.
Sample trade ideas:
SPX-focused trade ideas for the week.
Long Call Diagonal
Structure: Buy SPX Jul 1 6,000 calls, sell SPX Jun 30 6,000 calls
Rationale: Positive gamma on Jun 30 expiry; long dated calls gain from post‐roll vol pickup while short leg hedges cost.
Long Put Calendar
Structure: Sell SPX Jun 30 5,800 puts, buy SPX Jul 3 5,800 puts
Rationale: Protect against a downside thrust once positive gamma takes over; benefit from term‐structure steepening.
Here are a few longer-dated hedge ideas to protect your SPX exposure through July/August:
Put Calendar Spread (Front-Month vs. Next-Month)
Structure: Sell Jul 17 5,800 puts, buy Aug 21 5,800 puts
Rationale: Collect premium decay in the front month while retaining longer-dated downside protection; benefits if vol term structure steepens.
Bear Put Spread into August
Structure: Buy Aug 21 5,900 puts, sell Aug 21 5,800 puts
Rationale: Caps cost of puts while providing a defined-risk bearish hedge if SPX breaks below 5,900 over the summer.
Have a successful trading week.
Let your trade setups come to you—don’t chase. With volatility elevated, remember to size down your trades and always define your risk in advance. Patience and size discipline are edge amplifiers, especially in high-volatility environments.
Managing risk is what keeps you in the game; discipline is what makes you profitable.
Gamma Level data (netgex data) and skew data (market sentiment) was provided by menthorQ.com
Presentation on GOLD
I did a presentation on trading gold June 17.
You can watch it here:
How I trade
I did several presentations with menthorQ. You can find them here. This is under the highlights section of my “x” account found here.
Follow me on X formerly twitter . I post my market view during the week.
Disclaimer
The trade ideas provided are for educational purposes only. These ideas are based on the analysis I have performed. Make sure you do your own due dilligence prior to taking on any risk! Always manage your risk.
Thank you for reading my weekly plan.
Joel


