Weekly Plan for June 9
The market moved higher out of a small balance last week. Will it continue its upward trajectory this week or reverse lower?
Summary
The market has continued to consolidate the large move from mid April. Last week, the S&P 500 broke out of a small balance; however, momentum has since slowed.
In the sections below, I’ll walk through a range of data points that support both the bullish and bearish narratives heading into the upcoming week. With several key economic catalysts on deck, there is a strong likelihood of a volatility spike around these events.
I post weekly market updates, and you can find all of them here.
We begin with the S&P 500 futures chart, incorporating both price action and positioning data to outline a trading plan for the week ahead.
📊 Market Structure
Last week’s breakout above 5970–6000 was from a tight multi-week balance zone, indicating strong initiative buying.
This type of "time-based correction" is typically bullish unless the move immediately fails (i.e., traps breakout buyers).
✅ What favors continuation:
Breakouts from compression often lead to multi-leg expansions.
Structure remains above gamma flip zone (~5970) = dealer support
SPX made higher highs and higher lows on declining realized vol
🧠 Strategic Summary by Day
Monday Bullish bias Selling into long or neutral strategies; sell premium above 6000
Tuesday Bullish/Neutral Selling theta positive if SPX is pinned at a key level; ie 6000
Wednesday Binary Event CPI event. Long gamma trades. For example straddles.
Thursday Breakout Risk, If Wednesday’s CPI report was hot, sell into rallies.
Friday Wide range risk Look for breakouts above 6100 or below 5850. Not a good day to trade iron condors.
🎯 Scenarios to Watch
✅ Bullish Continuation
CPI cool + SPX stays above 5970
Dealer chase hedging drives price toward 6100–6125
❌ Bearish Reversal
CPI hot + break below 5950
Delta-heavy short gamma triggers fast drop to 5900 → 5850
🎯 Option Matrix
🔍 Dealer Positioning Breakdown (June 9–13)
🔍 Dealer Behavior and Volatility Outlook
✅ June 9–11 (Mon–Wed): Stability & Reversion
GEX stays highly positive, especially Monday (+42M) — dealers suppress vol
SPX expected to pin or drift higher toward gamma magnet zones (5975–6025)
Macro catalysts (WWDC, CPI, PPI) may not break structure until Wednesday
Ideal for:
Iron condors / butterflies
Short vega, long theta
⚠️ June 12–13 (Thu–Fri): Volatility Expansion
GEX flips negative, delta very long
CPI/PPI will drive direction:
📈 Soft CPI → chase higher → squeeze to 6100+
📉 Hot CPI → breach below 5950 → dealers sell → cascade to 5850
Market may become one-directional
Ideal for:
Long gamma setups (straddle/strangle/calendar)
Directional debit spreads (calls or puts)
📊 Gamma Flip + Key Zones
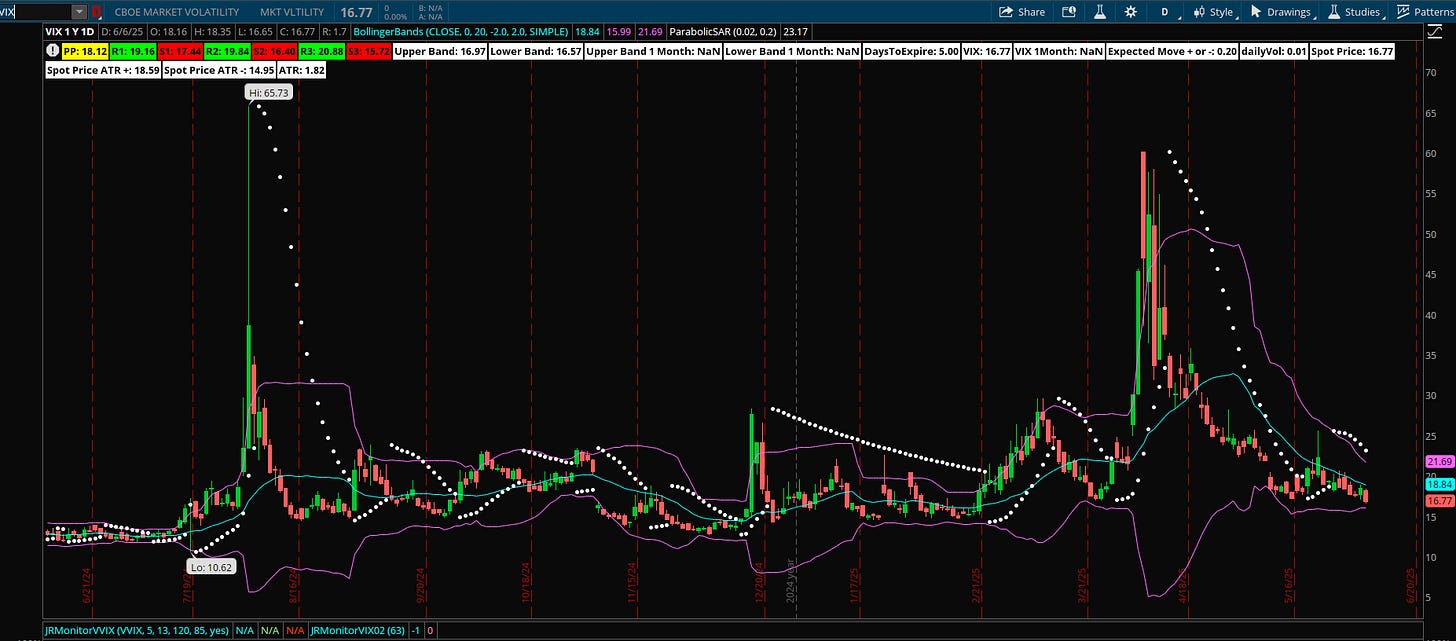
VIX Chart
The VIX measures the market's expectation of S&P 500 volatility over the next 30 days, based on options pricing.
VIX is currently compressed and vulnerable to upside reversion.
Volatility buyers should wait for confirmation (close above 18.5–19).
Until then, SPX is supported by low IV + dealer positioning → favor neutral-to-bullish, theta-positive setups.
The MenthorQ SMILE curve
The MenthorQ skew smile curve chart of the S&P 500 cash index.
✅ 1. Left Tail (Puts < ATM): Steeper Today
Traders are now bidding up downside protection.
This may reflect:
Hedging into this week's CPI/PPI
Concerns about short gamma regime (6/12–6/13)
Recognition that SPX is extended and vulnerable
✅ 2. Right Tail (Calls > ATM): Flatter Today
OTM call IV is lower today (green below red/blue) for strikes > 7000.
No major upside chase showing up — less appetite for far OTM calls.
In general risk is skewed to the downside.
S&P 500 Term Structure
The chart below shows the $SPX term structure. The green line shows today’s term structure. It is lower compared to the last five days indicating price consolidation.
✅ 1. Today’s Curve (Green) Is the Lowest Across All Timeframes
Current IV is lower than 1-day, 5-day, and 1-month ago across the curve.
Especially notable on the front end (1–15 DTE), where IV is in the 12–14% range.
Reflects compression of short-term implied volatility — dealers are in control (long gamma), and market is calm.
Traders expect short-term turbulence but remain confident in the medium-term outlook. Volatility spikes could be brief unless macro surprises shift sentiment sharply.
Management of last week’s plan
Last week I was short bull put spreads and they were closed profitably. Currently I am short bull put spreads. I viewed the last week as a consolidation week.
You can review all of my posts here.
🧠 This Week’s Trading Playbook
Phase 1: June 10–11 (Rangebound)
Strategy: Sell credit spreads or theta-positive structures
Expect drift or pinning around gamma magnets
Phase 2: June 12–14 (Event-Driven Breakout)
Strategy: Long gamma (straddle/strangle/calendar)
Directional debit spreads (calls or puts) depending on CPI outcomescalping
⚠️ Final Thoughts
Let your setups come to you — don’t chase.
With elevated vol risk, size down, define risk, and stay patient.
✍️ "Managing risk keeps you in the game. Discipline makes you profitable."
Gamma Level data (netgex data) and skew data (market sentiment) was provided by menthorQ.com
📢 Stay Connected
🧵 Follow my market insights and trade setups on X (formerly Twitter) https://x.com/stockpickkid
📽️ Presentations on the VIX and my trading process are available in the Highlights section
📬 Subscribe to this free newsletter and feel free to share it!
How I trade
I did a number of presentations of my trading process with menthorQ. You can find them here. This is under the highlights section of my “x” account found here.
Follow me on X formerly twitter . I post my market view during the week.
Disclaimer
Please don’t follow my idea(s) blindly. Do your own due diligence before you attempt to trade. Always manage your risk.
Thank you for reading my weekly plan.
Joel


