Weekly Plan for March 30
After another down week for the S&P 500, I see the the S&P moving higher this week. I discuss my weekly plan below.

Summary
Another down week, however I see the S&P 500 moving higher this coming week and potentially the weeks ahead. On Friday the S&P 500 made a nearly three standard deviation move lower. That is lower by 137 points.
1σ move: 50 points up or down
2σ move: 100 points up or down
3σ move: 150 points up or down
I discuss various data points that suggest the S&P will move higher this week.
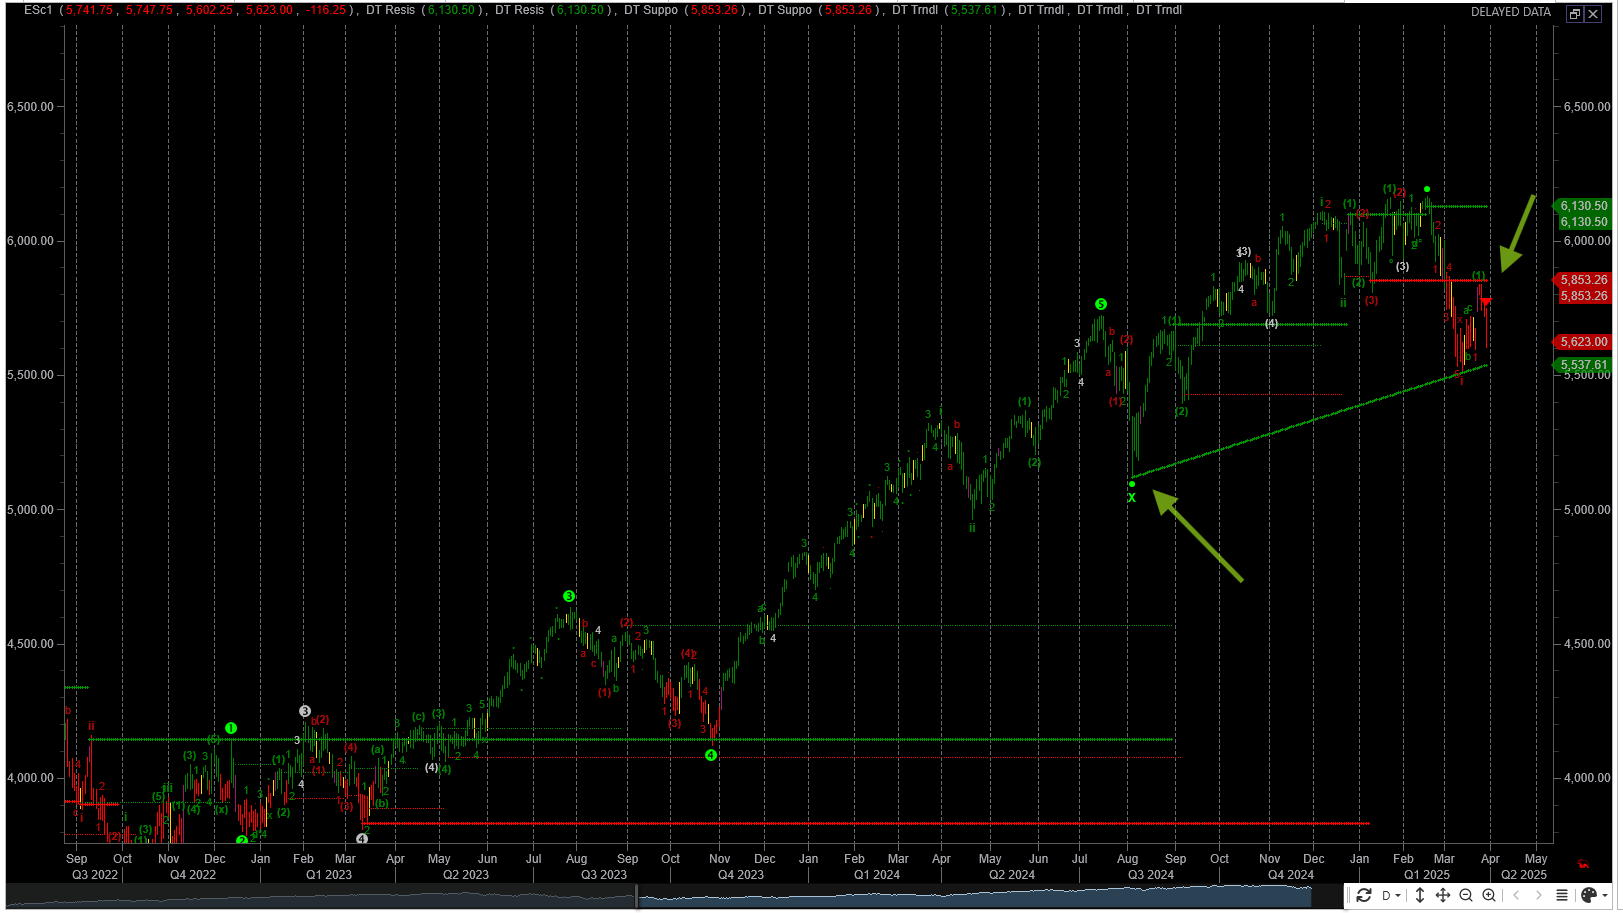
In past weeks, I have noted areas of demand which turned into supply. The S&P is in a distribution phase after many years of rising. In the past I have pointed to the 5850 price zone which was an area of support. There were multiple touches where it bounced higher. In February this area broke lower. This is a significant sign-post of market distribution (SELLING).
The trendline is drawn from the August 2024 low (highlighted by the arrow). There have been multiples touches to this area of support recently. That is the 5550 - 5500 area. The most recent touches have occured in March 2025.
Markets do not move in a straight line up or down, therefore the higher probability move is higher. I do expect this lower zone to touch once again, however short termI see a move higher.
See the chart.
Note, the analysis completed here is using the ESM2025 contract and or the SPX cash index. The future’s contract expires the 3rd Friday of June 2025.
When converting equivalent pricing between ESM2025 and SPX (S&P 500 cash index) that difference is approximately 40 points. This price spread declines as it gets closer to ES contract expiration.
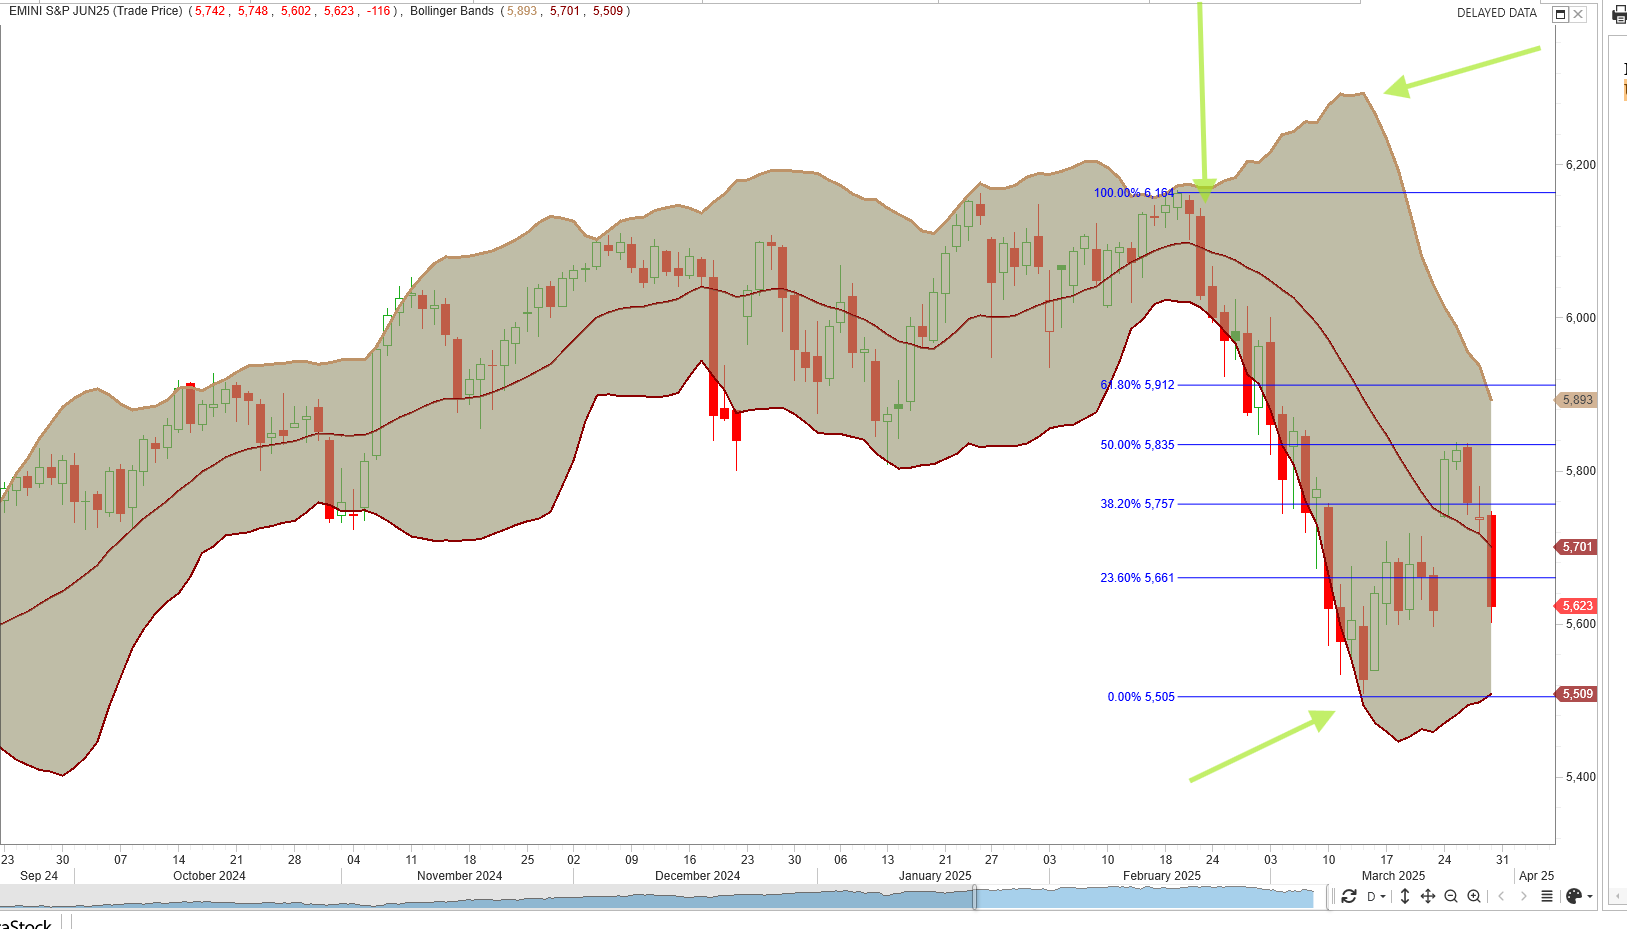
S&P futures with Fibonacci Retracements
This chart shows S&P futures with both fibonocci levels from the most recent high/low and bollinger bands.
Bollinger Bands are a popular technical analysis tool that helps traders assess price volatility and identify potential overbought or oversold conditions. For greater insight look here.
I have placed Fibonacci retracements from the high 6165 to the 5505 low.
I have marked a few key areas on the chart and describe the significance with arrows. From left to right note the following:
The 1st arrow points to a bollinger band squeeze. This where the volatility has been compressed and there is an expectation of volatility to increase. At this time direction is not known, just a near term expectation of increased volatilty.
The 2nd arrow points to peak expansion of the bands. Notice that price was riding the lower band. Volatility peaked near March 10.
The 3rd arrow points to where price moved inside the lower band. It implies that price decline is slowing down. This is an area to start thinking about mean reversion, ie higher prices.
When looking at the fibonocci levels a key observation is that price stopped at the 50 percent level. This is 5835.
Since the bands are compressing, volatilty is getting sold. If price can get above the 5835 level, then 5912 is the next upward target.
VIX chart
The VIX is a measure of volatilty in S&P 500. For an in depth view you can read about it here. The VIX tells a similar story as S&P futures chart above. The VIX peaked mid March 2025. Again, note price made a 3 std deviation move lower on Friday, however volatilty as compared to mid March is significantly lower.

In my analysis below, I will review other factors which can provide additional clues as to whether this is a near term bottom and price will move higher.
The Volume Profile View
The chart below shows the S&P futures (contract ES) 10 day daily volume profile/market profile chart. The data aggregation is done in 30 minute periods.
The market was in balance for approximately 10 days. This is highlighted with the left most rectangle.
On Monday March 24 broke out of balance to the upside with large gap up. I have highlighted the action from Monday - Wednesday. Wednesday’s price action moved the price back into the 10 day balance area. This movement of price is construed as a “look above and fail”. This means price failed to move out of the balance area. A short term rule of thumb is price to move to lower end of the balance area.
The balance area low is approximately 5550 in the ES futures. On Friday, price hit 5600.
Friday’s price action was highly emotional as observed by the number of areas of single prints. Single prints are areas of low volume, where price moves in one direction without back-filling in the opposite direction. Much like movement to the downside is swift, action to the upside will be just as swift and violent.
Look for potential targets zones of:
5635 - 5644
5672 - 5704
5714 - 5732
During this coming week, I will observe how price interacts in each of these single print price zones.
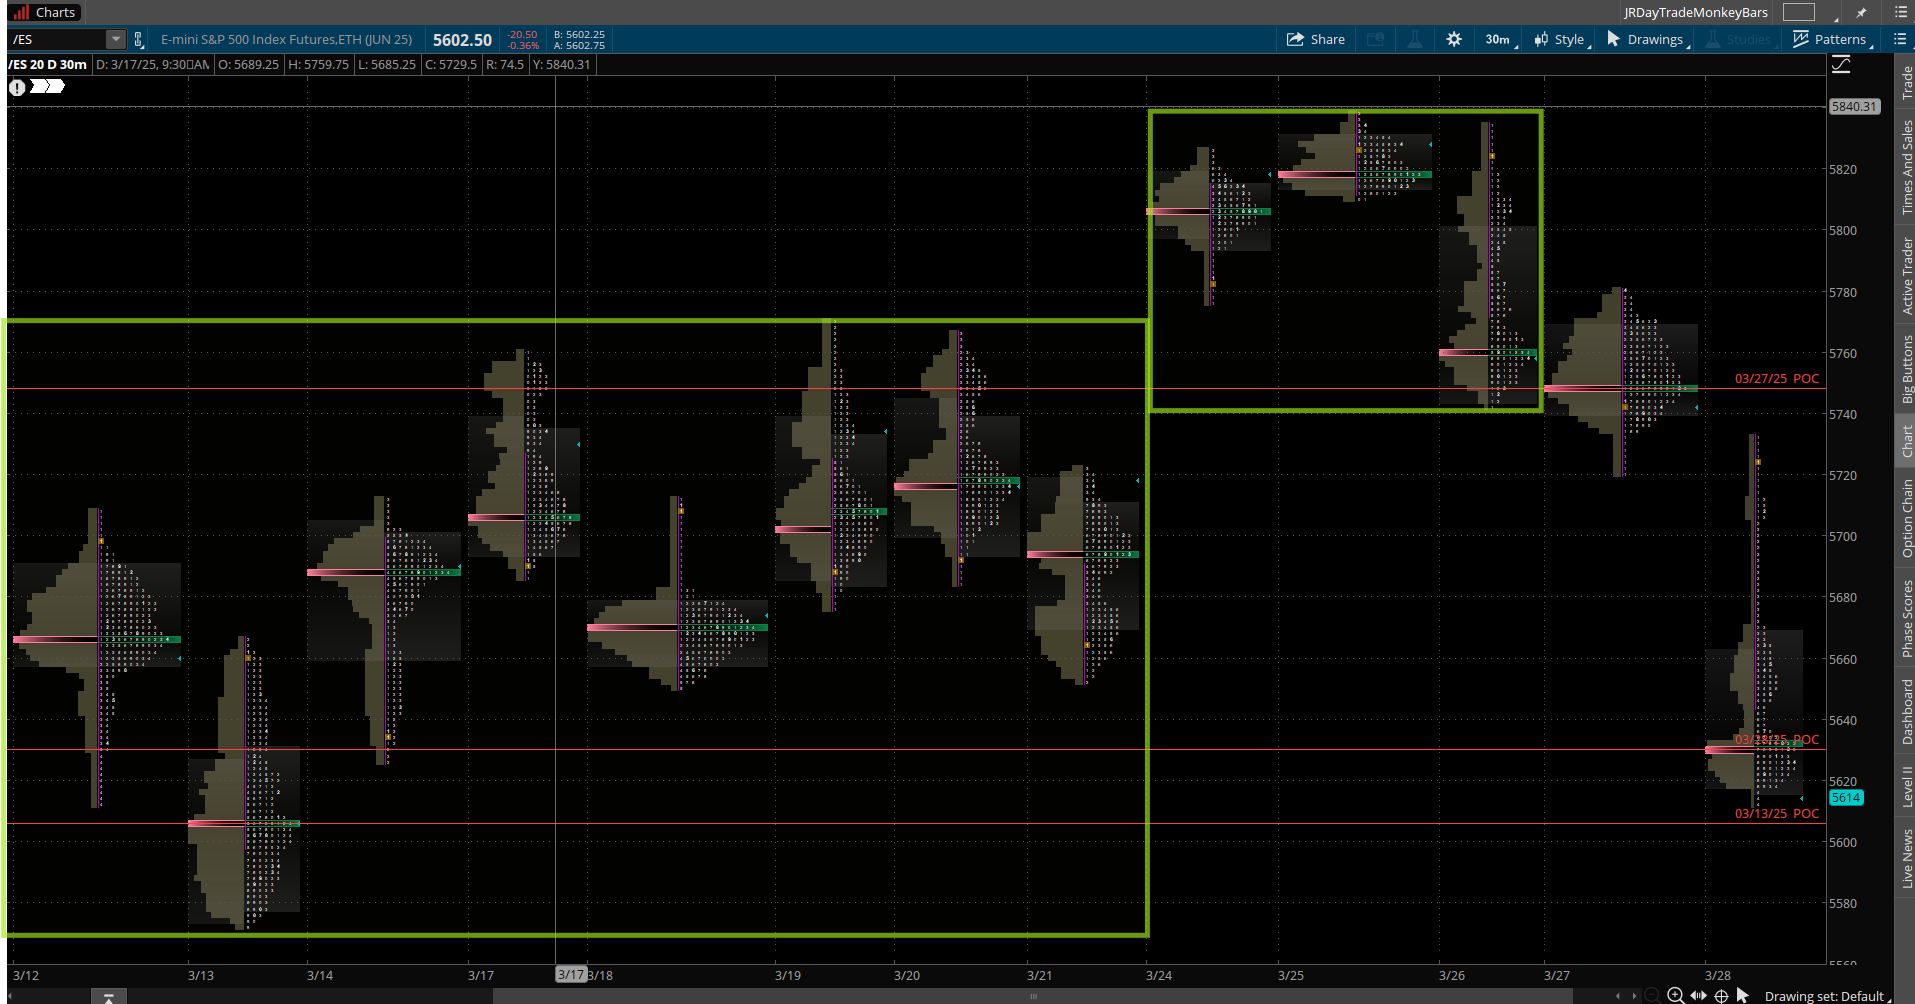
The five day balance area is defined by the range 5735 - 5837. That is where 70 percent of the price action was.
Value Area High: 5837
Point of Control: 5811
Value Area Low: 5735
On March 27 I posted that the S &P 500 futures made a look above and fail. The ES was trading at 5740. I suggested via auction market theory that price would move to the other side of balance.
Here is my post on “X”.
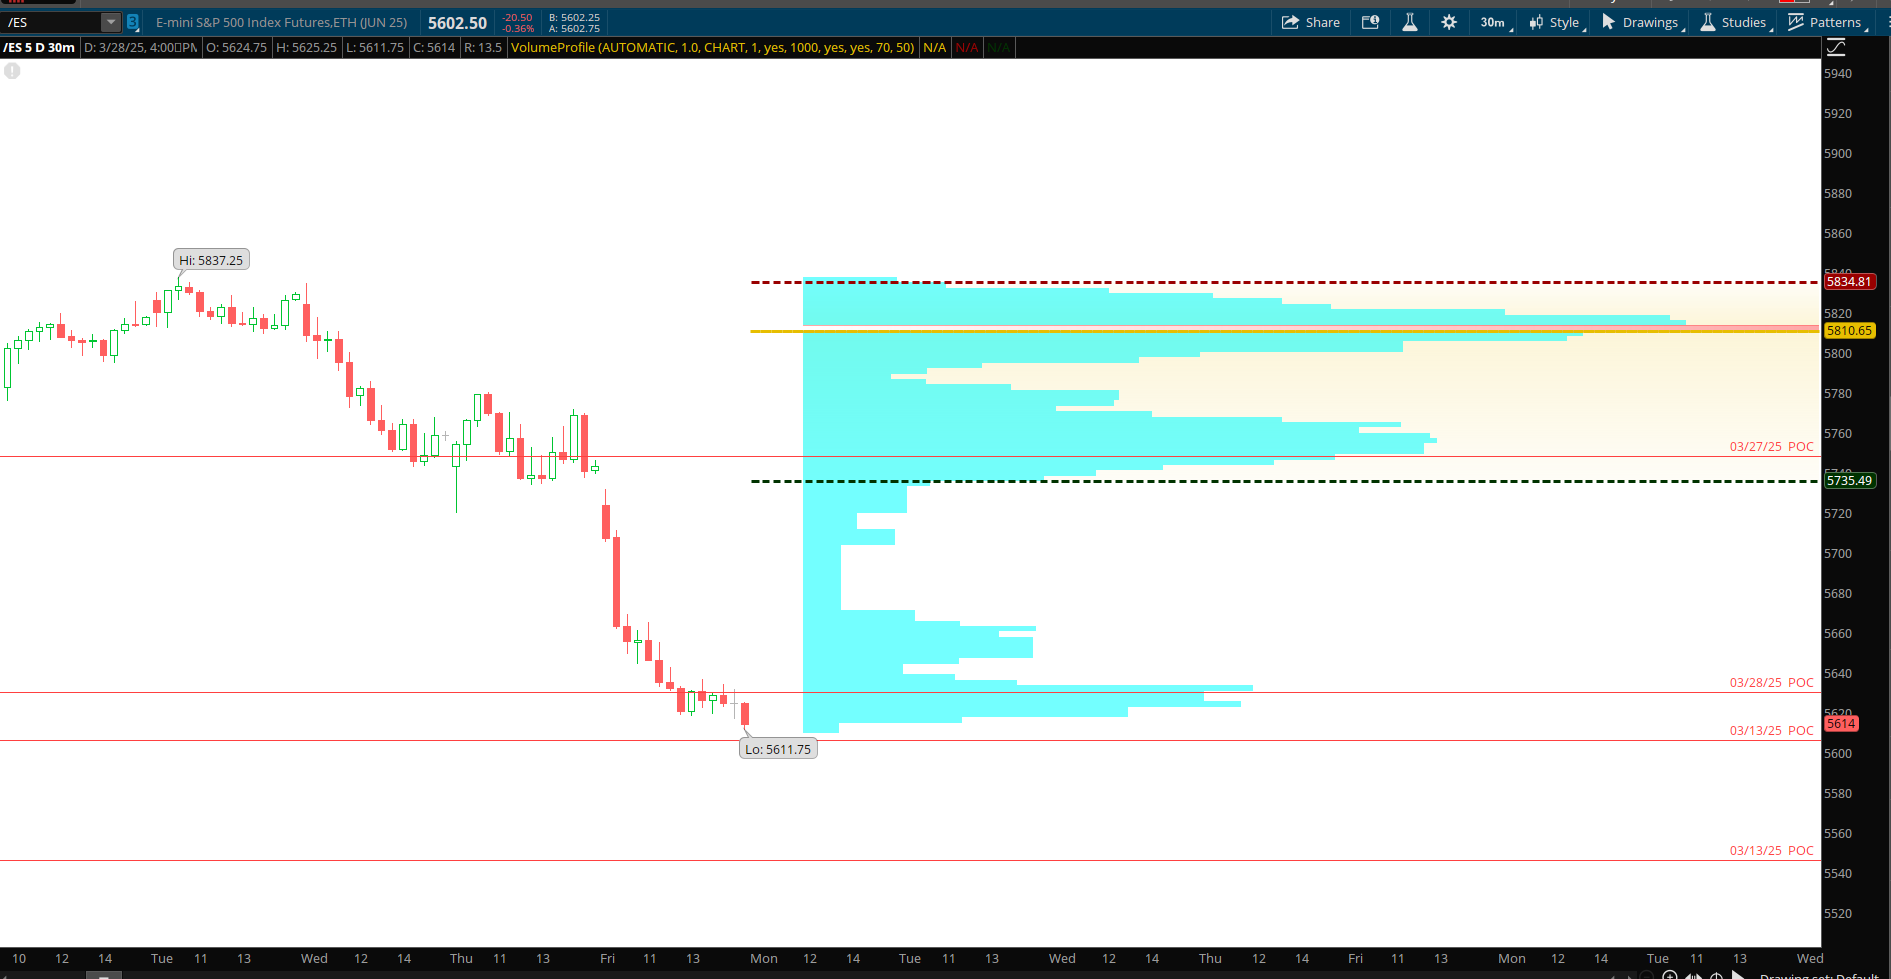
The Volume Profile View ( 20 days )
The chart below shows the S&P 500 futures volume profile for the last 20 days aggregated by 30 minute periods. I am showing the candlesticks on the left with the profile histogram on the right. The area boxed in on the right is the value area for the last 20 days. As you may recall the value area contains 70 percent of the trading volume for the period with the point of control indicating the highest area of volume.
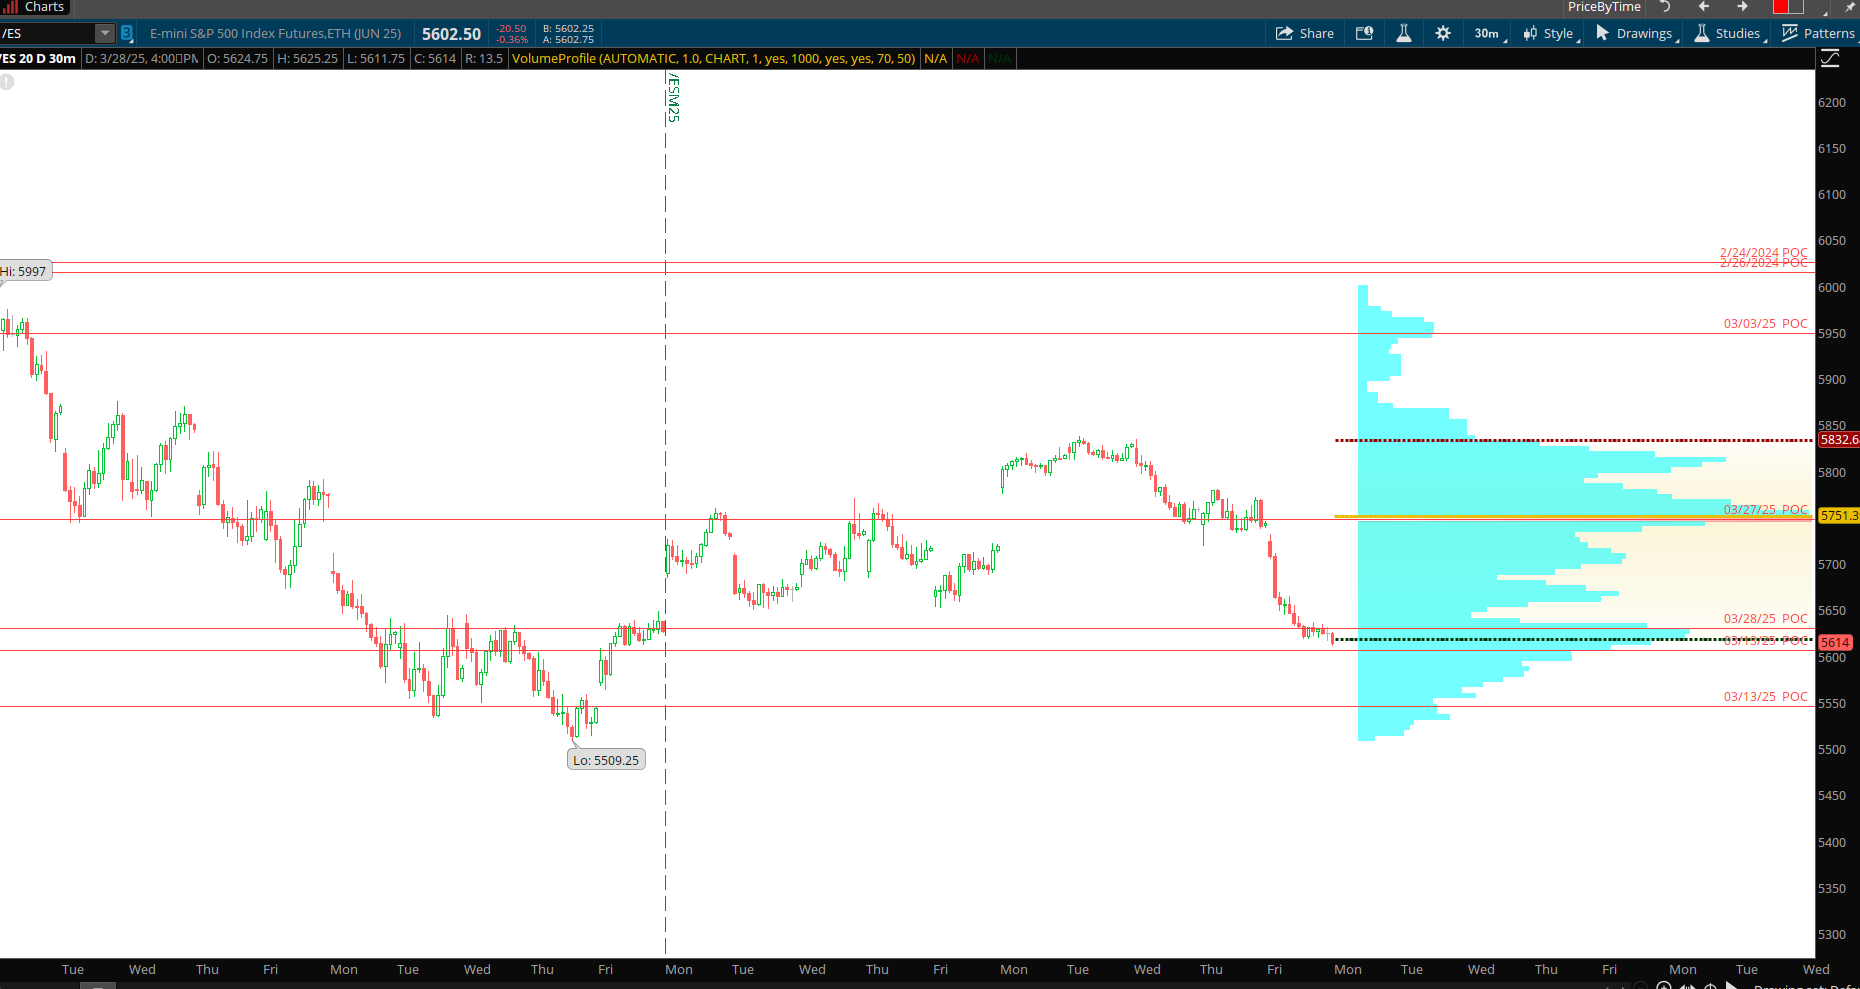
Note that the 20 day value area low is near the current price. Potentially, an oversold market ready to move higher.
The key levels are:
Value Area High: 5833
Point of Control: 5751
Value Area Low: 5614
Bullish Support Zone:
• 5650 – 5700
This lower range has seen solid volume accumulation, suggesting buyers have stepped in here. A bounce from this area would support a bullish, mean‑reversion setup.Consolidation / Fair Value Zone (POC):
• 5700 – 5740
This is the primary volume cluster where most trading occurred. It’s the “fair value” area and a logical target for a reversion trade.Bearish Resistance Zone:
• 5740 – 5780
The upper range has acted as a cap where sellers have stepped in, making it a likely area of resistance if price rallies.
Read about market profile and auction market theory here.
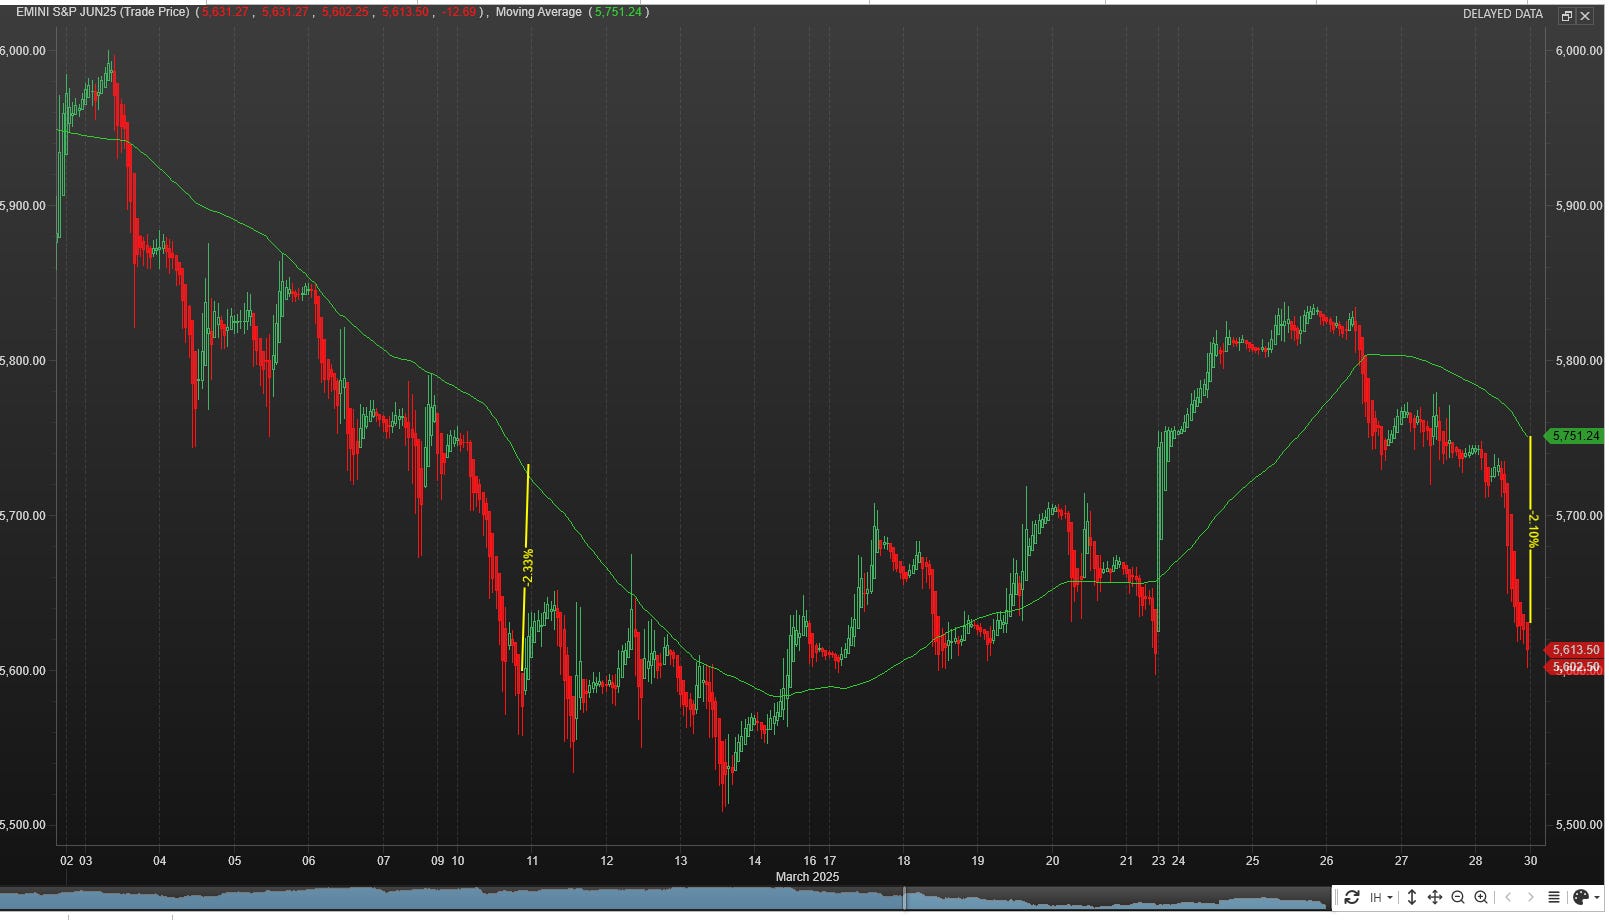
S&P 500 futures hourly chart
This chart shows the last 60 days of trading price action. The chart shows heikin candles using a 65 period simple moving average. In the middle of March (3/10), price fell approximately 2 percent below this moving average before reversion to the mean. I make a similar observation today. Price is forming a bottom and should revert higher.
5750 is a potential target.
CTA Positioning
The chart shows the CTA positioning (Commodity Trading Advisor). CTA positioning shows a short term bottom in the S&P 500. This adds to the bullish case, if the market begins to move higher.

Management of last week’s plan
Last week, I did not have any open trades over the weekend. After the gap-up on Monday I did place a broken-wing call butterfly for a credit above the most recent resistance area ( 5830 ).
I closed out for a win.
You can review all of my posts here.
The MenthorQ SMILE curve
The MenthorQ skew smile curve chart of the S&P 500 cash index.
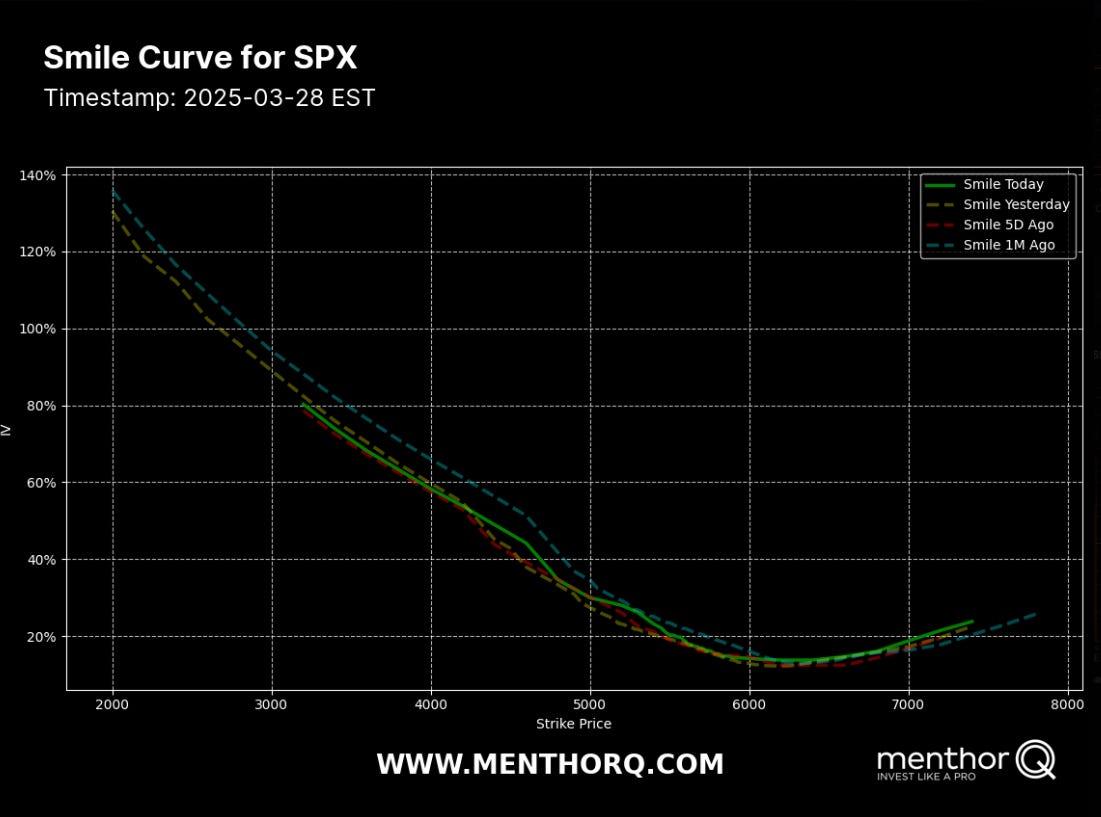
The chart suggests a clear divergence between the tails:
Left Tail (Downside):
• Implied volatility is significantly higher on the left side, which indicates that market participants are demanding more premium for downside protection.
• This steep left tail suggests an expectation (or fear) of larger or more rapid downward moves, as traders are willing to pay more to hedge against such risks.Right Tail (Upside):
• The right tail is noticeably flatter and exhibits lower implied volatility.
• This implies that there’s less concern for extreme upward moves—call options are cheaper relative to puts, reflecting a lower probability or impact expectation of a sharp upward move.
The Nation's Index
From 3/30/2025
Another way of observing the current S&P 500 positioning:
Observations
Call Side: The far out of the money CALLS are getting sold. The extreme upside move in the SPX is not viewed as a likely scenario.
Put Side Spike: The far out of the money PUTS are getting bought. It implies that market participants are paying a premium for left tail risk.

Long Term rates (10 year Treasury)
After the FOMC cut rates (December 2024 .25 basis point cut) there has been a steady increase in long term rates. Rates peaked in the first week of January 2025. Since this time they have declined. The yield is currently at 4.257.
At the most recent meeting FOMC left rates unchanged. The fed-fund watch tool shows that there is a 85% probability that short term rates will get lowered by 25 basis points at the next meeting in May.
Current Yield Context
Trending vs. Range-Bound:
From the chart, it appears the 10-year yield has been oscillating within a range. The Bollinger Bands suggest recent contraction in volatility.Recent Positioning:
The yield is near its middle band, the midpoint of its short-term volatility range. A move toward the upper band (~1–2 standard deviations above the mean) might indicate overbought conditions for yields (and vice versa for the lower band).
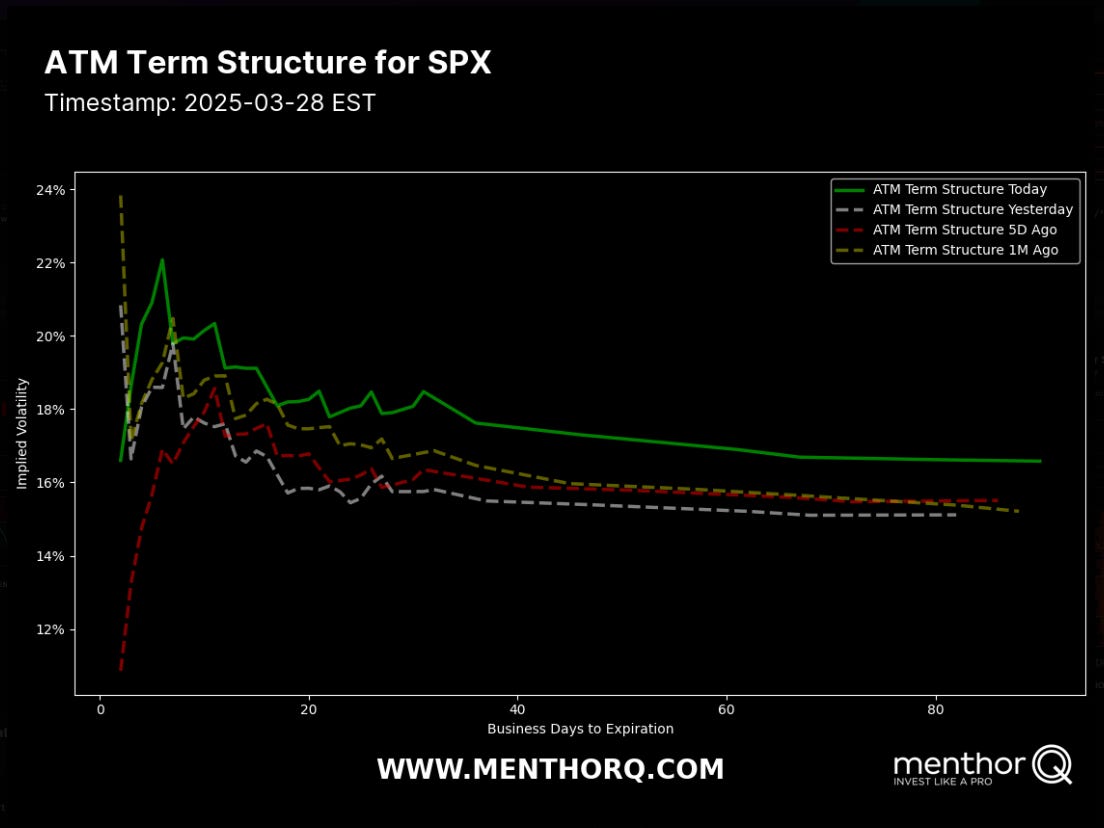
S&P 500 Term Structure
The chart below shows the S&P 500 term structure. The green line shows today’s term structure. The term structure is higher compared to the previous day however lower compared to a month (yellow dashed line) ago.
The short-term IV spike over the next few days suggests upcoming risk this week. Over the next few weeks the term structure suggests that volatility will get sold.
I list the major events below.
S&P 500 Cash Gamma levels
The chart shows four different GEX chart with the highest level of GEX. Market participants are mostly positioned bearish. Price is still well below the high volume level (5700) for this week.
The most significant point found in the chart is that 24 percent of the GEX will expire tomorrow March 31. My assumption is that most of the GEX is associated customer long PUTS. These PUTS will get monetized (sold). Since the market is in a negative gamma environment, market makers will trade in the direction of the market.
This could potentially provide a short cover rally in the SPX. Expect large price swings this week.
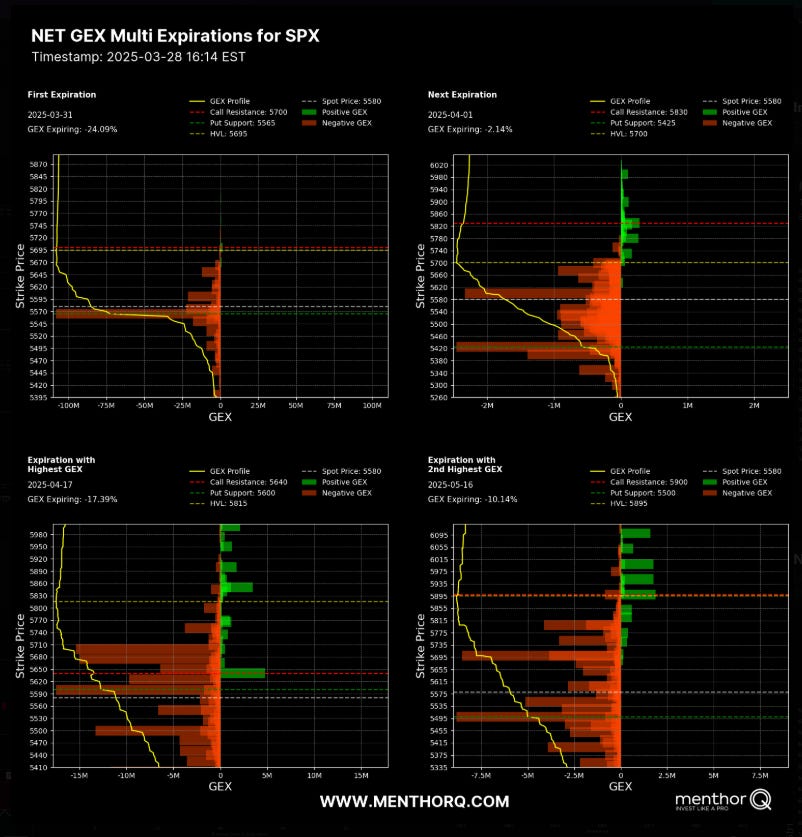
The market maker implied move for the S&P futures this week is +/- 144 points. Therefore the market maker expected range is between 5725 to 5437.
US Market Moving Events for the current week
I have listed the events in the order of significance (highest to lowest).
For the week of March 31 to April 4, 2025, several key economic events and notable earnings reports are scheduled in the United States.
Monday, March 31, 2025
Pending Home Sales Report
– Provides insight into the strength of the housing market by measuring new home purchase contracts.
– (Typical Release: Around 10:00 AM EST)ISM Non‑Manufacturing Index (if scheduled on Monday)
– Gauges service sector activity and can offer clues on consumer spending and overall economic momentum.
– (Typical Release: Around 10:00 AM EST)
Tuesday, April 1, 2025
ADP National Employment Change Report
– Offers an early look at private-sector employment trends, which may foreshadow the official jobs report.
– (Typical Release: Approximately 8:15 AM EST)EIA Weekly Petroleum Status Report
– Provides data on U.S. crude oil inventories, which can influence energy markets and broader market sentiment.
– (Typical Release: Around 10:30 AM EST)
Wednesday, April 2, 2025
Consumer Price Index (CPI) for March 2025
– A key inflation measure that affects expectations for monetary policy. Higher-than-expected inflation can pressure equities by raising discount rates.
– (Typical Release: Approximately 8:30 AM EST)
Thursday, April 3, 2025
Initial Jobless Claims
– The weekly figure offers a near-term look at the health of the labor market and can signal shifts in employment trends.
– (Typical Release: Around 10:00 AM EST)Durable Goods Orders for March 2025
– Reflects new orders for long-lasting manufactured goods and can serve as a proxy for business investment trends.
– (Typical Release: Approximately 8:30 AM EST)ISM Manufacturing Index for March 2025 (if not already released earlier in the week)
– Measures manufacturing activity; a key indicator for economic health in the industrial sector.
– (Typical Release: Around 10:00 AM EST)
Friday, April 4, 2025
University of Michigan Consumer Sentiment Index
– Captures consumer confidence, which can drive retail activity and overall economic momentum.
– (Typical Release: Around 10:00 AM EST)Retail Sales Report for March 2025
– Provides data on consumer spending—a major driver of U.S. economic growth.
– (Typical Release: Approximately 8:30 AM EST)Potential Fed Commentary or Speeches
– Look for any remarks by Federal Reserve officials that may provide clues on monetary policy adjustments.
Anytime During the week
Potential Commentary or Speeches from the US President
– Look for any remarks by the United States President and or high ranking cabinet officials which may move the market. This is NOT date specific.
These events collectively offer a comprehensive view of the current economic landscape, encompassing monetary policy, corporate performance, housing dynamics, and consumer behavior. Investors and analysts will closely monitor these developments to inform their strategies and forecasts.
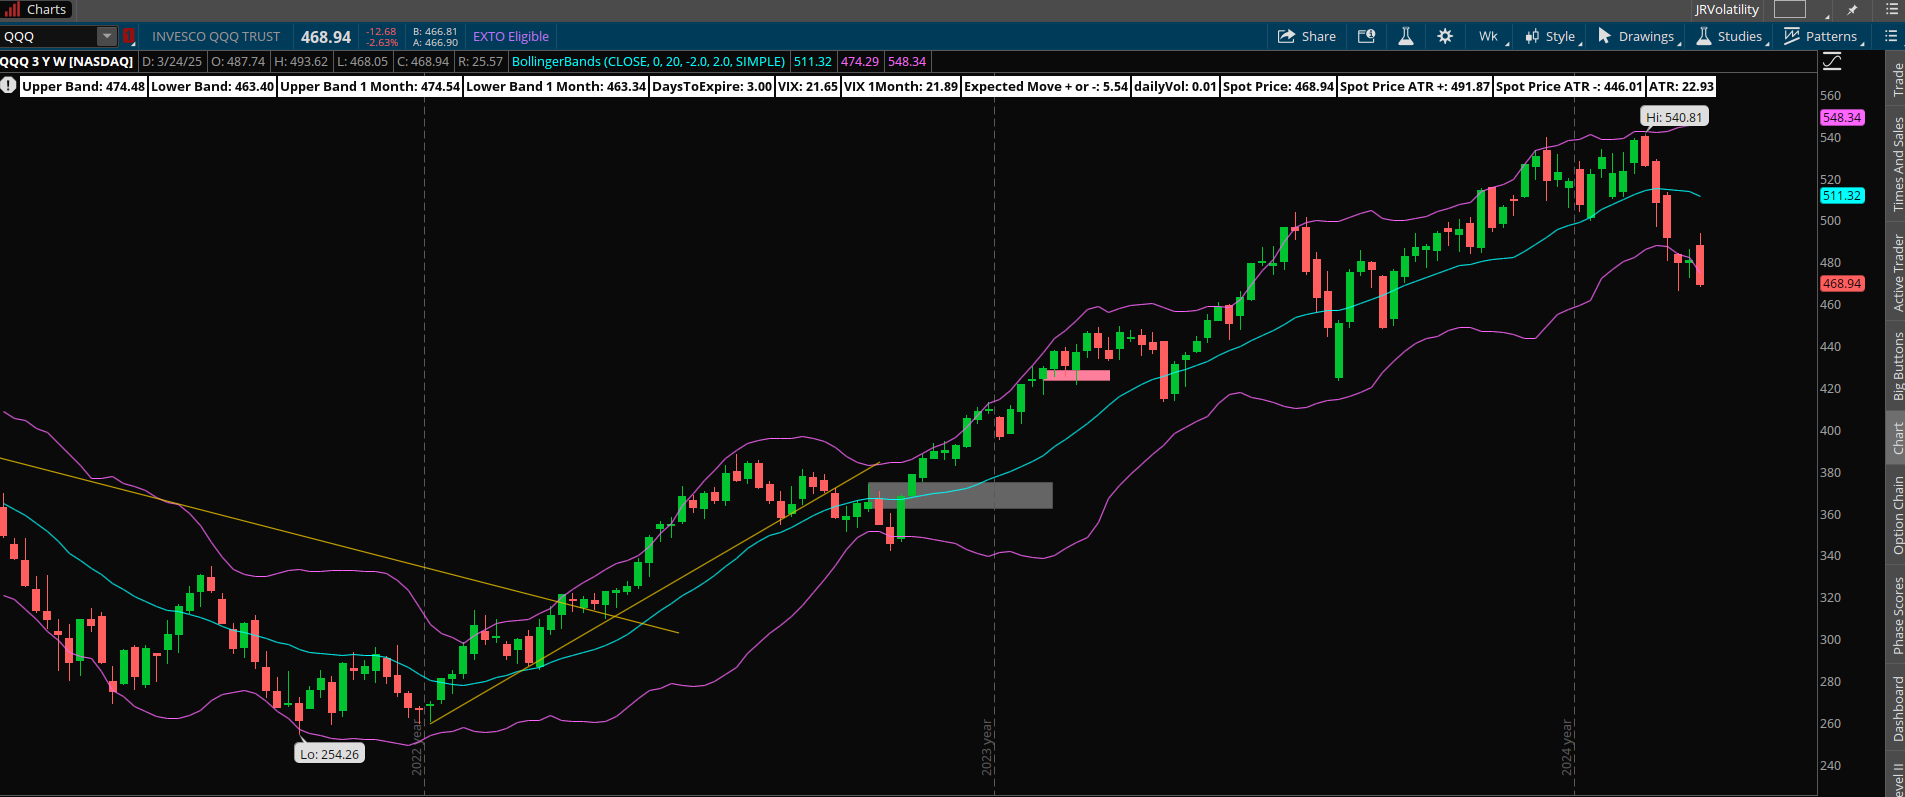
QQQ Weekly Chart
Looking at the QQQs or the Nasdaq100 futures are an important part of my trading plan. The XLK (technology ETF) represents a 33% component of the S&P500. Therefore I use this as an indicator to trade the S&P 500.
QQQs closed at a 469. This is slightly below the lower bollinger band level. Note that the QQQs chart as compared to the SPX is slightly more bearish.
A more bearish QQQ chart will prevent the SPX from making significant upward movement.
QQQ Gamma levels
The chart below shows the positioning information for QQQ. Current GEX profile is showing a slight negative gamma environment. Currently price is 469. The key inflection point is 490 (high volume level).
A couple of noteworthy points:
13.3 percent of the gamma will expire tomorrow. This is in contrast to the 24 percent expiring in the SPX.
24 percent expire during June’s expiration and 18 percent on the April expiration.
The QQQs should act as a break on the upward progression of the SPX.
Since the QQQs are in negative gamma environment, expect large price moves.

The Weekly Plan and trading idea
My general strategy for the current market is limit the weekend exposure to the market. With that being said, I am generally more than 75 percent in cash on any given weekend.
With the details I provide above, I pick my spots of trade entry judiciously. I spend large amount of time analying the S&P 500 and I am trading spreads in this market. As the market has been mostly down, I look to exploit large upward spikes in CALL premium. I will structure trades as broken wing butterflys where I am a net seller of call premium. This article gives a general idea of the trade strategy.
Structuring of trades this way, allows the trade to work in two different ways:
I collect a credit premium upon trade entry. If the market continues to fall then the trade wins via credit collection.
I am selective in picking the long strike and short strike of the trade, such that if a gamma squeeze occurs, the short call will have neglible impact.
I am mindful of the fact that the market can squeeze much higher then I initially accounted for. In this situation, I adjust the middle strike higher to mitigate risk providing more room for the trade to work. As the trades are short term 3 - 10 days out, I attempt to exploit option time decay (theta). Market don’t move in a straight line up or down and I count on this concept as part of my edge in trading.
If the above point does not mitigate risk sufficiently, and the market continues to squeeze than I will simply close the trade.
My strategy also includes trading small as well as different dates to mitigate risk.
In trading, it is fool hardy to believe that every trade will win. I am mindful of this fact and constantly monitor my risk. I am playing the long game and I understand that losses are part of the game!
Key Levels for the week in SPX
Bullish Support Zone:
• 5575 – 5700
This lower range represents where the market has seen strong buying interest and volume accumulation. A bounce from this zone would be viewed as supportive for a mean‑reversion play.Fair Value / Consolidation Zone (POC):
• 5700 – 5740
This is the area of highest volume (the Point of Control), indicating the market’s “fair value.” Price tends to gravitate toward and consolidate in this range, making it a natural target.Bearish Resistance Zone:
• 5740 – 5780
The upper range has historically been a rejection area, where sellers step in. A failure to break above this zone could reinforce a bearish setup or serve as a target for a mean‑reversion pullback.
Have a successful trading week, by waiting for your trade setups to come to you. Always manage your risk and understand what you expect to lose prior to trade entry. By managing risk, you unlock profitability.
Gamma Level data (netgex data) and skew data (market sentiment) was provided by menthorQ.com
How I trade
I did a number of presentations of my trading process with menthorQ. You can find them here. This is under the highlights section of my “x” account found here.
Follow me on X formerly twitter . I post my market view during the week.
Disclaimer
Please don’t follow my idea(s) blindly. Do your own due dilligence before you attempt to trade. Again, always manage your risk.
Thank you for reading my weekly plan.
Joel