


Weekly Plan for May 12
The S&P 500 has paused last week into a supply zone. What is the next move? I describe my plan below for the week ahead

Summary
Since the S&P 500 made a significant low on April 9, the market has been in “buy the dip” mode. S&P futures have rallied from 4,832 to 5,741—a nearly 900-point swing from low to high. There was even a stretch in which prices rose for nine consecutive days.
Below, I’ll analyze the current move—drawing on chart data and positioning information—to develop a plan for the week.
S&P Daily futures Chart
This chart was provided in previous weeks and still is used as a reference. The highlighted rectangle shows the area of supply which ES has hit. This area has acted as a stalling region over the last 7 trading days.
Price has touched a trend line and if the bullish momentum should continue, then the expectation is that price will bounce off the price region of 5580 - 5600 and move higher.

From elliot wave analyis, the table summarizes the expectations:

S&P futures with Fibonacci Retracements
This chart shows S&P futures with both fibonocci levels from the most recent high/low and bollinger bands. The chart is using a daily timeframe.
Bollinger Bands are a popular technical analysis tool that helps traders assess price volatility and identify potential overbought or oversold conditions. For greater insight look here.
I have placed Fibonacci retracements from the high 6170 to the 4837 low. The bands encapsulate 2 standard deviations of price action.
Additionally I added 200 SMA to the chart shown in GOLD. Price has been in a small range for the week stalling below the 200 SMA.

The Volume Profile View
The chart below shows the S&P futures (contract ES) 10 day daily volume profile/market profile chart.
The data aggregation is done in 30 minute periods. The pink line to the left shows the volume POC while the green line to the right shows the POC of time. Volume and time donot always line up to the exact location.
The highlighted region shows a market in balance. The balance area encompasses 7 days of price action.
The chart indicates that this is a time for caution, as the S&P is waiting for a catalyst to break out of this boxed region.

📊 Volume Profile Breakdown (10-Day Composite)
Price is sitting near the 10 day POC. That is 5686. The VAL is 5585 which happens to be the trendline support. This was noted in a earlier chart. Breaking below this high volume area with strong volume would signal that the current up move is complete.

Read about market profile and auction market theory here.
Current Market Outlook Using Sectors
Listed below is the performance of the sectors that make up the S&P 500 for last week. Health care (11 percent of the S&P 500), the 2nd largest sector made a significant move lower.

VIX Chart
The VIX is a number that measures how much people think the S&P 500 will move (up or down) over the next 30 days.
It’s often called the:
✅ “Fear Index”
because it rises when investors are nervous or expecting big market swings.
Currently the VIX has in contango.
🔄 What is Backwardation in VIX?
Backwardation means:
Spot VIX > VIX Futures (especially 1-month out)
This implies the market expects volatility to decrease in the future, but currently sees significant near-term risk.
📘 What is VIX Contango?
VIX contango happens when:
🔸 The VIX futures prices are above than the current (spot) VIX.
It’s the opposite of backwardation.
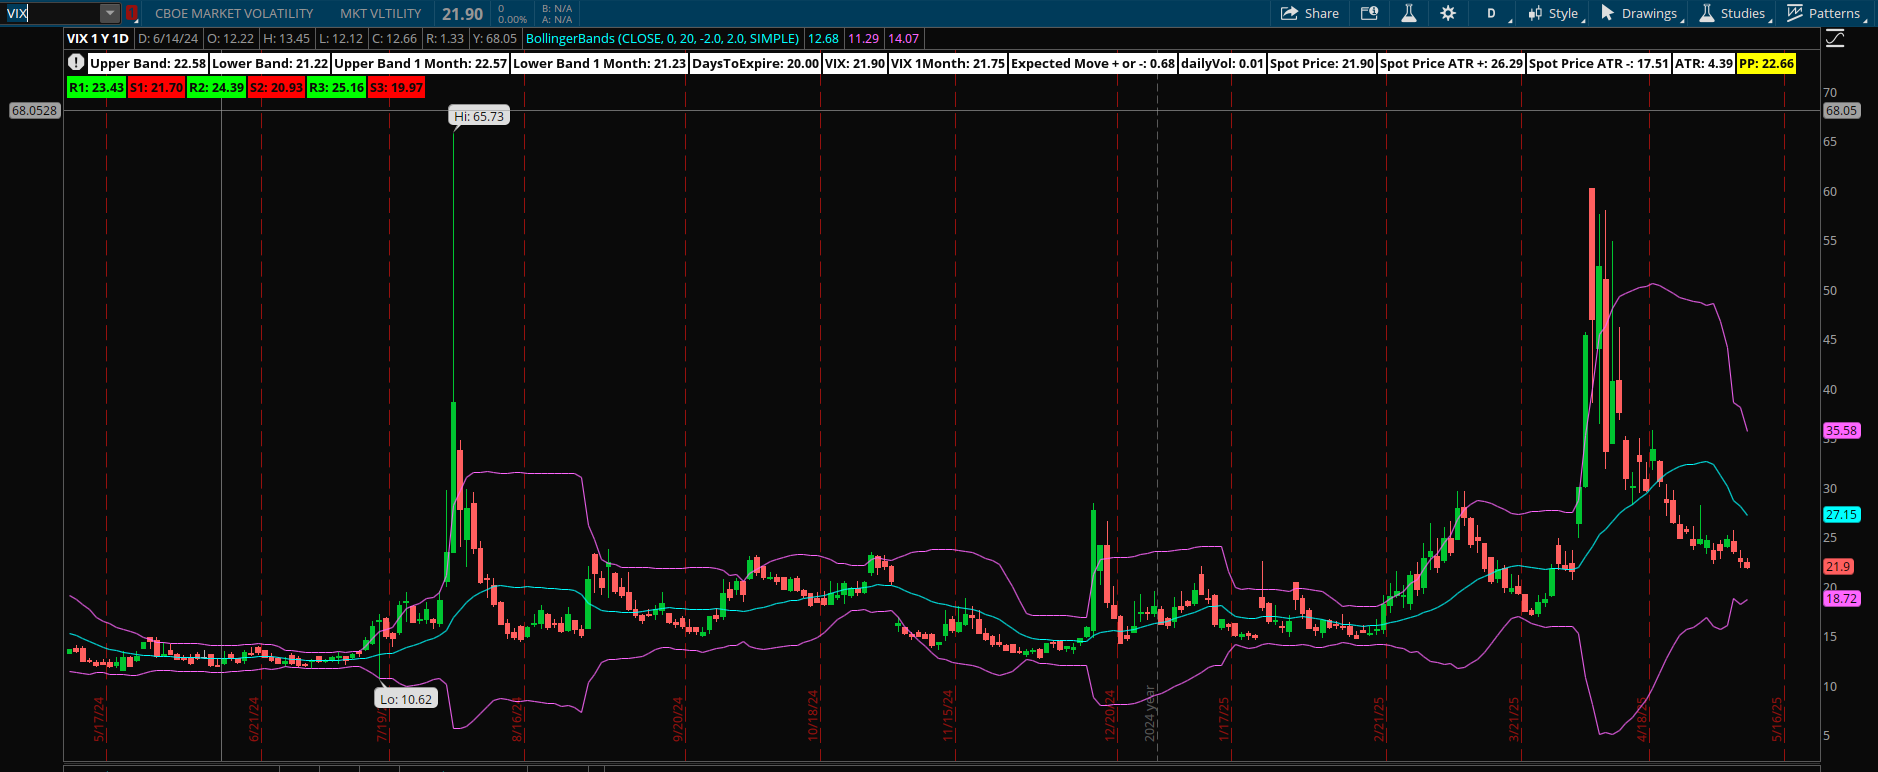
This implies that there is a low amount of risk, owning stocks short term. VIX is currently in the low end of the range.
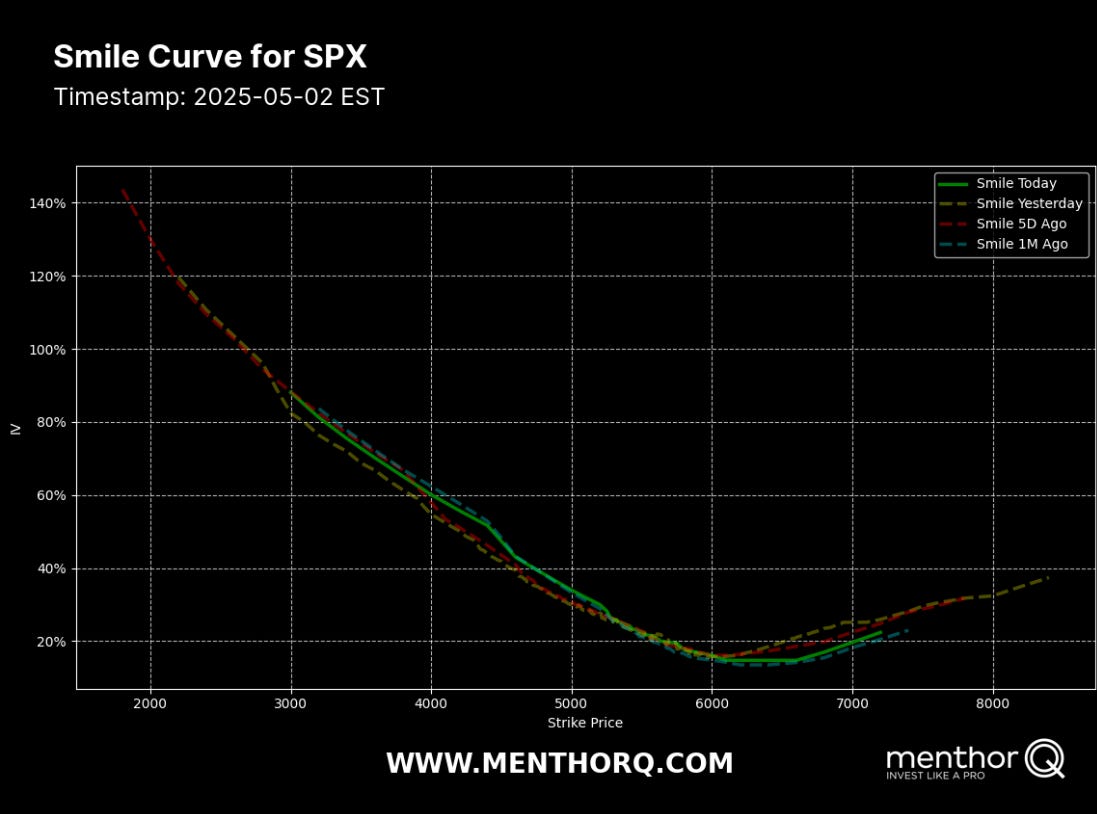
The MenthorQ SMILE curve
The MenthorQ skew smile curve chart of the S&P 500 cash index.
Key takeaways
Put Wing Softening
Deep‐OTM‐put IV has declined from the extreme tails of a month ago (110–120 %) down to ~85–95 %, reflecting reduced concern about a big sell‐off.
Stable ATM Core
ATM vols remain anchored in the mid-teens, showing that overall volatility levels haven’t moved much—only the wings have shifted.
Call Wing Compression
While still above the ATM core, OTM‐call IV has pulled in from ~28–32 % five days ago to ~18–20 % today, indicating less one‐sided upside hedging demand.
Skew Flattish vs. 5 Days
The smile is flatter than it was five days ago, with both wings closer to the ATM level—suggesting a neutral‐to‐bullish tilt in vol positioning.
S&P 500 Term Structure
The chart below shows the $SPX term structure. The green line shows today’s term structure. It is lower compared to the last five days indicating price consolidation.

Key Observations
Front-End Cheapness
Today’s 1 D ATM vol (~15 %) sits well below yesterday’s (~21 %) and five days ago (~13 %), creating a mild inversion at the very front. Short-dated vols are relatively cheap vs. mid-term.
Flat/Modestly Rising Slope
Beyond ~5 DTE, vols gently climb from ~18 % → ~18.2 % into the 90 DTE bucket. That’s a flat contango, tighter than the steeper slopes seen five days ago or a month ago.
Structural Vol Compression
All tenors 1–90 DTE are down vs. the peaks of a month ago (when 1 DTE was ~55 %!). The market has digested much of its recent vol risk.
Put/Call Wings (in context of the full smile)
With the ATM core anchored in the mid-teens, front-end cheapness suggests buying very short vega in anticipation of a vol flare into next week’s data flow (CPI, FOMC).
Trading Implications
Short-term spreads: Sell a calendar (e.g. 5 DTE vs. 21 DTE) to harvest near-cheap front-end vol against richer mid-term. This spread is short vega and long gamma.
Vega idea: Front-end vol is low—consider buying very short-dated puts or call spreads as a hedge into CPI/FOMC.
Yield enhancement: Use diagonal swaps (long 5 DTE, short 30–60 DTE) to exploit the flat term slope.
In sum, the term structure is unusually flat and compressed across all tenors—prime conditions for front-end vol strategies into this week’s market catalysts.
S&P 500 Cash Gamma levels
The chart shows four different GEX chart with the highest level of GEX. GEX identifies areas on the chart where PUT and CALL volume exist at various strikes ( price levels).

Here is a concise summary:

The 2nd largest GEX exposure is on 5/16. After May 16 rolls off, net gamma will become even more negative (Jun 20), so be prepared for larger, faster swings once expiration.
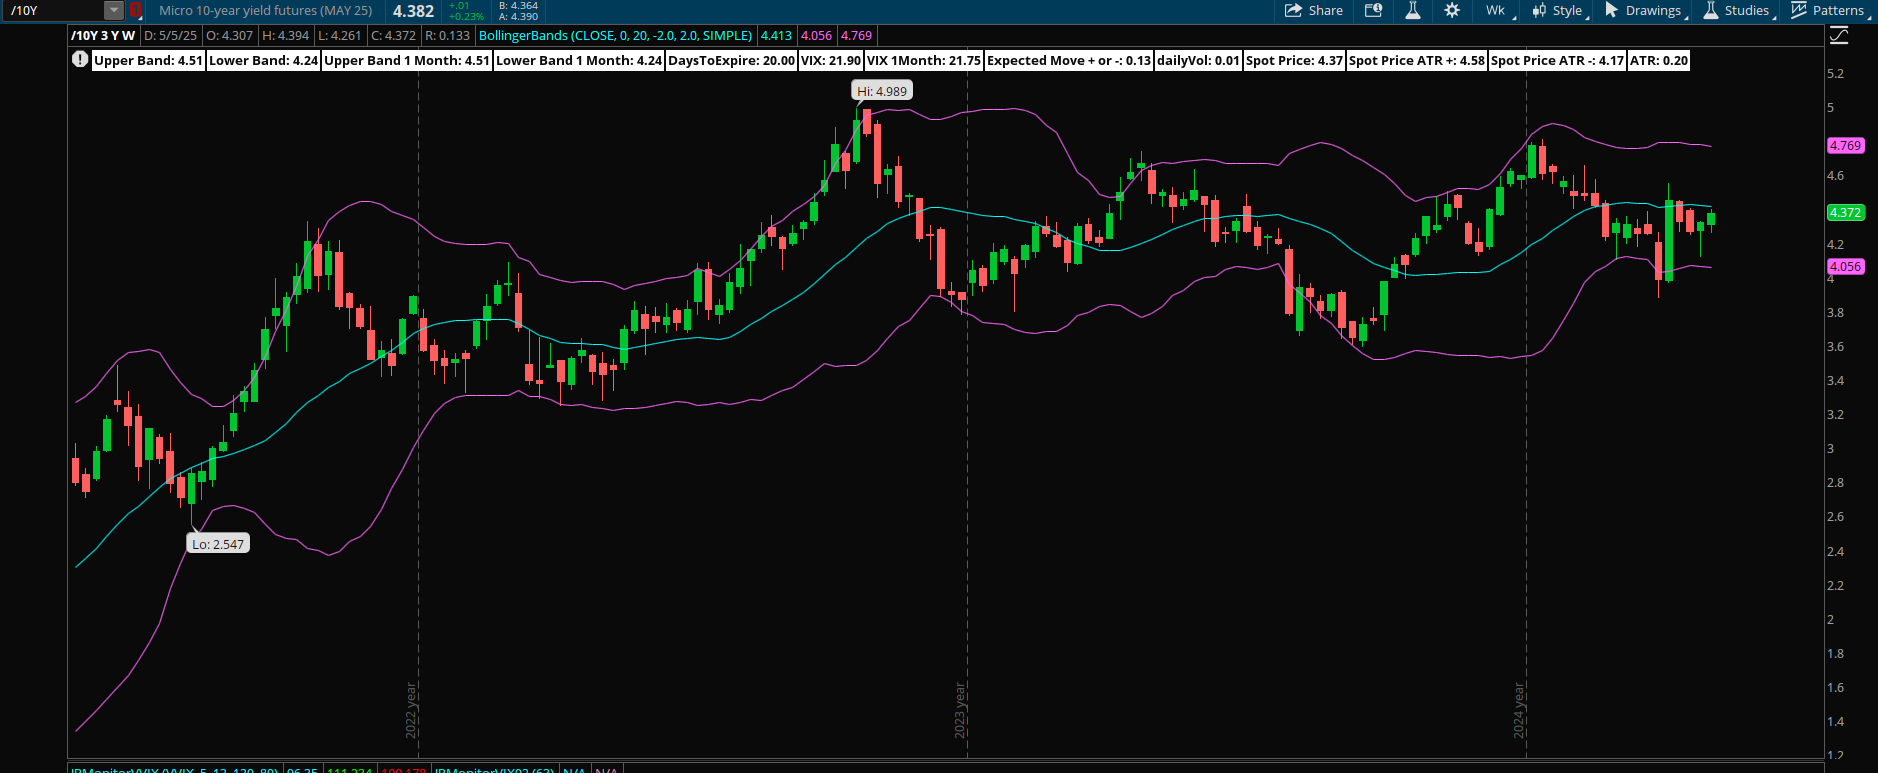
Long Term rates (10 year Treasury)
The FOMC cut rates (December 2024) a .25 basis point cut. Rates peaked in the first week of January 2025. The yield is currently at 4.4.
At the most recent meeting FOMC left rates unchanged. The fed-fund watch tool shows that there is a 17% probability that short term rates will get lowered by 25 basis points at the next meeting in June.
I have placed bollinger bands around the price action.
🧭 Risk Sentiment Matrix (Yields vs SPX)
10Y Yield Level SPX Signal Risk Mood
< 4.10% Bullish SPX Goldilocks, Fed in control
4.10–4.40% Neutral chop Confused regime, data-dependent
> 4.50% Bearish SPX Inflation concern, risk-off
I list the major events below for the current trading week.
Here are the key economic events for the week of May 12–16, 2025, all times Eastern. Plan for a volatile week as CPI data release is Tuesday and PPI data release is on Wednesday.

QQQ Daily Chart
Looking at the QQQs or the Nasdaq100 futures are an important part of my trading plan. The XLK (technology ETF) represents a 33% component of the S&P500. Therefore I use this as an indicator to trade the S&P 500.
Here is a summary of the current QQQ chart:

Resistance & Targets
Level Source
500.00 Psychological Round-Number:
538.84 February 2025 High
QQQ Gamma levels
The chart below shows the positioning information for QQQ.
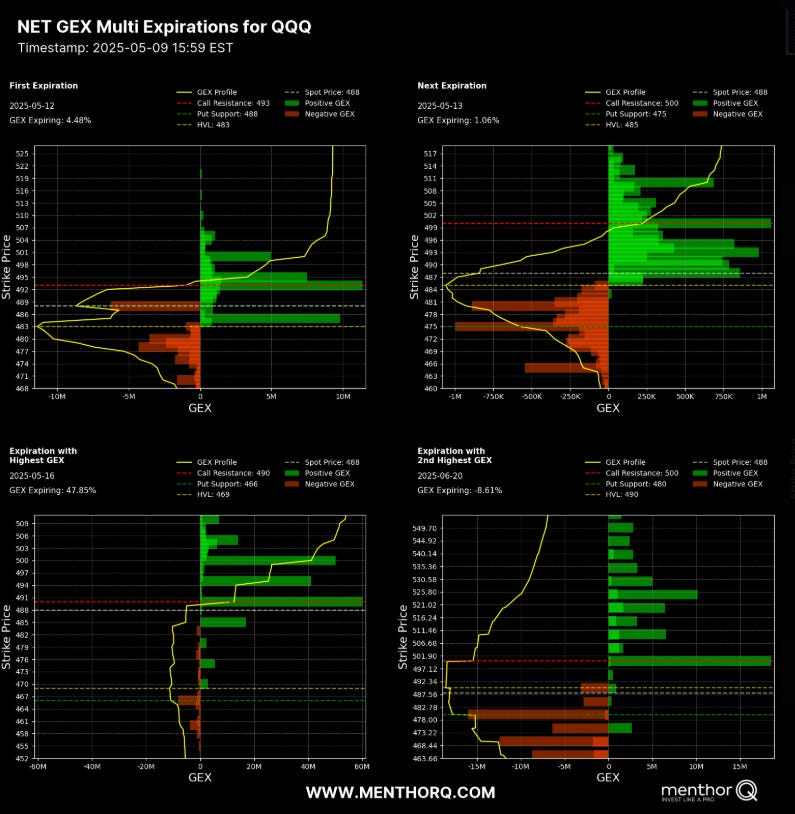
Here is a summary of the GEX levels:

📊Key Points:
Primary Support:
• 488–490 (May 12 put-walls & HVL) for shallow pullbacks.
• 466–470 (May 16 put‐walls) for deeper retracements once that cluster comes into play.Immediate Resistance:
• 493–500 (May 12/May 16 call-walls & Jun 09 resistance) caps rallies in the near term.Gamma Roll Risk:
After Friday’s May 12 expiration, the system loses ~5 % of positive gamma—pullbacks may become less supported, and rallies less cushioned, as you move into the May 16/Jun 09 expiries.
Management of last week’s plan
Last week I was short bull put spreads and they were closed profitably. Currently I am flat as the market has paused. Price action continues to consolidate indicating a big move is expected. The magnitude and direction is not clear, therefore caution is warranted.
You can review all of my posts here.
The Weekly Plan and trading idea
My general strategy for the current market is limit the weekend exposure to the market. With that being said, I am generally more than 75 percent in cash on any given weekend.
The market has hit a inflection point and waiting for the next big move. As the trend has been higher my current outlook has been bullish.
Since the market has become bullish over the last 10 - 15 days, i would look for only bullish srategies. I would wait for price to make a small pullback prior to entry. Suggested trade ideas:
bullish put spread capturing 30 percent upon entry. The trade is put on for between 21 - 45 DTE. This is the time where the fastest amount of time decay starts to occur.
bullish diagonal call spread where the longer leg is 60 days out and the shorter leg is 30 days out. The objective is for price to approach the shorter dated option which has a higher delta as compared to the longer dated option.
My strategy also includes trading small as well as different dates of expiration, different strikes and ranges to mitigate risk.
In trading, it is fool hardy to believe that every trade will win. I am mindful of this fact and constantly monitor my risk. I am playing the long game and I understand that losses are part of the game!
Have a successful trading week, by waiting for your trade setups to come to you. Always manage your risk and understand what you expect to lose prior to trade entry. By managing risk, you unlock profitability.
Remember to size down your trades, as volatility is high!
Gamma Level data (netgex data) and skew data (market sentiment) was provided by menthorQ.com
Presentation on VIX
A few weeks ago I did a presentation on the VIX.

How I trade
I did a number of presentations of my trading process with menthorQ. You can find them here. This is under the highlights section of my “x” account found here.
Follow me on X formerly twitter . I post my market view during the week.
Disclaimer
Please don’t follow my idea(s) blindly. Do your own due dilligence before you attempt to trade. Always manage your risk.
Thank you for reading my weekly plan.
Joel
