


Weekly Plan for May 19
A huge move in the indices last week with the S&P 500 up more than 5%. Will this week bring a pullback?

Summary
Since April 9, the S&P 500 has been in a clear “buy-the-dip” regime, rallying almost vertically from 4,832 to 5,975—an 1143 point advance in just five weeks. With technical indicators stretched into extreme overbought territory and call-to-put buying at elevated levels (extreme call buying), what is our game plan for the coming week?
On Friday after the close, credit‐rating agency Fitch downgraded U.S. sovereign debt. Was this truly a lagging signal, as Bissent contends, or does it represent something more significant? Read it here.
In the short term, the downgrade may introduce volatility and push prices lower, but over the longer haul the market has continued to climb unabated.
Below is the S&P 500’s 90-day performance following the previous two sovereign‐debt downgrades by the other major agencies:
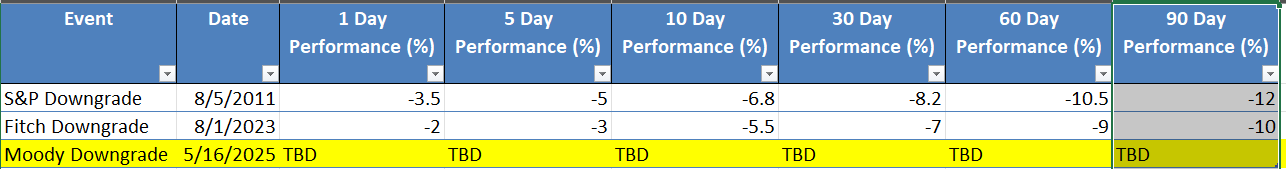
As a short term trader, potential weakness this coming week, could lead to a buying opportunity.
Below, we start with the S&P 500 futures chart drawing on chart data and positioning information—to develop a plan for the week.
📊 S&P Daily futures & Fibonacci Retracements
This chart shows a momentum indicator (CCI standard) showing both overbought and oversold conditions. I have highlighted some recent signals showing both buy and sell signals on the S&P. Notice once the signal reached an extreme, price reversed within a few days. The most recent signal (sell) was generated a few days ago.
Since the market has been so strong, I expect a small retracement into the 200 SMA 5780 - 5800 region. This price area coincides with a previous peak around the time of 3/25.

📊 S&P futures with Fibonacci Retracements
This chart shows the current short term wave pattern with a potential 5th wave concluding at 5975 from a pattern which began on 5/2.

Below are the standard Fibonacci‐extension “turn‐zones” for the current leg, measured off the 5/2 low at 5 750.56. up to Friday’s high at 5 975.50 (100 %).

Longer term, I still see the price action reaching the previous high near 6170.
📊 The Volume Profile View
The chart below shows the S&P futures (contract ES) 10 day daily volume profile/market profile chart.
The data aggregation is done in 30 minute periods. The pink line to the left shows the volume POC while the green line to the right shows the POC of time. Volume and time donot always line up to the exact location.
I have pointed out the last day in the profile where the POC is in the lower end of the day’s range. This suggests the rally is running out of steam. Based on this analysis 5850 is a target as this POC has not been tagged. Additionally, if a stronger decline happens, the gap between 5805 - 5741 would be a logical target. This is highlighted.

Read about market profile and auction market theory here.
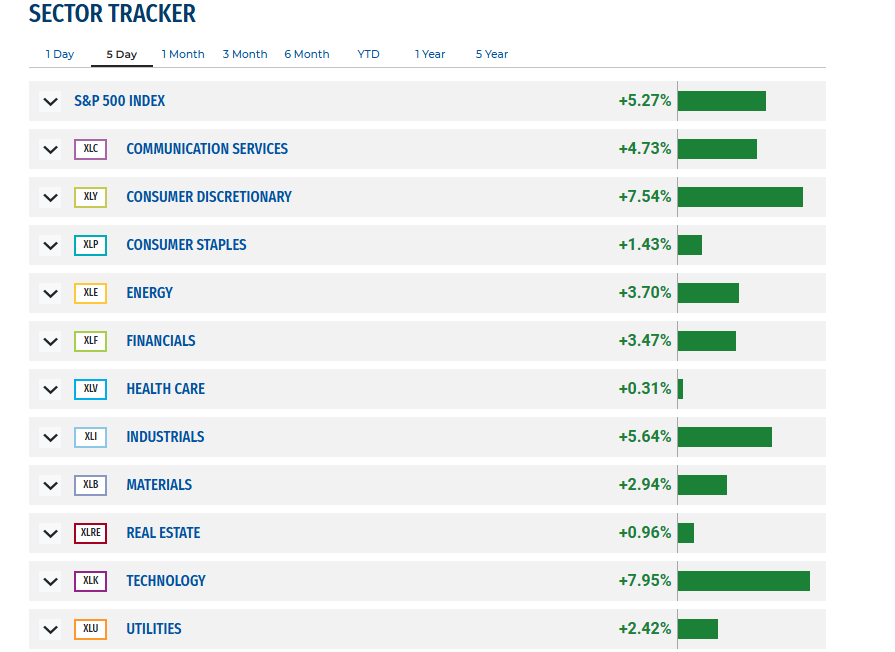
Current Market Outlook Using Sectors
Listed below is the performance of the sectors that make up the S&P 500 for last week. Note the strong performance of all the sectors, specifically technology and consumer discretionary.
VIX Chart
The VIX is a number that measures how much people think the S&P 500 will move (up or down) over the next 30 days. The VIX has been in a steady decline over the last 30 days.
The VIX options expiring this week(Wednesday) so an unclinching of S&P 500 will occur as players rehedge to the next expiration. What does this mean?
Short-term IV spikes
In the last 1–2 sessions before VIX settlement, the front‐month VIX futures tend to trade rich, lifting SPX near-term IV.
SPX options in that 30-day band can see elevated bid/offer spreads and skew distortions.
Term-structure roll
After settlement, VIX futures roll down: the near‐month collapses toward spot VIX, steepening contango.
SPX calendar spreads (near vs. far expirations) often see vol crush in the front leg, creating a ringing effect in SPX option prices.
Currently the VIX is in contango.
🔄 What is Backwardation in VIX?
Backwardation means:
Spot VIX > VIX Futures (especially 1-month out)
This implies the market expects volatility to decrease in the future, but currently sees significant near-term risk.
📘 What is VIX Contango?
VIX contango happens when:
🔸 The VIX futures prices are above than the current (spot) VIX.
It’s the opposite of backwardation
The current VIX chart shows little fear in the market. It is near a low area from early January and late March when increase in volatilty commenced.

The MenthorQ SMILE curve
The MenthorQ skew smile curve chart of the S&P 500 cash index.
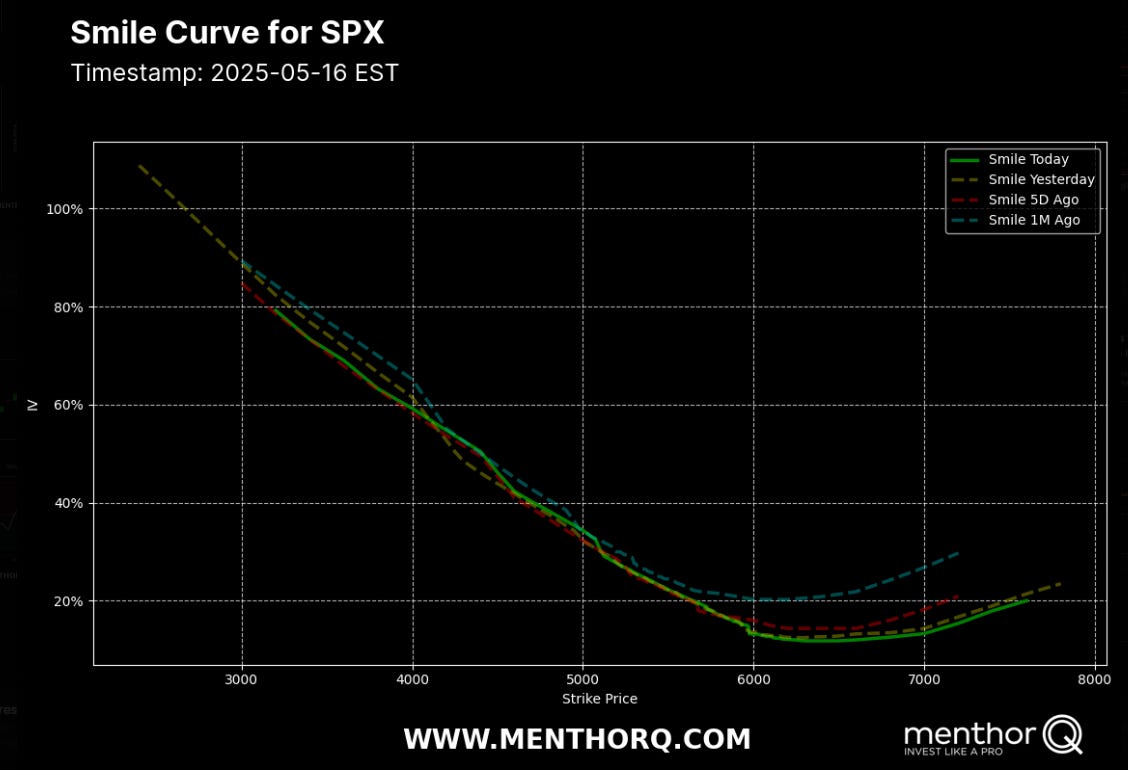
Key takeaways
Across-the-board collapse
From 1 M↘5 D↘1 D↘Today, vols have fallen at every strike—ATM is now at multimonth lows (~12–13 %).
Still extremely steep downside skew
Deep-put vols (~75 %) vs. ATM (~13 %) = ~62 vol-pts of skew.
One-month-ago that skew was ~90 vol-pts; it’s narrowed, but remains huge, reflecting still-elevated tail‐hedge demand.
OTM calls stay very cheap
OTM‐call vols at 7 000 are only ~13 %, vs. ~15 % on the far right tail—indicating persistent backspread/spec demand but at very low levels.
Flattening of the belly
At strikes 4 000–6 000 the smile has flattened out more than in the wings, suggesting generic volatility compression rather than just a shift in skew.
Bottom line
Volatility has collapsed, but skew remains extreme.
Premium sits in deep OTM puts, while the belly is as cheap as it’s been in months.
For income: sell belly (calendars/diagonals) and sell skew (risk reversals).
For crash protection: either buy backstops (deep puts) or one-leg broken-wing butterflies.
Plot these key strikes and vols on your desk to orient your next SPX‐options trades.
S&P 500 Term Structure
The chart below shows the $SPX term structure. The green line shows today’s term structure. It is lower compared to the last five days indicating price consolidation.

Key Observations
1. Vols have collapsed across the board
1 DTE vols are down near 7 % (green), from ~12 % five days ago (red) and ~27 % a month ago (yellow).
10–20 DTE vols now sit ~12–13 %, versus ~14 % yesterday (grey) and ~18 % five days ago.
60–80 DTE vols are ~14.5–15 %, down only a few vol-points from a month back—but still the highest on the curve.
2. The curve is now in steep contango
Slope from 10 DTE (13 %) to 80 DTE (15 %) ≈ 2 vol pts — you’d earn ~2 vol pts of roll‐yield per month selling front and buying back.
One month ago, that slope was steeper (~4–5 vol pts), so a lot of the “carry” has already been harvested by sellers.
Trading Implications
Sell front‐to‐back calendars:
• Short 10 DTE ATM vol (~12 %) vs. long 80 DTE ATM vol (~15 %) to pocket ~2 vol‐pt of roll‐yield per month.Buy short‐dated straddles/strangles:
• One‐week ATM vols at ~7 % make cheap hedges into unexpected catalysts.Deploy diagonals:
• Buy 60–90 DTE ATM vol (~15 %) and sell 10–15 DTE ATM vol (~12 %) at the same strike for positive carry with long‐vega exposure.Harvest skew with risk‐reversals:
• Sell 10 Δ puts / buy 10 Δ calls to exploit steep downside skew vs. cheap upside vols.Layer bull‐put spreads at key retracements:
• Sell 5800/5750 or 5850/5800 spreads targeting a 38–62 % pullback (~5890–5836).Monitor curve flattening:
• If the vol‐slope between 10 DTE and 80 DTE narrows below ~1 vol‐pt, lock in calendar/diagonal profits.Maintain tactical hedges:
• Keep small, short‐dated put spreads or straddles in place to guard against abrupt front‐end vol spikes.
S&P 500 Cash Gamma levels
The chart shows four different GEX chart with the highest level of GEX. GEX identifies areas on the chart where PUT and CALL volume exist at various strikes ( price levels).
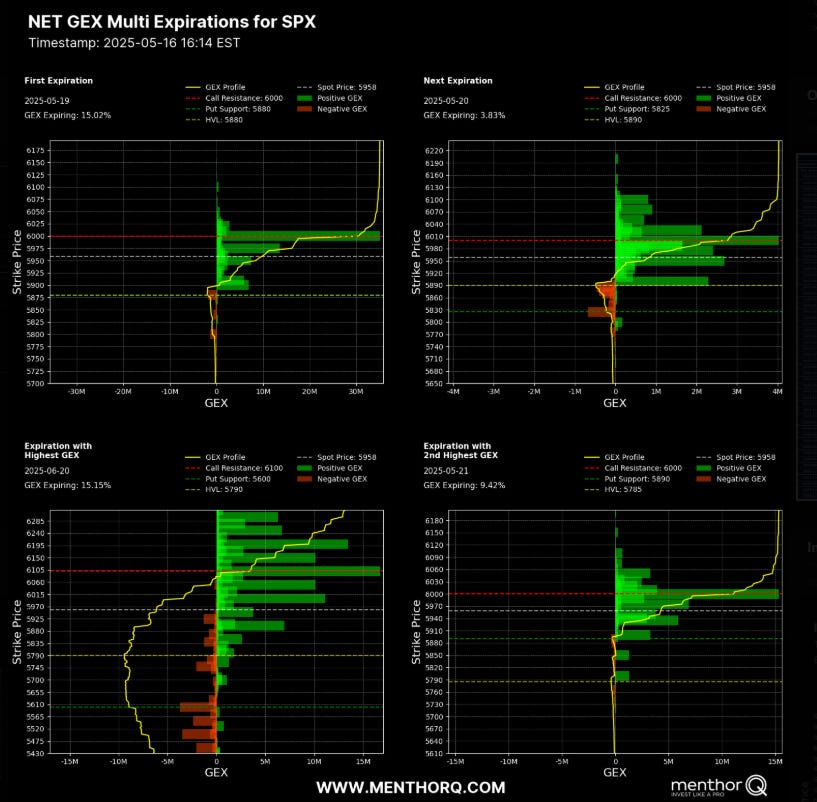
Front‐week (5/19) is the biggest gamma expiry right now—dealers have very heavy call gamma at 6 000, and almost no put gamma until 5 880.
Next expiries (5/20 & 5/21) reinforce that: another big cluster of call gamma at 6 000 with put support only kicking in below 5 825–5 785.
The mid‐June (6/20) expiration carries the largest single gamma bucket at 6 100, but it’s still far more call‐heavy than put‐heavy.
Bullish Implications
Dips below ~5 900–5 880 will trigger massive dealer buy‐back flows (long‐gamma hedges), effectively pinning SPX in the 5 880–5 900 area.
Rallies into 6 000–6 100 will meet the strongest dealer selling pressure (to re‐hedge call shorts), marking a likely resistance zone.
Minimal put‐gamma between 5 900–5 825 means there’s almost no natural “floor” until you breach 5 880–5 825, leaving that range as your key support band.
Trading Takeaways
Look to buy in the 5900–5880 zone—those dips should be met with dealer‐driven buying.
Fade rallies into 6000–6100: that’s where most call‐gamma hedges live, so expect a bit of a stall or chop.
Long Term rates (10 year Treasury)
The FOMC cut rates (December 2024) a .25 basis point cut. Rates peaked in the first week of January 2025. The yield is currently at 4.49.
At the most recent meeting FOMC left rates unchanged. The fed-fund watch tool shows that there is a 8% probability that short term rates will get lowered by 25 basis points at the next meeting in June.
I have placed bollinger bands around the price action.

🧭 Risk Sentiment Matrix (Yields vs SPX)
10Y Yield Level SPX Signal Risk Mood
< 4.10% Bullish SPX Goldilocks, Fed in control
4.10–4.40% Neutral chop Confused regime, data-dependent
> 4.50% Bearish SPX Inflation concern, risk-off
Economic Events for the Week
Here are the key economic events for the week of May 19–23, 2025, all times Eastern.
Monday, May 19
08:30 AM – Fed “fedspeak” marathon:
Atlanta Fed President Bostic (voter)
Vice Chair Philip Jefferson & NY Fed President Williams (voter)
Dallas Fed President Logan (non-voter)
Minneapolis Fed President Kashkari (non-voter) Forexlive
10:00 AM – Conference Board Leading Economic Index (Apr) Investopedia
10:00 AM – S&P Global Flash U.S. Manufacturing & Services PMIs (May prelim) Investopedia
Tuesday, May 20
09:45 AM – S&P Global Flash U.S. Services PMI (May prelim) Investopedia
10:00 AM – Existing Home Sales (Apr) Investopedia
10:00 AM – New Home Sales (Apr) & Consumer Confidence (May) Investopedia
Wednesday, May 21
08:30 AM – Initial Jobless Claims (week ending May 17) Investopedia
10:00 AM – Chicago Fed National Activity Index (Apr) Investopedia
Thursday, May 22
08:30 AM – GDP (Q1 Advance) Investopedia
10:00 AM – PCE Price Index & Core PCE (Apr) Investopedia
Friday, May 23
10:00 AM – University of Michigan Consumer Sentiment (Final May)
QQQ Daily Chart
Looking at the QQQs or the Nasdaq100 futures are an important part of my trading plan. The XLK (technology ETF) represents a 33% component of the S&P500. Therefore I use this as an indicator to trade the S&P 500.

Here is a summary of the current QQQ chart:
Key Levels for QQQ
Here are the critical reference points on the daily QQQ setup (spot = 521.51):
Near-term pivot: 518.78
Immediate resistance: 522.40 (R1) → next at 525.54 (R2) → 529.16 (R3)
Immediate support: 515.64 (S1) → next at 512.02 (S2) → 508.88 (S3)
Bollinger Bands (20, 2σ): Upper ≈ 531.11 → Lower ≈ 483.79
ATR envelope (7.96 pts): Upper ≈ 529.47 → Lower ≈ 513.55
Parabolic SAR: 502.83 (trail‐stop level)
Expected 1-day move: ± 6.33 pts (~1.2 %)
Key range today is roughly 515.6–522.4.
A clean break above 522.4 would expose 525.5–529.2 (upper BB).
A dip below 515.6 risks 512.0 and then the ATR‐lower at ~513.6, with the 502.8 SAR as your hard invalidation.
QQQ Gamma levels
The chart below shows the positioning information for QQQ.
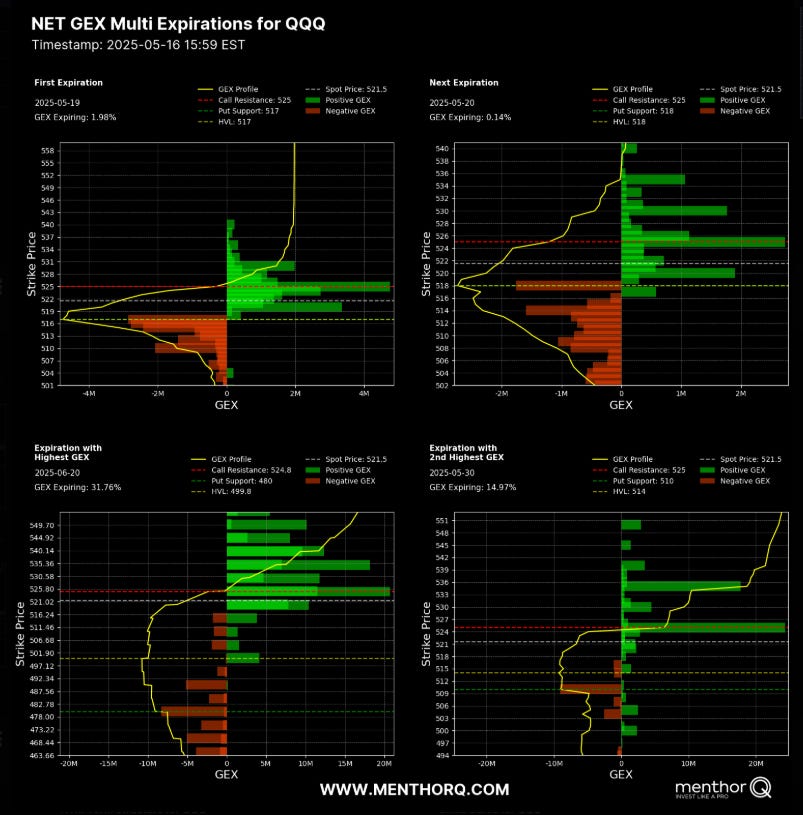
Here is a summary of the GEX levels:
📊Key Points:
Massive call‐gamma wall at ~525 across expiries (especially 5/20 and 5/30), making that zone a likely resistance/cap on rallies.
Very light put‐gamma until you breach ~517–518 on front‐week expiries, meaning any dip into that band should trigger dealer buying and “pin” QQQ there.
Peak gamma concentration is on the 5/20 expiration (~31.8 % of total GEX at a 524.8 strike), dwarfing the tiny 0.14 % expiring on 5/20 front‐day.
Next biggest gamma Area sits at the 5/30 expiry (≈14.97 % at strike 525), reinforcing call‐side skew into the end of May.
Longer‐dated support for June (6/20) only kicks in near 510, so any deeper sell‐off into that area will be met with sustained dealer buy‐backs.
Management of last week’s plan
Last week I was short bull put spreads and they were closed profitably. Currently I am flat as the market has paused. With price action moving to extreme overbought levels, I view this week as a consolidation week, where I expect the S&P to get bought.
You can review all of my posts here.
The Weekly Plan and trading idea
My general strategy for the current market is limit the weekend exposure to the market. With that being said, I am generally more than 75 percent in cash on any given weekend.
Since the market has become bullish over the last 30 days, i would look for only bullish srategies. I would wait for price to make a small pullback prior to entry. Suggested trade ideas:
bullish put spread capturing 30 percent upon entry. The trade is put on for between 21 - 45 DTE. This is the time where the fastest amount of time decay starts to occur.
bullish diagonal call spread where the longer leg is 60 days out and the shorter leg is 30 days out. The objective is for price to approach the shorter dated option which has a higher delta as compared to the longer dated option.
My strategy also includes trading small as well as different dates of expiration, different strikes and ranges to mitigate risk.
In trading, it is fool hardy to believe that every trade will win. I am mindful of this fact and constantly monitor my risk. I am playing the long game and I understand that losses are part of the game!
As the market has moved to extreme bullishness a decline of roughly 100 - 150 points. This is approximately 5800 - 5750, would still make this a very bullish market, and provide an oppurtunity to add bullish positions.
Have a successful trading week, by waiting for your trade setups to come to you. Always manage your risk and understand what you expect to lose prior to trade entry. By managing risk, you unlock profitability.
Remember to size down your trades, as volatility is high!
Gamma Level data (netgex data) and skew data (market sentiment) was provided by menthorQ.com
Presentation on VIX
A few weeks ago I did a presentation on the VIX.

How I trade
I did a number of presentations of my trading process with menthorQ. You can find them here. This is under the highlights section of my “x” account found here.
Follow me on X formerly twitter . I post my market view during the week.
Disclaimer
Please don’t follow my idea(s) blindly. Do your own due dilligence before you attempt to trade. Always manage your risk.
Thank you for reading my weekly plan.
Joel
