Weekly Plan for May 25
Another volatile week for the S&P500. It was down 2.6% for the week. Bulls should take heart as the index stopped near the 200 SMA. Will the index reverse course this week? I go over the plan below.

Summary
Last week, the S&P 500 posted its first weekly reversal since April 9, following a nearly uninterrupted rally from 4,832 to 5,975. As anticipated, mean reversion set in, and the index finally pulled back.
I had highlighted the 200-day simple moving average as a likely support area the previous week ( That is 5798 ). The S&P 500 closed the week at 5,802—just above that key level. You can find all of my market updates, including last week’s post, here.
This week features a few major catalysts, including Nvidia (NVDA) earnings and the latest PCE inflation report—both of which could significantly influence market sentiment during the shortened Memorial Day holiday week.
The current setup is somewhat uncertain. While the longer-term trend for the S&P 500 remains bullish, the short-term trend has turned bearish. This divergence suggests a time for caution, as it's typically better to wait until short-term signals realign with the broader trend.
In the sections below, I’ll present various data points that reflect these conflicting signals. Given the mixed outlook, it makes sense to wait for the market to show its hand before deploying significant capital.
We begin with the S&P 500 futures chart, incorporating both price action and positioning data to outline a trading plan for the week ahead.
📊 S&P Daily futures & Fibonacci Retracements
The chart was provided last week showing the overbought momentum indicator (CCI standard). The most recent overbought condition appeared on 5/13 providing a clue that upward momentum was ready to pause.
I noted that “Since the market has been so strong, I expect a small retracement into the 200 SMA 5780 - 5800 region. This price area coincides with a previous peak around the time of 3/25”.

Short Term momentum is providing a negative signal. I have added the parabolic SAR indicator in the chart below. This indicator is a trend following indicator and shows that the most recent momentum has turned down. As a short term trader, I would wait for the dots to lie under the price action, indicating that the trend has resumed higher.
I have included the futures price action for Sunday/Monday(Memorial Day holiday). Price has gapped up more than 1%. This current price action will lead to whip-saws, therefore I am not interested in taking this as a bullish entry signal. Additionally, overnight volume on the futures is typically lower than the day price action.
The area near 5850 is a key inflection point over the last 2 weeks. For the last week, price bounced off this area higher in the early part of the week. On Friday, price gapped below this area and stopped near the 200 SMA.
In the overnight (Sunday/Monday) action price has moved above this area. It is important to see how price reacts during the daily session to make a determination about entry. Will it now use 5850 as support or will it slice through it again and retest the 200 SMA?

🔍 Key Technical Levels
Wave (1) High: ~5,973
Current Support Zone: ~5,771.88 (marked as DT Support and aligns with breakout zone)
Next Support Level: ~5,702–5,720 (April 30 candle body and top of prior consolidation)
Resistance Zone: ~5,947 to 5,973 (last swing high + SAR resistance)
Parabolic SAR (Bearish): SAR dots have flipped above recent candles, signaling short-term downside bias.
📊 The Volume Profile View
The chart below shows the S&P futures (contract ES) 10 day daily volume profile/market profile chart.
The data aggregation is done in 30 minute periods. The pink line to the left shows the volume POC while the green line to the right shows the POC of time. Volume and time do not always line up to the exact location.
🧭 Context Overview (as of 5/26/2025)
Current Price: 5,872.25
Trend Structure: Consolidation near recent lows after a pullback, attempting to stabilize above gap support
Session Structure: Disjointed and imbalanced profile early in the week; price sitting between major composite POCs
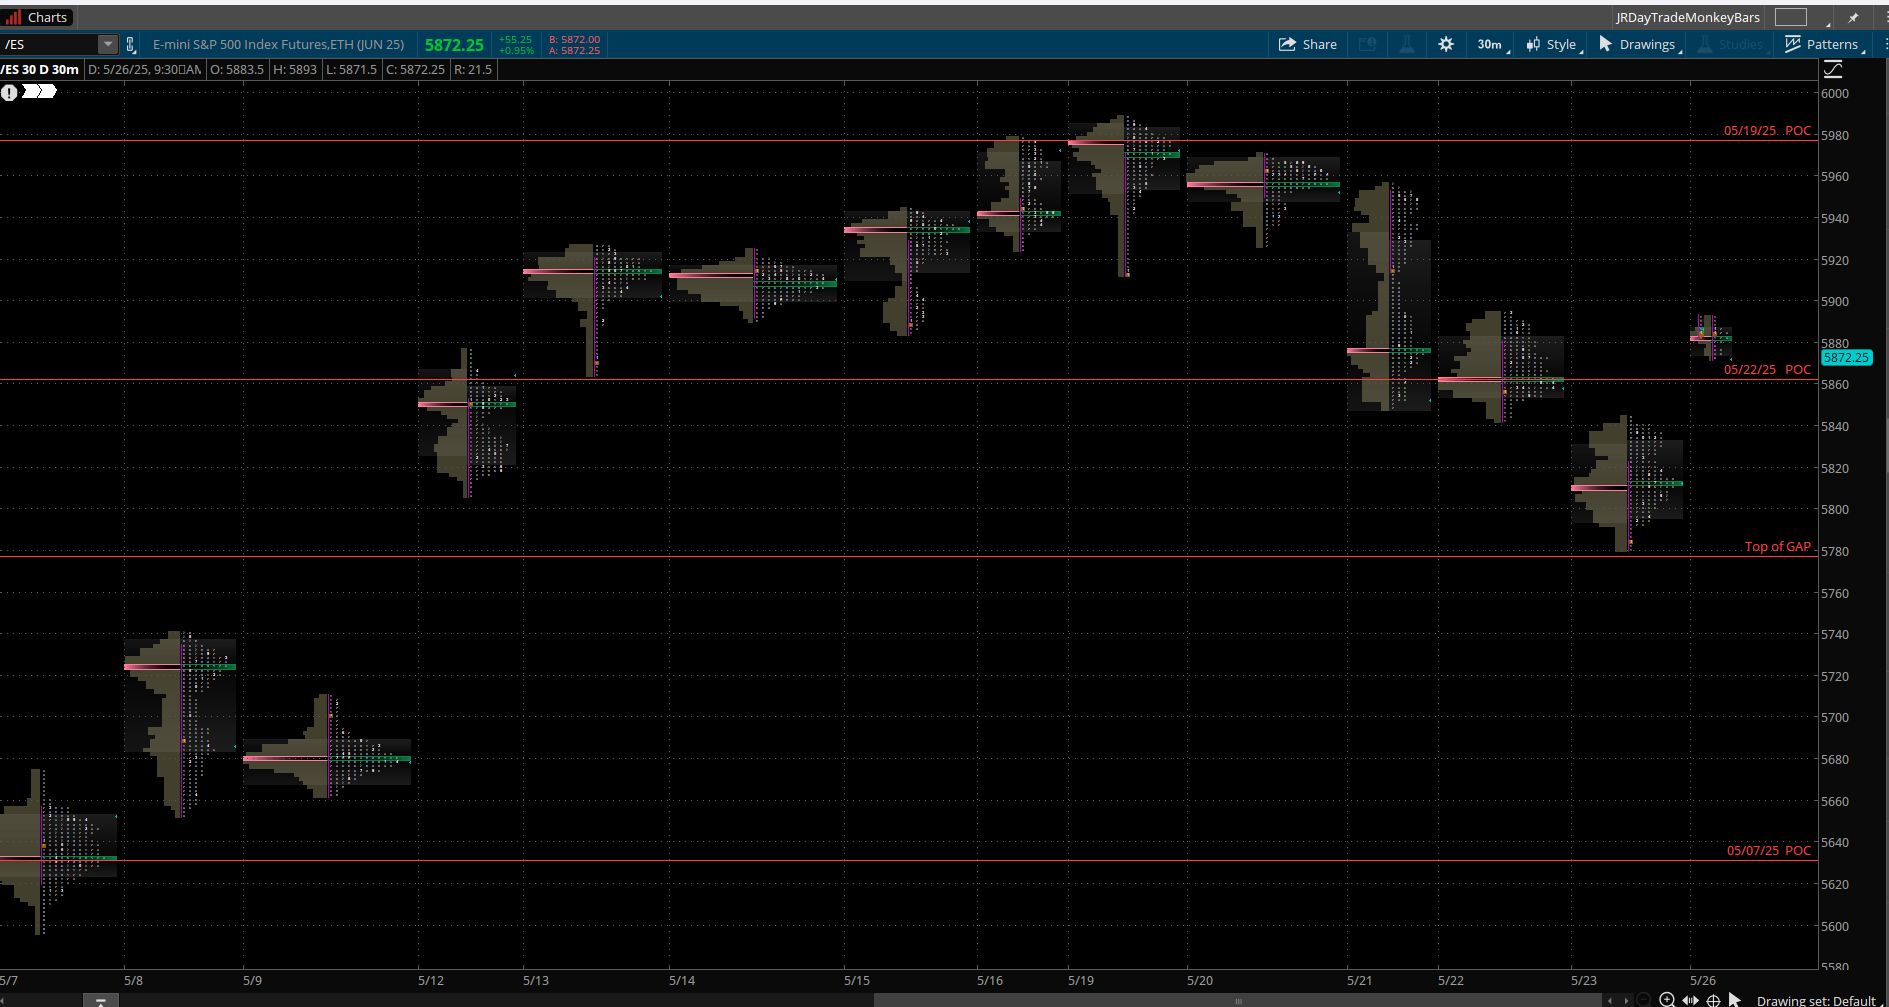
📌 Summary
Market has stabilized above gap support (~5850) and session POC (~5860).
Immediate resistance lies around 5,940–5,980. If the market cannot break higher, expect chop or a move back toward 5,720.
Volume is thin—likely due to the Memorial Day holiday—so caution is warranted on breakout trades without confirmation.
The profile is providing a warning that this gap higher may be bull fake out.
Read about market profile and auction market theory here.
Current Market Outlook Using Sectors
The past week saw broad-based selling across the S&P 500, with all 11 sectors closing in negative territory. The index itself dropped 2.61%, marking a notable reversal after weeks of steady gains. What stands out is the depth and uniformity of the weakness, which often signals a shift in institutional sentiment.
🔻 Key Sector Losses:
Technology (XLK): -3.44%
Consumer Discretionary (XLY): -3.23%
Financials (XLF): -2.99%
These three sectors are among the most heavily weighted in the S&P 500 and are often considered bellwethers for economic growth and risk appetite. Their simultaneous decline suggests a risk-off rotation, possibly driven by:
Valuation concerns in mega-cap tech (especially ahead of Nvidia’s earnings).
Macro uncertainty, including the upcoming PCE inflation data, which may influence rate expectations.
Profit-taking after an extended run-up, particularly in tech and discretionary names.
📉 Implications for the Week Ahead
With major sectors under pressure and upcoming catalysts like Nvidia earnings and the PCE inflation report, the market is entering a highly event-driven environment.
The lack of sector leadership combined with technical weakness (as noted in the S&P 500 stalling near the 200-day SMA) suggests it is prudent to remain cautious until stronger internals or breadth re-emerges.
Watch for:
Signs of rotation back into leadership (e.g., tech or financials stabilizing),
A volatility spike if PCE surprises to the upside,
Or a resumption of upward momentum if Nvidia delivers a blowout quarter.

VIX Chart
The VIX is a number that measures how much people think the S&P 500 will move (up or down) over the next 30 days.
🔄 What is Backwardation in VIX?
Backwardation means:
Spot VIX > VIX Futures (especially 1-month out)
This implies the market expects volatility to decrease in the future, but currently sees significant near-term risk.
📘 What is VIX Contango?
VIX contango happens when:
🔸 The VIX futures prices are above than the current (spot) VIX.
It’s the opposite of backwardation
The chart below shows the VIX futures (June contract).

🔍 Key Observations
1. Volatility Bottoming Attempt
The VIX recently bounced from its lower Bollinger Band, which often marks an area of complacency exhaustion.
This bounce aligns with the market pullback last week (S&P 500 down 2.6%), reinforcing the idea that risk premiums are re-expanding.
2. VIX Still Below Long-Term Median
The 20–21 zone represents a midpoint mean reversion level.
VIX futures must break above 22–23 (R1 and Bollinger mean) to confirm a sustained shift in risk sentiment.
3. Volatility Cycle Behavior
The VIX structure shows repeated V-shape rebounds (e.g., Jan, March, and now May), suggesting traders are buying downside protection only after selloffs begin, not in advance.
This reactive behavior can lead to sharp VIX spikes if downside accelerates without warning.
The MenthorQ SMILE curve
The MenthorQ skew smile curve chart of the S&P 500 cash index.

🧭 Key Observations
Put Skew Remains Elevated
Left side of the curve (lower strikes): IV remains significantly elevated, especially sub-4000 strikes.
The steepness of the left tail reflects strong demand for downside protection.
Today’s smile (green) is above the 5D and 1M curves on the far left — suggesting a recent uptick in put buying, likely in reaction to last week’s broad market weakness.
With Nvidia (NVDA) earnings scheduled for Wednesday evening and the PCE inflation report due Friday, the market is beginning to price in elevated left-tail risk.
This reflects growing concern over potential downside surprises from either a disappointing tech earnings release or hotter-than-expected inflation data—both of which could shift sentiment sharply and increase volatility into week's end.
S&P 500 Term Structure
The chart below shows the $SPX term structure. The green line shows today’s term structure. It is lower compared to the last five days indicating price consolidation.
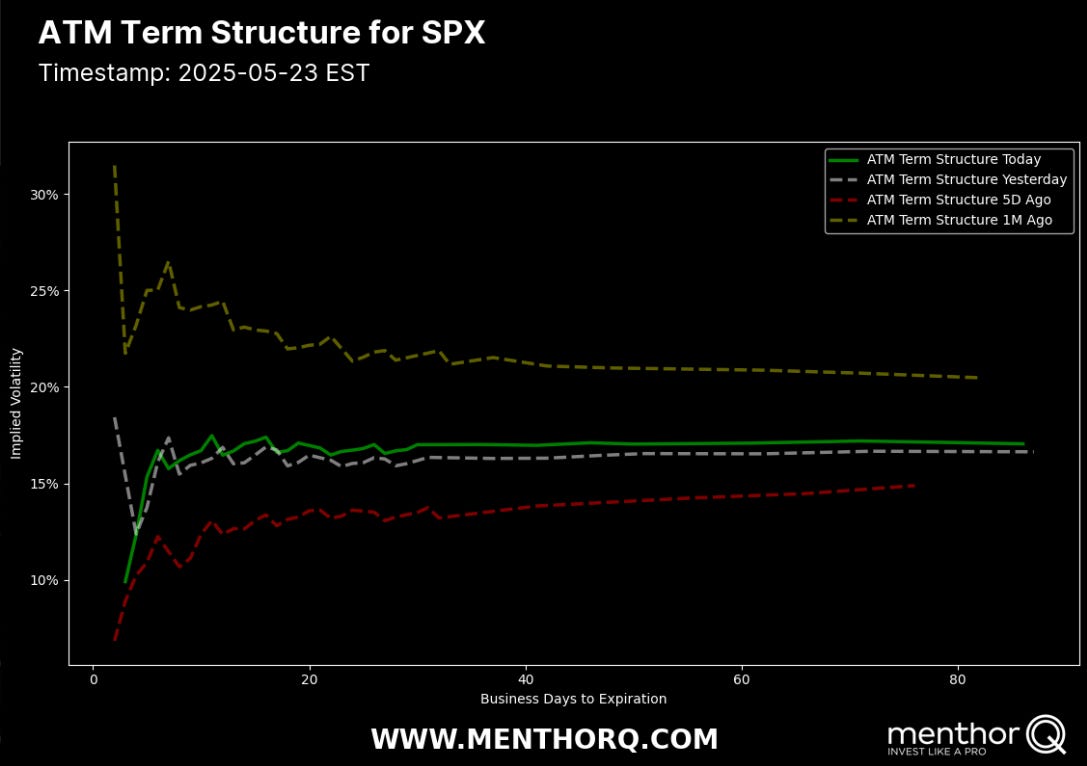
Key Observations
Implied volatility has risen sharply today (green line) compared to 5 days ago (red), reflecting increased market uncertainty.
Today’s curve is slightly elevated vs. yesterday's (gray), especially in the front end—indicating near-term event risk (e.g., NVDA earnings, PCE).
1-month ago (yellow) IV was much higher, especially at the short end, showing how much volatility had compressed before this recent uptick.
The curve is relatively flat beyond 10–15 days, suggesting markets expect near-term turbulence but no long-term volatility shock—a classic left-tail risk structure.
S&P 500 Cash Gamma levels
The chart shows the positioning information over the next couple of weeks. It is heavily skewed to the downside. Currently, the S&P 500 is a negative gamma situation therefore, market makers will trade in the direction of the market.
Key Insights Into End of Week (May 28–31)
Tuesday (5/28) is the most vulnerable day from a gamma perspective — massive negative GEX can trigger wild swings. This day likely sets the tone.
Wednesday (5/29) shows muted gamma, but the market may trade cautiously ahead of NVDA earnings.
Thursday (5/30) sees another wave of negative gamma – especially dangerous if NVDA shocks or fuels large gap movement.
Friday (5/31) is a macro-driven session (PCE), but with reduced gamma, price may become headline-sensitive, not flow-sensitive.
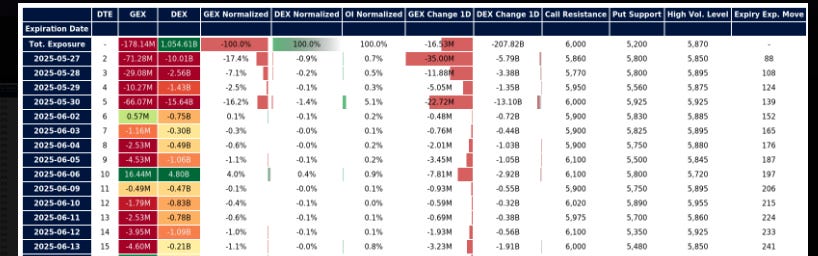
Based on exposure trends and positioning behaviour for this week:
The gamma flip zone likely sits between 5,875 and 5,900
Below 5,875 → dealers are short gamma, increasing volatility and potential for large moves
Above 5,900 → gamma likely neutralizes or turns positive, leading to mean reversion and tighter dealer hedging
Long Term rates (10 year Treasury)
The FOMC cut rates (December 2024) a .25 basis point cut. Rates peaked in the first week of January 2025. The yield is currently at 4.49.
At the most recent meeting FOMC left rates unchanged. The fed-fund watch tool shows that there is a 5% probability that short term rates will get lowered by 25 basis points at the next meeting in June.
I have placed bollinger bands around the price action.

🧭 Risk Sentiment Matrix (Yields vs SPX)
10Y Yield Level SPX Signal Risk Mood
< 4.10% Bullish SPX Goldilocks, Fed in control
4.10–4.40% Neutral chop Confused regime, data-dependent
> 4.50% Bearish SPX Inflation concern, risk-off
Economic Events for the Week
Here are the key economic events for the week of May 27, 2025, all times Eastern.
Tuesday, May 28
Market reopens after Memorial Day holiday
SPX faces largest negative gamma exposure (-70M GEX) of the week
Consumer Confidence (10:00 AM ET)
Treasury auctions: 2-year and 5-year notes
Wednesday, May 29
Nvidia (NVDA) earnings after the bell – major tech/AI sentiment driver
Beige Book (2:00 PM ET) – Fed's economic snapshot
Treasury auction: 7-year notes
SPX maintains moderate negative gamma (-10M GEX)
Thursday, May 30
Second estimate of Q1 GDP growth (8:30 AM ET)
Weekly Initial Jobless Claims (8:30 AM ET)
SPX has another major negative gamma expiry (-66M GEX) – high volatility risk
Potential reaction to NVDA earnings
Friday, May 31
Core PCE Price Index (8:30 AM ET) – Fed’s preferred inflation gauge
Personal Income & Spending (8:30 AM ET)
Chicago PMI (9:45 AM ET)
University of Michigan Consumer Sentiment – final (10:00 AM ET)
SPX options expiry; volatility likely post-data
Rebalancing flows into month-end
NQ Futures Daily Chart
Looking at the QQQs or the Nasdaq100 futures are an important part of my trading plan. The XLK (technology ETF) represents a 33% component of the S&P500. Therefore I use this as an indicator to trade the S&P 500.
When both futures (e.g., S&P 500 and Nasdaq) align in the same direction, the probability of the prevailing price trend continuing increases.
For example, during the rally in early May 2025, both ES (S&P futures) and NQ (Nasdaq futures) moved higher in tandem—confirming bullish momentum and leading to a sustained uptrend across major indices.

⚠️ Key Takeaways
The recovery is strong and momentum is intact, but NQ is approaching major resistance at 22,100–22,200.
Bulls should monitor for potential exhaustion or divergence here.
A break below 20,500 would be a cautionary sign and likely shift short-term control back to the bears.
Key downside risk zones lie at 17,600–17,800 — a break here could trigger a much deeper correction.
The Parabolic SAR dots are currently at or just touching the price candles (21514).
NQ Gamma levels
The chart below shows the positioning information for QQQ.
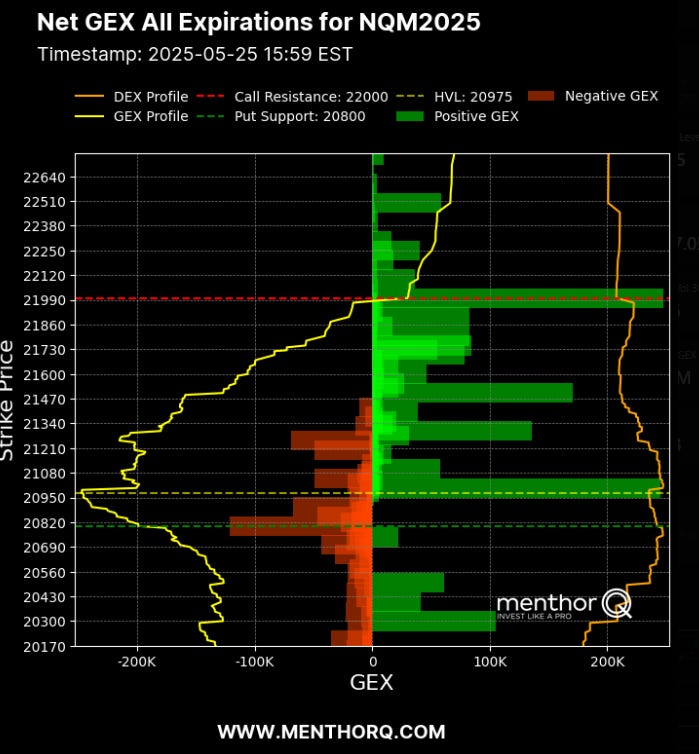
Here is a summary of the GEX levels:
📊Key Points:
High Volatility Level (HVL): 20,975 (yellow dashed line)
Put Support: 20,800 (green dashed line)
Call Resistance: 22,000 (red dashed line)
Largest Positive GEX Cluster: 21,300–21,900
Negative GEX Cluster (short gamma): 20,700–21,000
📈 Bull Case Support (For SPX/NQ)
Price is in Positive Gamma Zone (~21,100–21,900):
This zone is rich in positive GEX, which typically causes mean-reverting, stabilizing behavior as dealers hedge in the opposite direction of price movement.
This reduces volatility and supports a “grind higher” condition.
Put Support at 20,800 Held Firmly:
GEX flips from negative to positive just above 20,800 → a gamma flip zone.
This creates a bullish floor — unless breached, dips are likely to be absorbed.
Upside Room to 22,000 (Call Wall):
With no major GEX cliffs above until 22,000, price could drift higher, pulled toward the large open interest and hedging activity at that resistance.
📉 Bear Case Signals (SPX/NQ Risk)
Overhead Call Wall at 22,000:
A large call resistance zone implies dealers may short futures to hedge, capping price upside unless there's a strong catalyst.
SPX/NQ may stall or reject near this zone without strong macro support (e.g., NVDA beat or soft PCE).
Close to HVL (High Volatility Level):
HVL at 20,975 suggests we are near a sensitivity pivot. If SPX/NQ starts trading below this, gamma becomes more negative again, introducing volatility and directional risk.
Small Negative GEX pocket around 21,000–21,100:
Any sustained move below 21,000 could trigger dealer hedging flows that accelerate downside — especially if macro catalysts disappoint.
🧠 Implications for SPX (Correlation View)
NQ structure is currently supportive of stabilization and moderate upside, and this often translates to constructive conditions for SPX.
However, both indices are approaching gamma-defined ceilings (22,000 in NQ, 5,900–6,000 in SPX), which could trigger dealer selling pressure and choppy price action.
The market is in a fragile bullish posture — constructive as long as SPX holds above 5,800 and NQ above 20,800.
Management of last week’s plan
Last week I was short bull put spreads and they were closed profitably. Currently I am short bull put spreads. I viewed the last week as a consolidation week.
You can review all of my posts here.
The Weekly Plan and trading idea
My general strategy for the current market is limit the weekend exposure to the market. With that being said, I am generally more than 75 percent in cash on any given weekend.
Since the market has become bullish over the last 30 days, i would look for only bullish srategies. I would wait for price to make a small pullback prior to entry. Suggested trade ideas:
bullish put spread capturing 30 percent upon entry. The trade is put on for between 21 - 45 DTE. This is the time where the fastest amount of time decay starts to occur.
bullish diagonal call spread where the longer leg is 60 days out and the shorter leg is 30 days out. The objective is for price to approach the shorter dated option which has a higher delta as compared to the longer dated option.
My strategy also includes trading small as well as different dates of expiration, different strikes and ranges to mitigate risk.
In trading, it is fool hardy to believe that every trade will win. I am mindful of this fact and constantly monitor my risk. I am playing the long game and I understand that losses are part of the game!
As the market has moved into a zone of extreme bullish sentiment, a pullback of 100–150 points was both expected and healthy. Last week delivered that anticipated consolidation move, helping to reset short-term conditions.
If the S&P 500 cash index holds above the 5,800 level, I view this as constructive and supportive of continuing to take on bullish risk, particularly in selective, high-conviction setups.
The signals remain mixed heading into the week. I plan to monitor key levels closely and respond accordingly based on price action. How the market reacts to this week’s key events—such as Nvidia earnings and the PCE report—should offer important clues about the S&P 500’s directional bias in the weeks ahead.
Have a successful trading week.
Let your trade setups come to you—don’t chase. With volatility elevated, remember to size down your trades and always define your risk in advance.
Managing risk is what keeps you in the game; discipline is what makes you profitable.
Gamma Level data (netgex data) and skew data (market sentiment) was provided by menthorQ.com
Presentation on VIX
A few weeks ago I did a presentation on the VIX.
How I trade
I did a number of presentations of my trading process with menthorQ. You can find them here. This is under the highlights section of my “x” account found here.
Follow me on X formerly twitter . I post my market view during the week.
Disclaimer
Please don’t follow my idea(s) blindly. Do your own due dilligence before you attempt to trade. Always manage your risk.
Thank you for reading my weekly plan.
Joel