


Weekly Plan for Novemeber 3
S&P 500 had it's second down week in the last eight weeks. Will we see a third consecutive down week? I discuss my weekly plan for trading the market with an actionable idea.

Summary
The S&P 500 futures dropped approximately 2% last week. In last week’s post I described why there were high odds of a continued decline. You can read it here.
For this week, I see potential S&P prices continue its move downward. On Friday the S&P 500 opened strong and closed week. This is bearish price action.
S&P 500 Futures Daily
This is a daily chart of the futures. I have highlighted the tail on the daily chart as well as a potential stopping zone. The rectangle zone was an area which peaked September 3 and broke through higher September 19. The price zone is 5675 — 5685. I expect this zone to get retested. Initially, I expect a reaction for price to bounce higher from this zone.

S&P 500 Futures Weekly
The weekly trend from from 4/19 was extended approximately 11% above the weekly trend two weeks ago. In August this trendline was hit, then proceeded to make new highs in September and October. The price action for the week was weak. It opened at the high of the week and closed near the weekly low.

S&P 500 Futures Monthly
In August price action retraced to the trendline. If price action performs in a similar manner than I expect price to move 5.5% lower to 5420 hitting a higher price on the trendline. This is annotated below.

Note, that the price action does not have to go to the trendlines. These are potential targets as I navigate through the daily/weekly price action.
The chart below shows the S&P futures volume profile over the last fourteen days. Volume profile shows price volume by time.
The highlighted pink line is the point of control and represents where the largest volume was traded over the day. Price was in balance, meaning range bound for most of this period.
On Thursday, price broke through the balance area lower. I have highlighted area showing the S&P futures gapping lower. Price has now found a new two day balance area lower. Notice that the point of control is nearly identical for the last two days.
Thursday action showed a poor low, meaning multiple periods touched the same price point. This is a sign post that price will break lower at some point in the future.
Also, note that Thursday action showed a selling tail. This is an area where price continued lower without backfilling.
If price moves above the highlighted yellow rectangle into the balance area above, then I view that the bearish action has stalled, and would look for bullish price action.
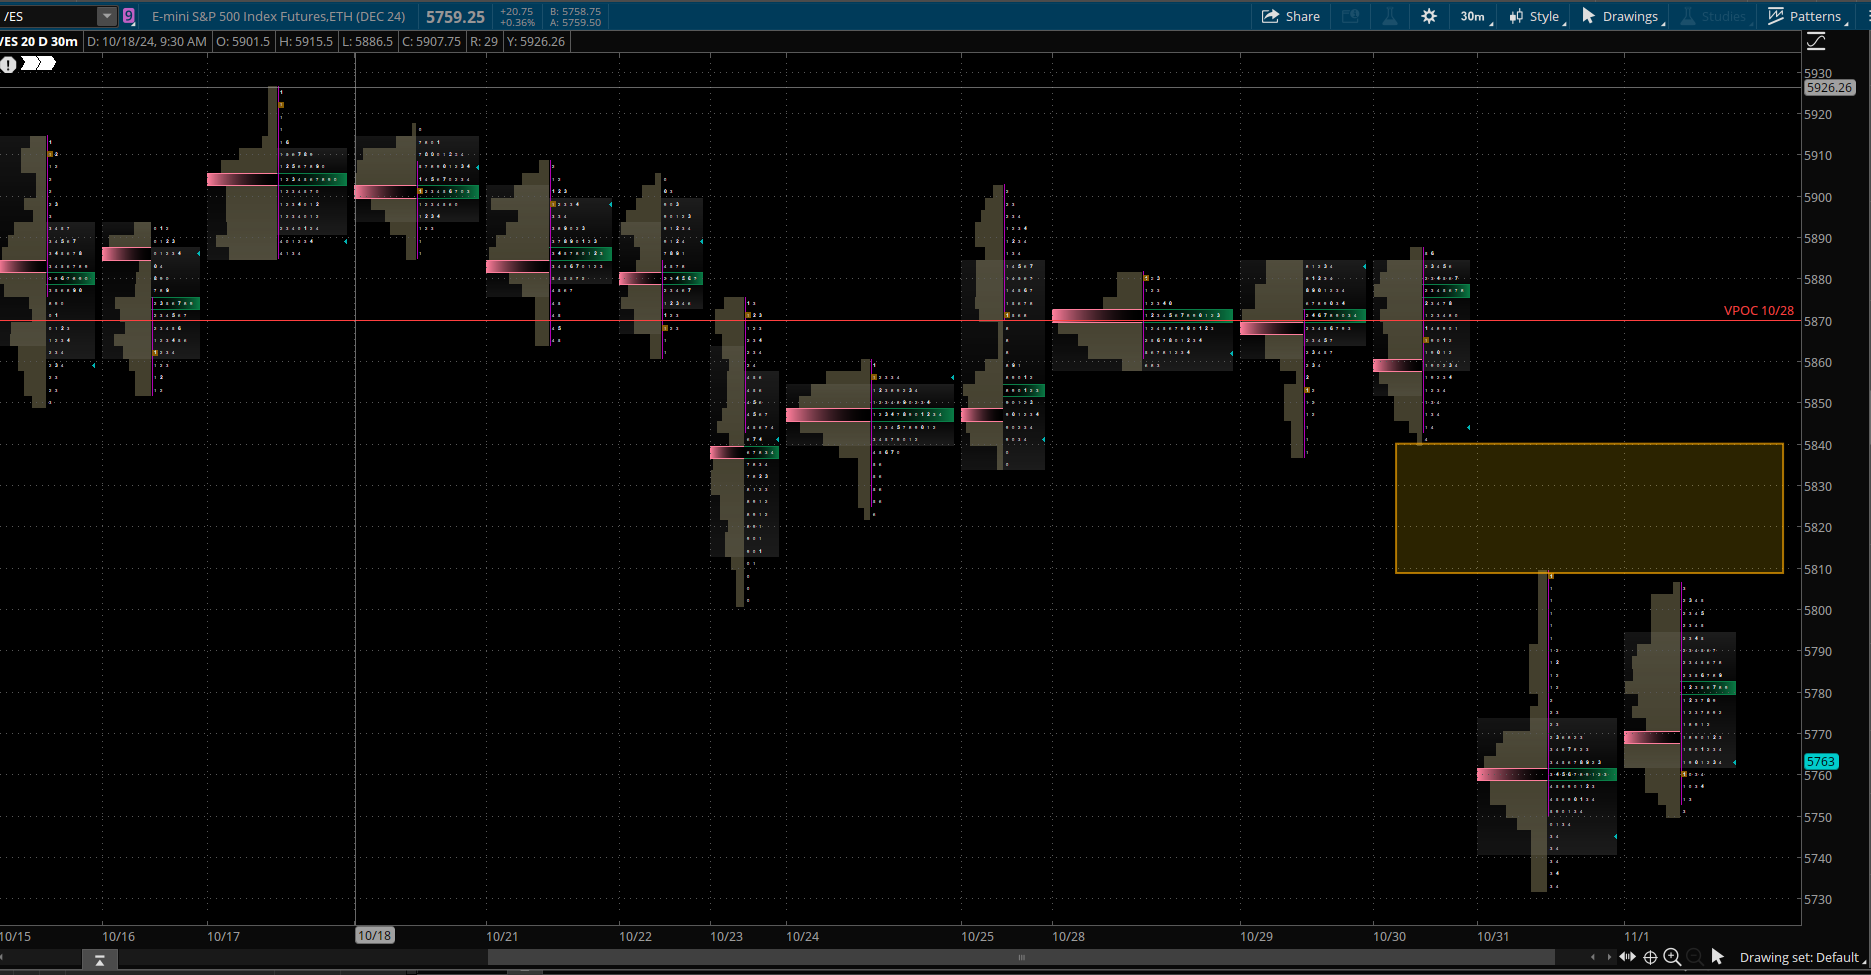
If the index continues its decent, then 5680 could be an area to take profit. If price falls lower, then 5640 is another potential target ( 20 day simple moving average).

Ultimately, if these levels are hit, I would view them as good levels to buy the market.
The U.S. market has a number of catalysts this week, therefore there is a lot of opportunity for volatility.
The market maker implied move for the S&P futures this week is +/- 152 points.
Market sentiment has moved to the neutral area, however it did move lower from greed to neutral based on the CNN Fear & Greed Index in the last week.

US Market Moving Events
For the week of November, 2024, several significant events could impact the U.S. stock market:
Federal Reserve Meeting: According to Fed Watch the market is pricing a 25 basis point rate cut this week.
Upcoming Elections: The US presedential election.
9 Day Vix
Chart of the current day 9 day vix price of the S&P 500. This volatility index broke upwards out of a consolidation last week. This correlates with a higher market maker projected move as compared to the previous week. This implies greater volatility and but does NOT indicate price direction.

S&P futures Daily chart
I have highlighted key support/resistance levels on the daily chart below:

S&P futures Weekly chart
I have highlighted key support/resistance levels on the weekly S&P chart.

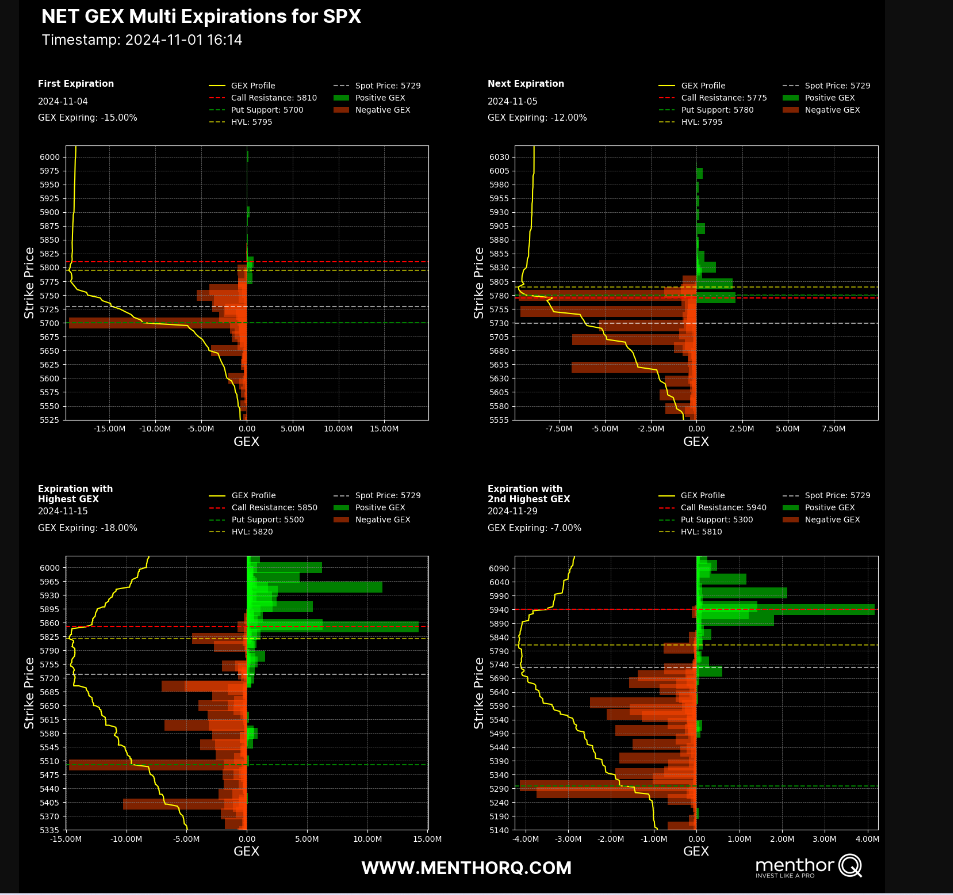
S&P 500 Cash Gamma levels
For next week market participants are mostly bearish. 5780 - 5790 is the area where the goes from bearish to bullish.
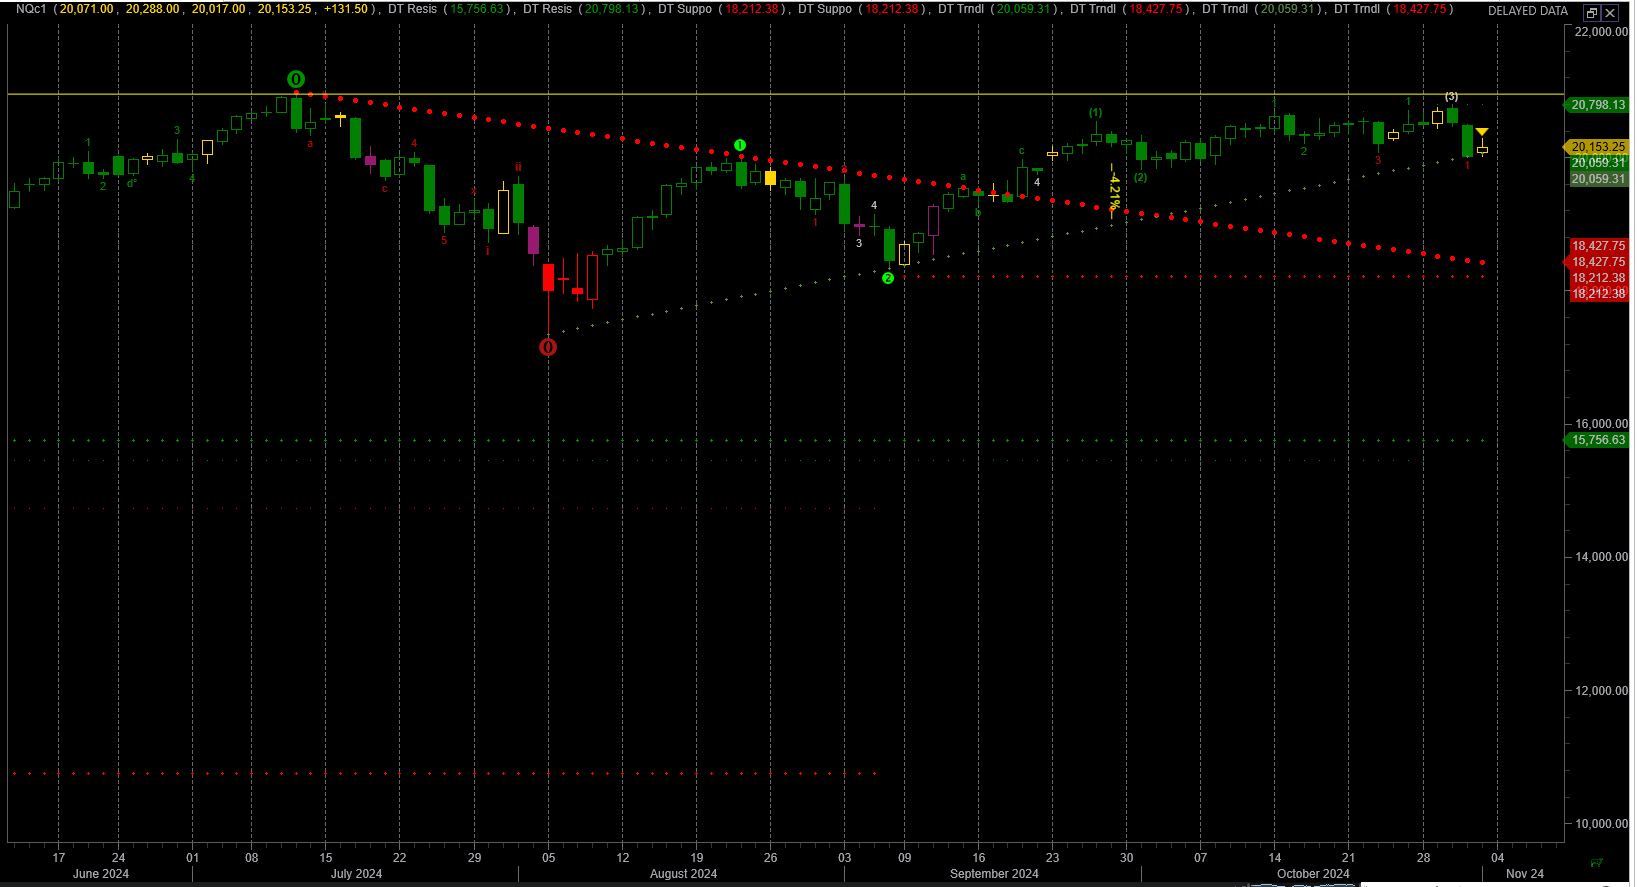
NQ futures daily Chart
The NQ futures are currently resting on a support zone. Earlier in the week I expect the NQ to bounce higher. Currently this support is 20150.

The futures are sitting on the trendline drawn from 8/6/2024. There was a touch on 9/6.
NQ futures Daily Trend chart
The nazdaq 100 futures continue weaken as demonstrated by the weekly trend strength. The trend strength is 23 and weakening. Generally a market is considered trending when the ADX is above 20.

NQ futures Weekly Trend chartly

The Average Directional Index (ADX) is a tool used in technical analysis to measure the strength of a trend in the stock market, regardless of its direction. Here’s a simplified explanation:
What it does: ADX doesn’t tell you whether the market is going up or down, but it helps determine how strong the current trend is. A high ADX value indicates a strong trend, while a low value suggests the market is moving sideways or without a clear direction.
How it works: The ADX typically moves between 0 and 100:
Below 20: The market is not trending (sideways or weak trend).
Above 25: A trend is starting to develop.
Above 50: The trend is very strong, whether it’s up or down.
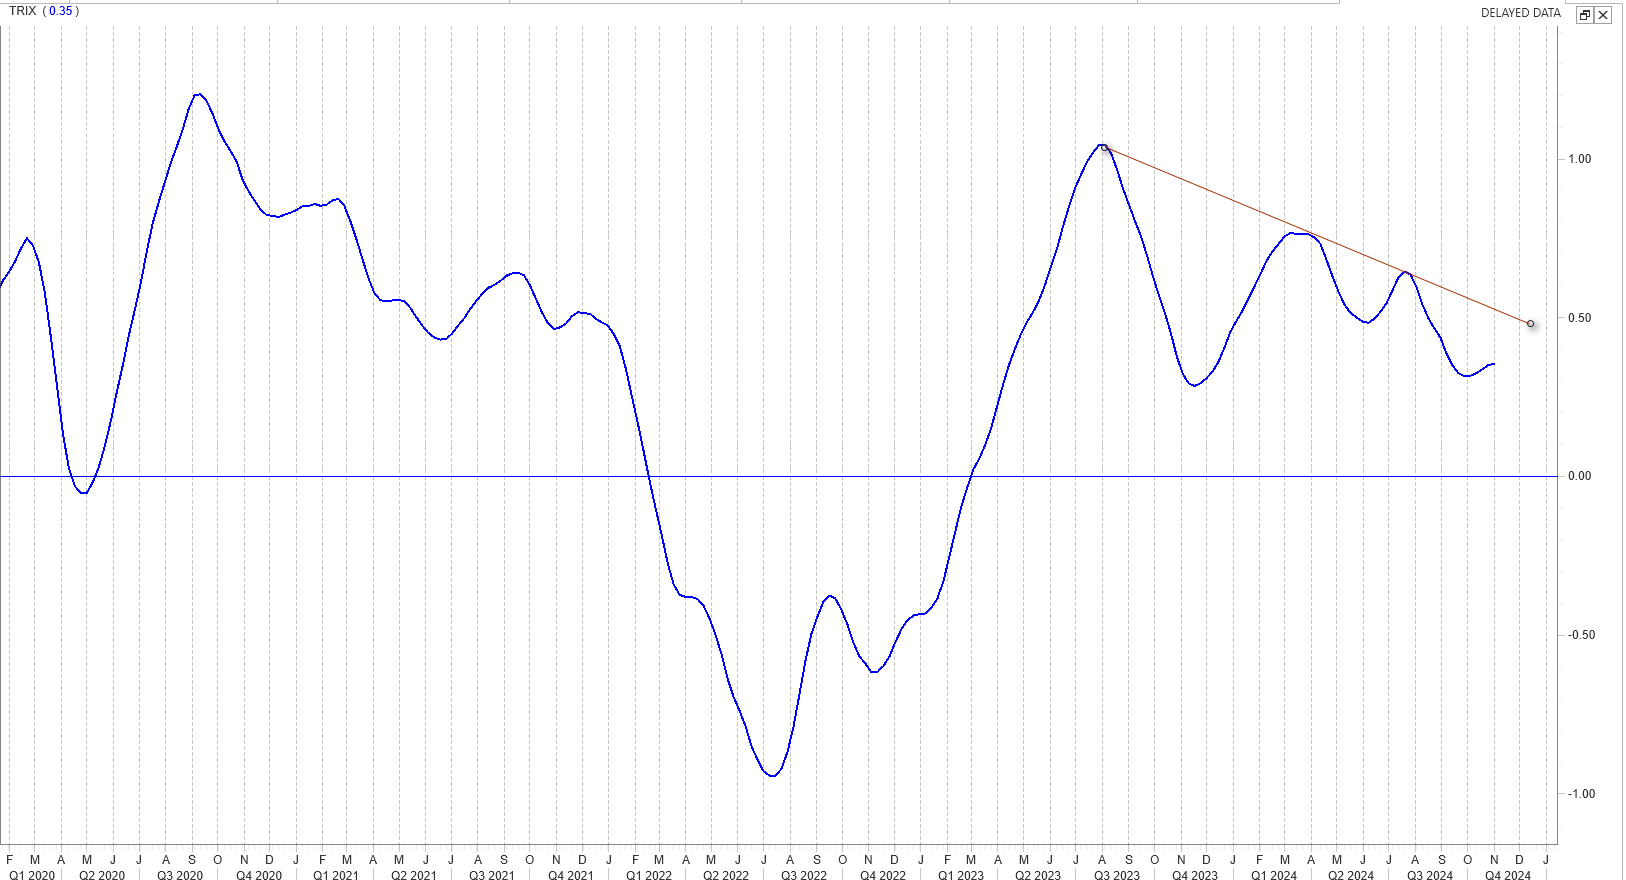
I primarily trade SPX (S&P 500 cash index). Since the Nasdaz 100 represents 30% of the S&P 500, I view it as an important influence on the direction and or movement in the S&P 500.
The chart below represents the TRIX. This is a momentum indicator. We can observe that the momentum has started increasing to the upside. It is noteworthy that the momentum is making lower highs. A trendline is drawn showing this point. The last peak was in July 2024. This also was the peak for the nazdaq futures.
The Weekly Plan
The S&P 500 had its second declining week. For the week I will remain bearish the S&P. I will look to sell call spreads above 5900, on any move the S&P moves higher. I believe the index may move higher earlier in the week as the Nazdaq is resting on a support level.
Overall, I view that the market will stay in a range and wait for the catalysts of the US election and Federal Reserve interest rate announcement on interest rates.
Sample Weekly Idea
The S&P futures are approximately 40 points higher than the S&P 500 cash index. My trade for the week is in the S&P 500 cash index.
Last week I also had a bearish put spread. This spread was monetiezed on 10/31, the day S&P declined approximately 90 points.
On Friday, I placed a simlar spread as the previous week. That is long dated Bear Put spread put spread (5800/5700) on the S&P index.
As noted above, the market opened strong on Friday(11/1) and sold off. This is bearish.
The current market trend is still long term bullish(price above 50 day SMA), however it remains below short term moving averages. That is the daily 5 day SMA and 8 day SMA and 20 SMA.
Have a successful trading week, by waiting for your trade setups to come to you.
Thank you for reading my weekly plan.
Gamma Level data (netgex data) was provided by menthorQ.com
Disclaimer
Trading involves Risk. Please don’t follow my idea blindly. Do your own due dilligence before you attempt to trade.
Always manage your risk.
Joel
