Weekly Plan for October 20
S&P 500 continues its upward ascent. It has made six weekly marginally higher highs. Will we see the seventh closing positive week?

Summary
The week ending October 18 saw the S&P 500 making an excess high on Thursday. This implies that up auction in the S&P 500 has ended and a new downward leg has comenced. The excess high is demonstrated with a long leg with no back-filling upwards. I have highlighted the area.
There is no universal probability model for predicting the exact outcome of an excess high, however traders often assess probabilities based on this analysis as well as using price action. For confirmation, i would look for price to move below Friday’s low. It is noteworthy to point out that both Friday’s and Thursday’s low is 5886.

I am thinking in terms of probabilities. The S&P 500 has done the following:
Made 6 weekly closing highs
A large volume of instutional ownership was closed this past Friday. This was 400 million net GEX. In order to put this in perspective, 39 million net GEX is set to expire this Friday October 25. In other words last week’s bullish influence was a 10 to 1 factor of ownership as compared to this Friday’s expiration in the S&P 500 cash index.
In simple terms, GEX helps explain how the actions of market makers in the options market can either reduce or increase stock price volatility, depending on the exposure level. It’s like a feedback loop that can either smooth out market movements or amplify them.
Large companies are in black-out period for stock buy backs. This will continue as follows:
Start of blackout: Around October 1, 2024.
End of blackout: Varies, but likely ends by late October to early November 2024, depending on individual companies' earnings release schedules.
CNN Fear & Greed Index is showing extreme greed. When most people are extremely greedy, it is perhaps the most likely time for the market to fall.

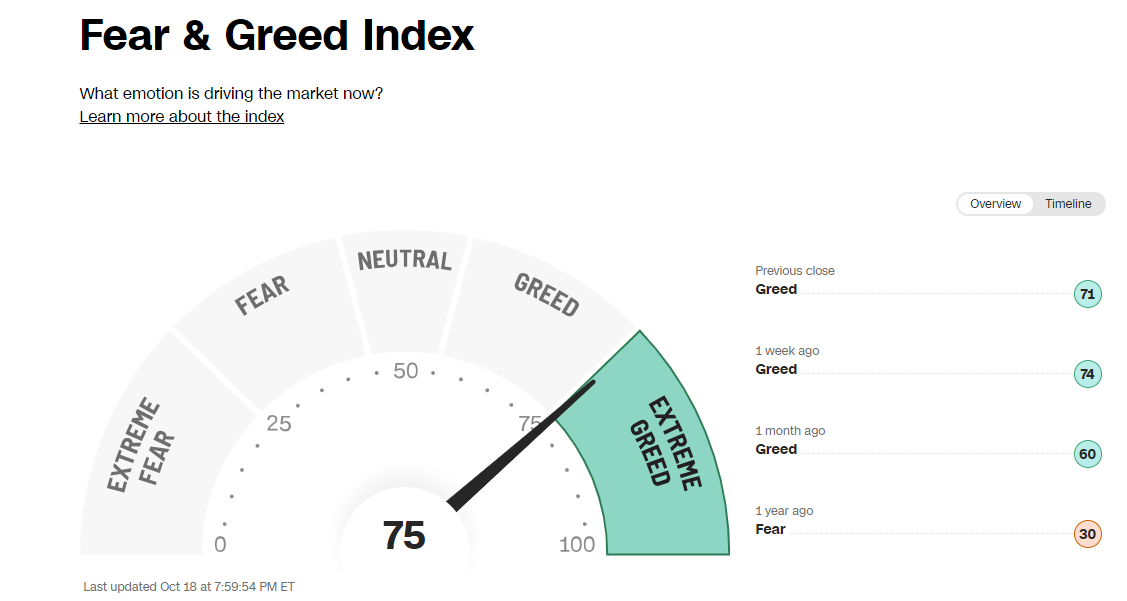
I am not calling for the end of the bull market, however a pause or a 4% to 5% decline is highly plausable.
US Market Moving Events
For the week of October 20, 2024, several significant events could impact the U.S. stock market:
FOMC Member Speeches: Several key members of the Federal Reserve's Federal Open Market Committee (FOMC), including Neel Kashkari, Logan, Schmid, and Daly, are scheduled to speak throughout the week. Their remarks could provide insights into the Fed's thinking on inflation, interest rates, and the overall direction of monetary policy.
Corporate Earnings Reports:
October 22: General Electric (GE), Danaher Corporation (DHR), and Philip Morris International (PM)
October 23: Tesla (TSLA), Coca-Cola (KO), and T-Mobile (TMUS)
October 24: S&P Global (SPGI), Union Pacific (UNP), and Honeywell (HON)
October 25: Unilever (UL), Sanofi (SNY), and HCA Healthcare (HCA)
October 29: Alphabet (GOOGL), Visa (V), and Advanced Micro Devices (AMD)
S&P futures Contract Chart
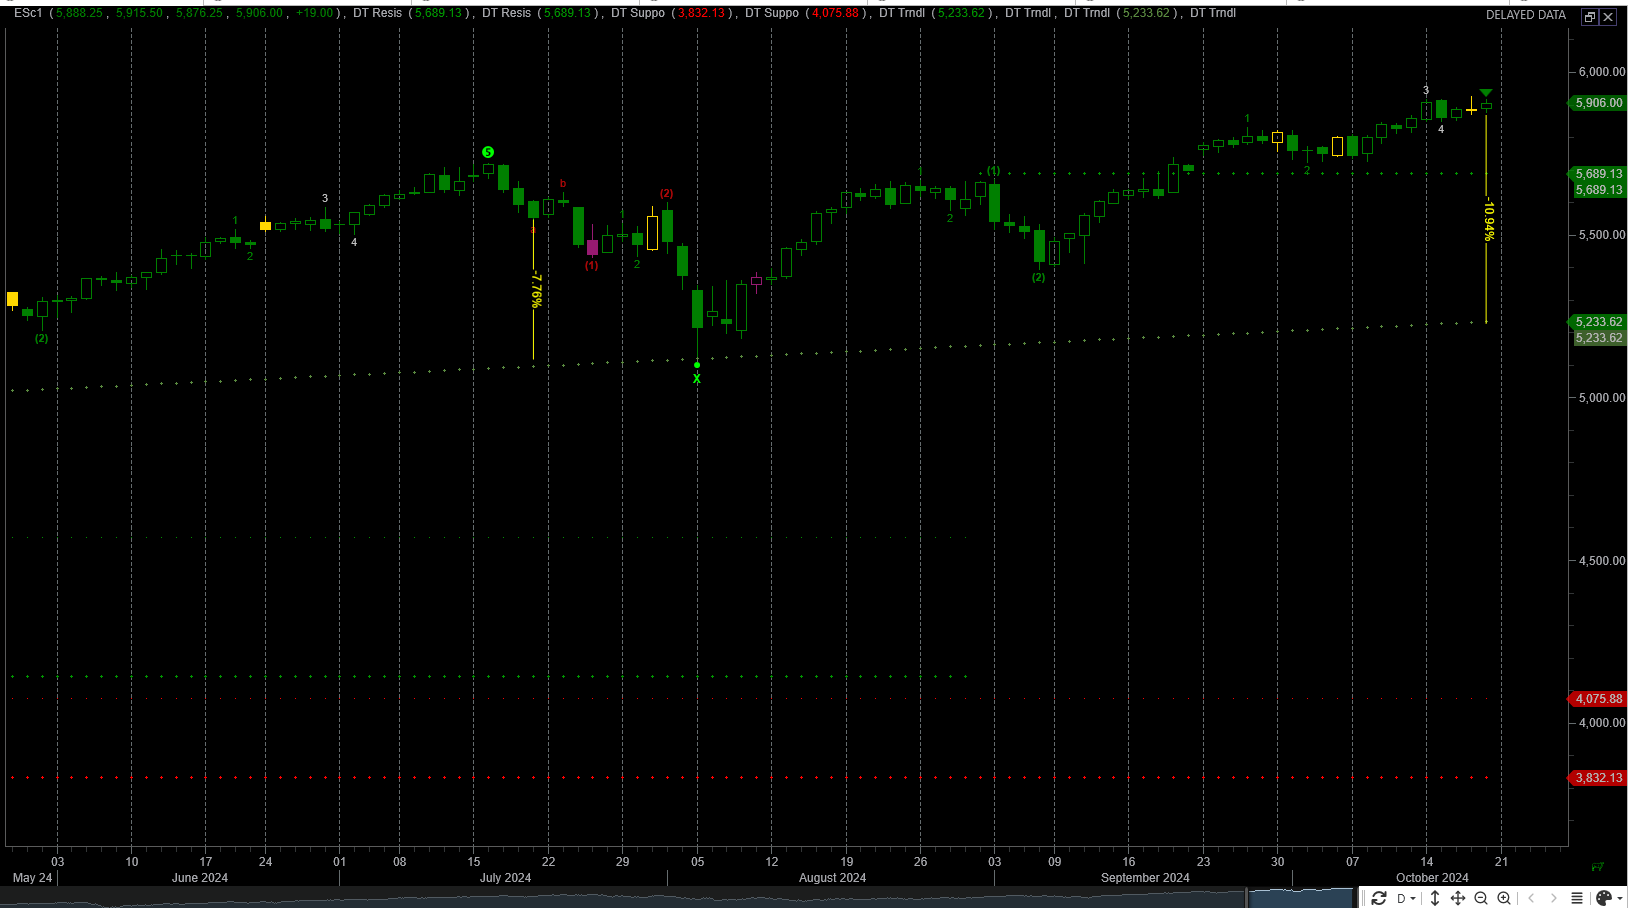
Daily Chart of S&P Futures
The price action over the past few weeks shows the S&P making marginally higher highs. This past week was another example of marginally higher high.
The S&P 500 is not overtly extended over trend can expect higher prices for the week.
The market maker implied move for the week is +/- 90 points.
S&P futures Daily chart
I have highlighted key support resistance levels on the chart below:
My Potential Bullish targets:
5918. This was the most recent weekly high.
5953
5978
5997
The levels calculated for item 2 - 5 were generated using Fibonacci extensions
My potential bearish targets are:
5887
5855
5818
5820
The bearish targets are calculated based on support and resistance levels.

S&P futures Weekly chart
In August the S&P futures touched the it’s weekly trendline. It was extended approximately 9.5% prior to reverting to the weekly trend. Currently the S&P is extended by 11%.
NQ futures Chart
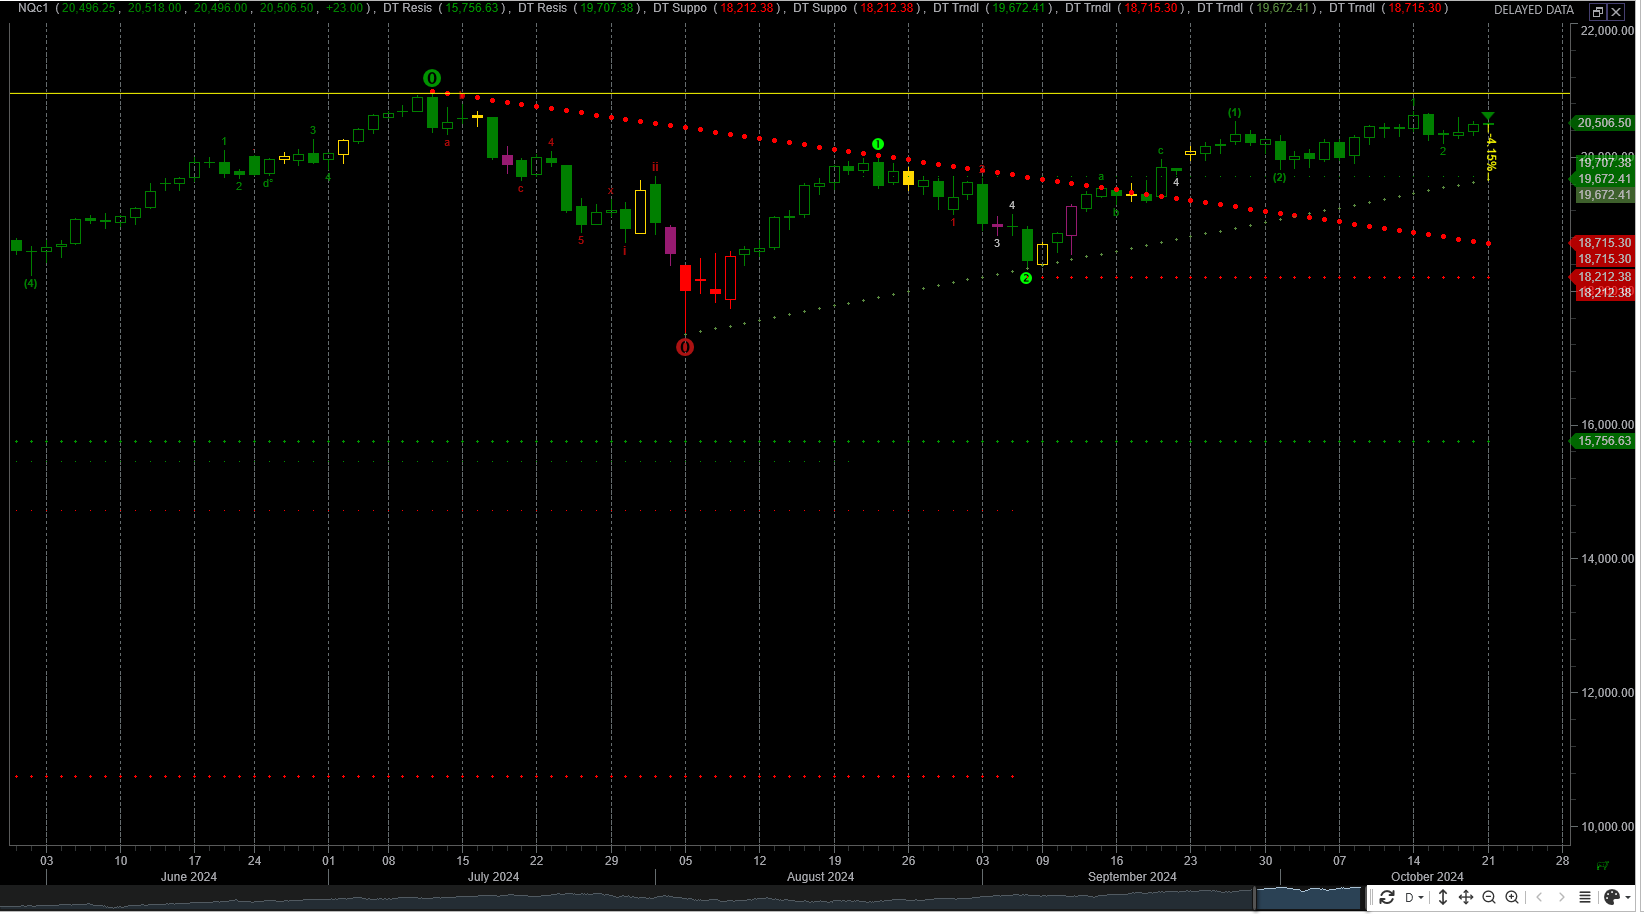
The NQ futures are close to a previous high made in July 2024. Currently the price is approximately 400 points below this high.
NQ futures Daily chart
The nazdaq 100 futures continue weaken as demonstrated by the weekly trend strength. The trend strength is 15. Generally a market is considered trending when the ADX is above 20.
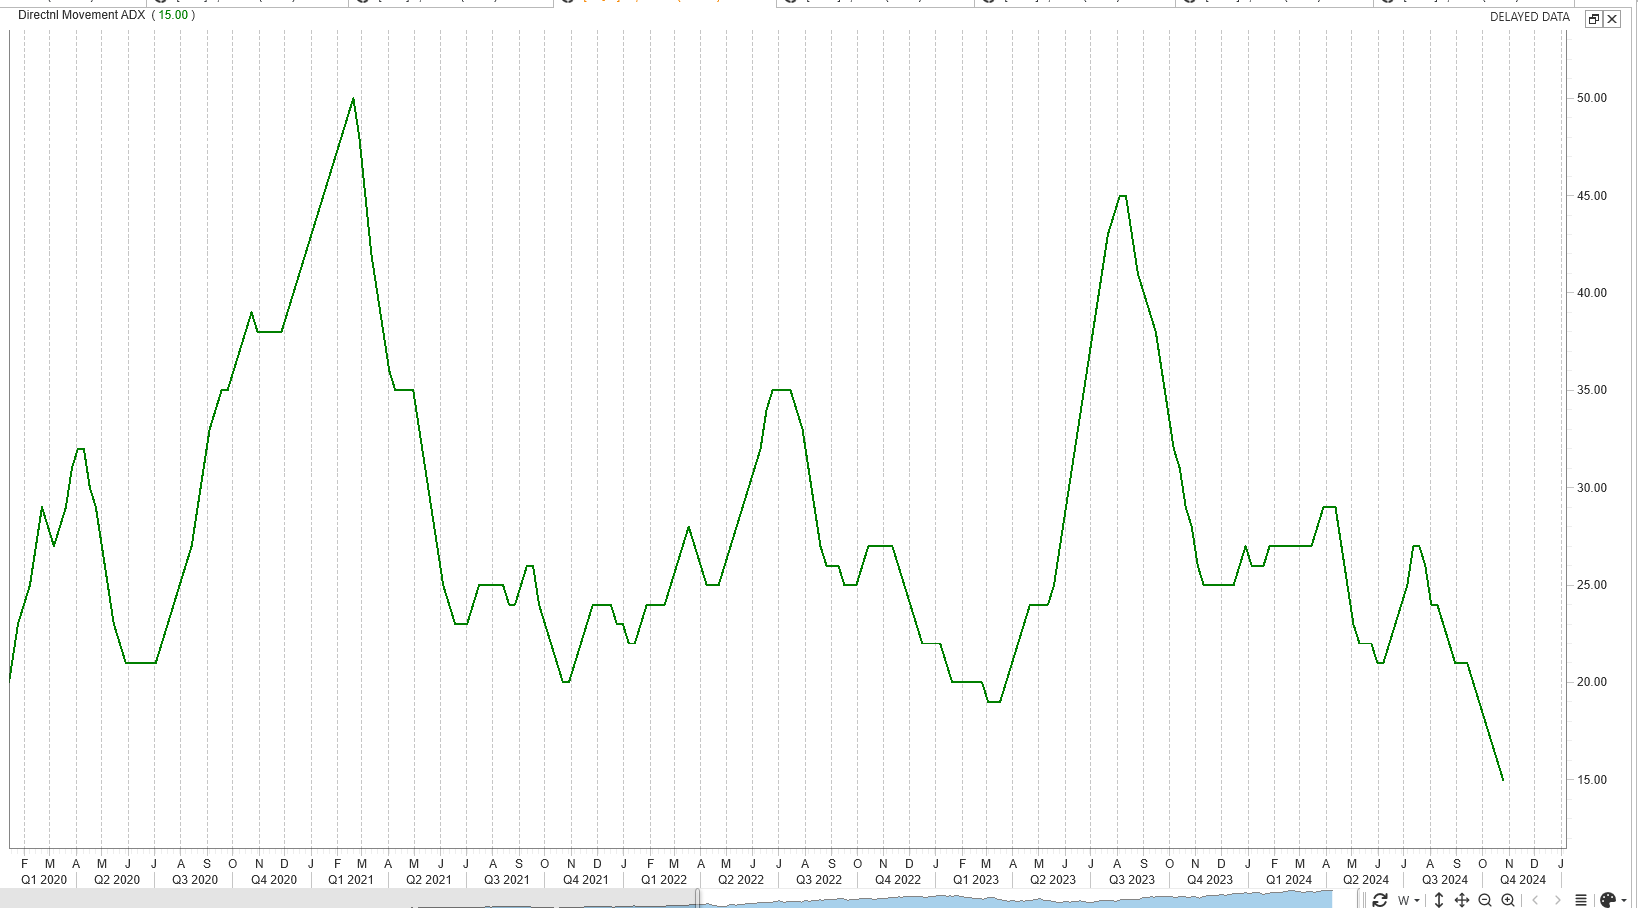
The Average Directional Index (ADX) is a tool used in technical analysis to measure the strength of a trend in the stock market, regardless of its direction. Here’s a simplified explanation:
What it does: ADX doesn’t tell you whether the market is going up or down, but it helps determine how strong the current trend is. A high ADX value indicates a strong trend, while a low value suggests the market is moving sideways or without a clear direction.
How it works: The ADX typically moves between 0 and 100:
Below 20: The market is not trending (sideways or weak trend).
Above 25: A trend is starting to develop.
Above 50: The trend is very strong, whether it’s up or down.
The nazdaq 100 is approximately 4% above the daily trendline. It is not marginally extended and is still approaching a new high.
NQ futures Weekly chart
The weekly price action shows that price has been in a range for the past few weeks. This is highlighted by the rectangle. I have also highlighted the all time high made in July 2024. This is the yellow horizontal yellow line.

The Weekly Plan
The S&P has closed higher 10 out of the last 11 weeks. As long as the S&P futures remain above 5665 this is a continued bullish trend.
Good Luck, stay safe and have a successful trading week.
Thank you for reading my weekly plan.
Sample Weekly Idea
The S&P futures are approximately 50 points higher than the S&P 500 cash index. My trade for the week is in the S&P 500 cash index.
For the week, I have a long Bear Put spread in S&P cash index between 5440/5430. For a later dated period I have a 5800/5700 Bear Put Spread in the S&P cash index.
Although, the current market trend is still bullish as it remains above the daily 5 day SMA, 8 day SMA, and 20 day SMA, I believe we are primed for the S&P price to revert to the mean. I have outlined my thesis above.
This is a hedging strategy for the current week.
Disclaimer
Trading involves Risk. Please don’t follow my idea blindly. Do your own due dilligence before you attempt to trade.
Joel