Weekly Plan for September 15
If you were sleeping for the last two weeks then you would have observed that the market remained unchanged. It did move down and up approximately 4%. I am providing my trading plan for this week.

Summary
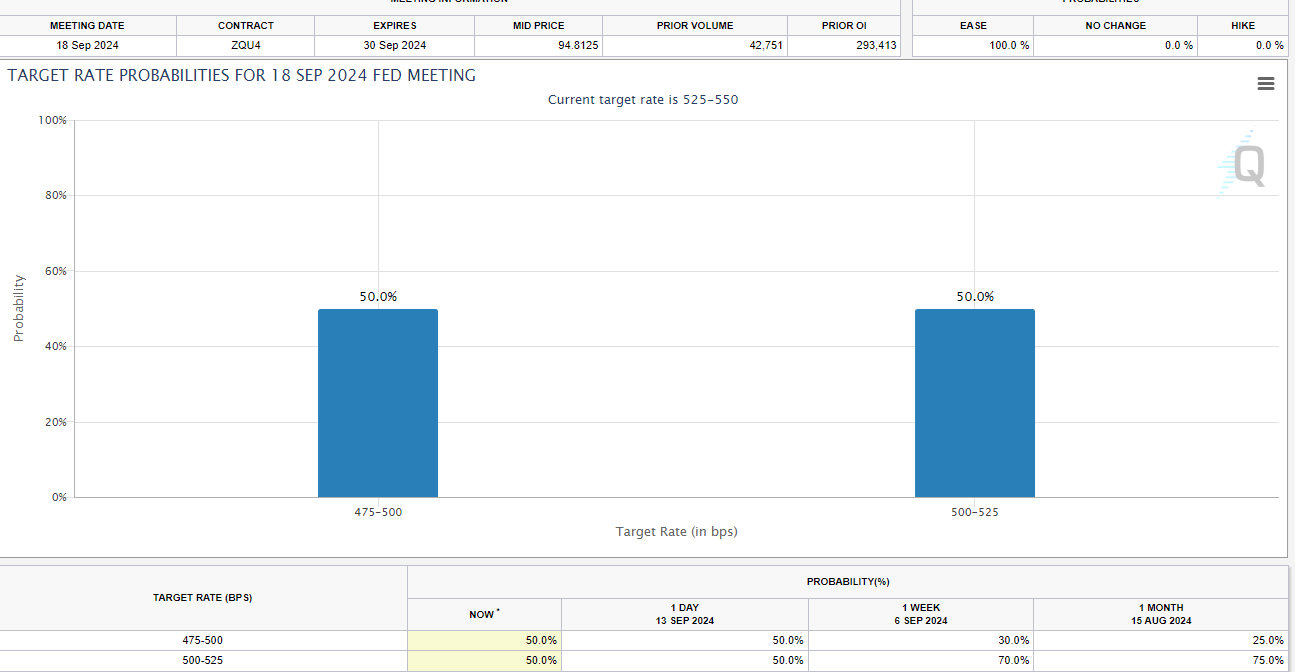
The S&P moved 200 points down followed by 200 points up within a two week period. A lot of volatility but it went nowhere. It is now a short distance to new all time highs. The main event for the week is the federal reserve meeting held this Wednesday afternoon. The expectation is that rates will move down. Will it be .25 basis points or .50 basis points?
According to Fed Watch tool it is 50/50 bet that rates will move down either .25 or .50 basis points.
S&P futures Chart
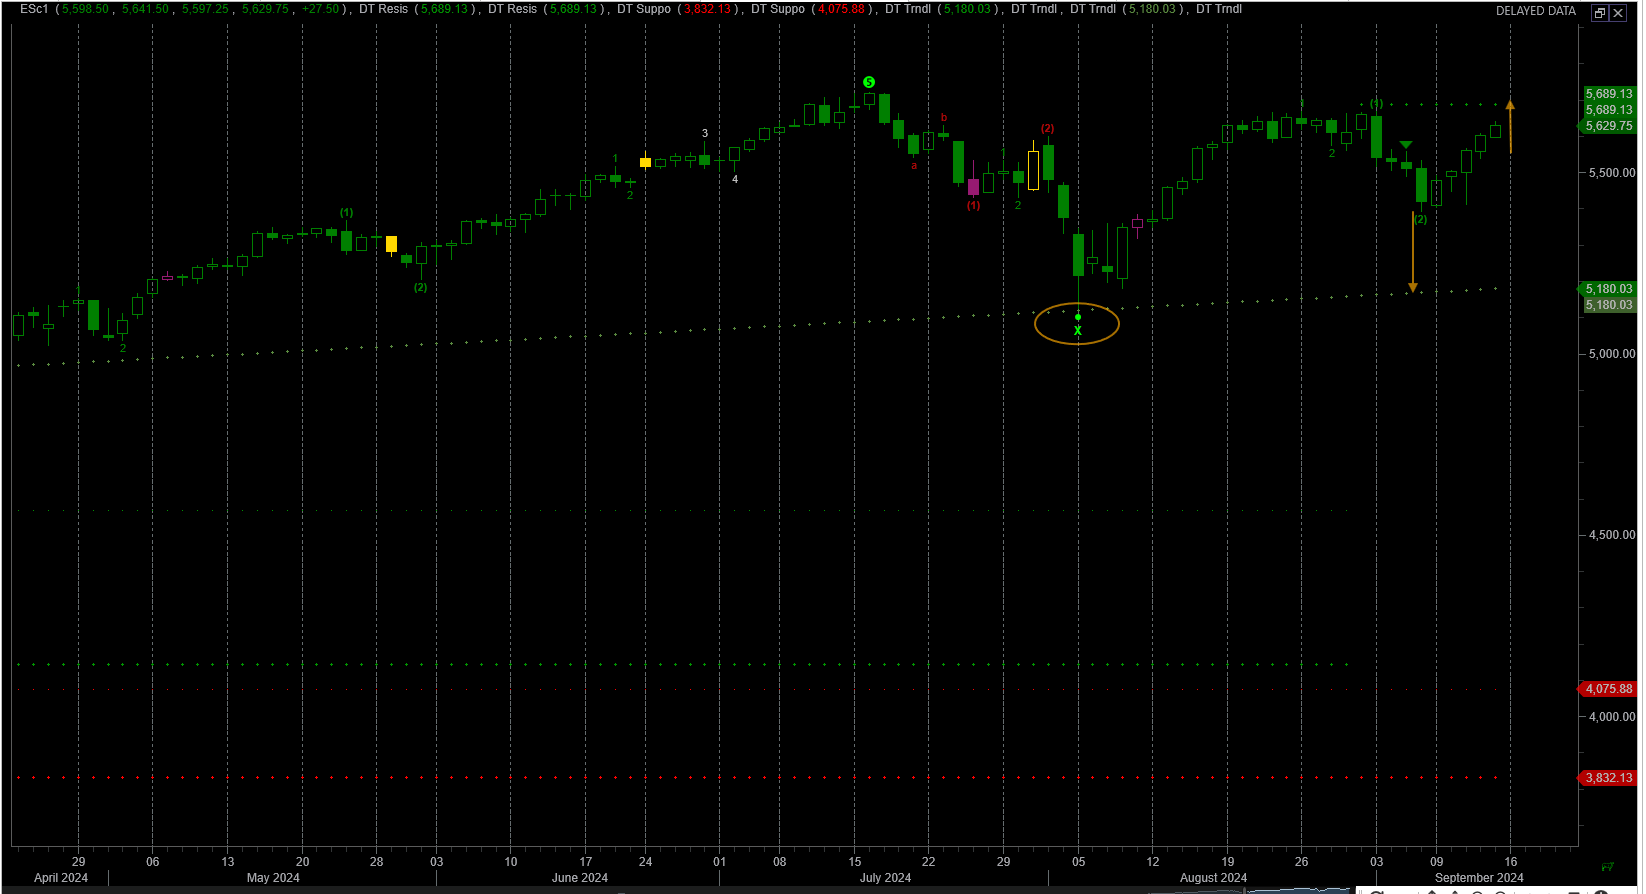
The S&P futures rose each day of last week.
The arrow on the chart points to the previous high on the S&P 500. I expect it hit this target and potentially even exceed this area. Another point is that the most recent low on the chart is higher than the previous swing low. The three points of interest have been highlighted on the chart below.
The S&P had a massive short squeeze last Wednesday. It moved down 80 points from the open to the low of the day. It was then followed by a 135 points up move from the low to the high.
Daily Chart of S&P Futures
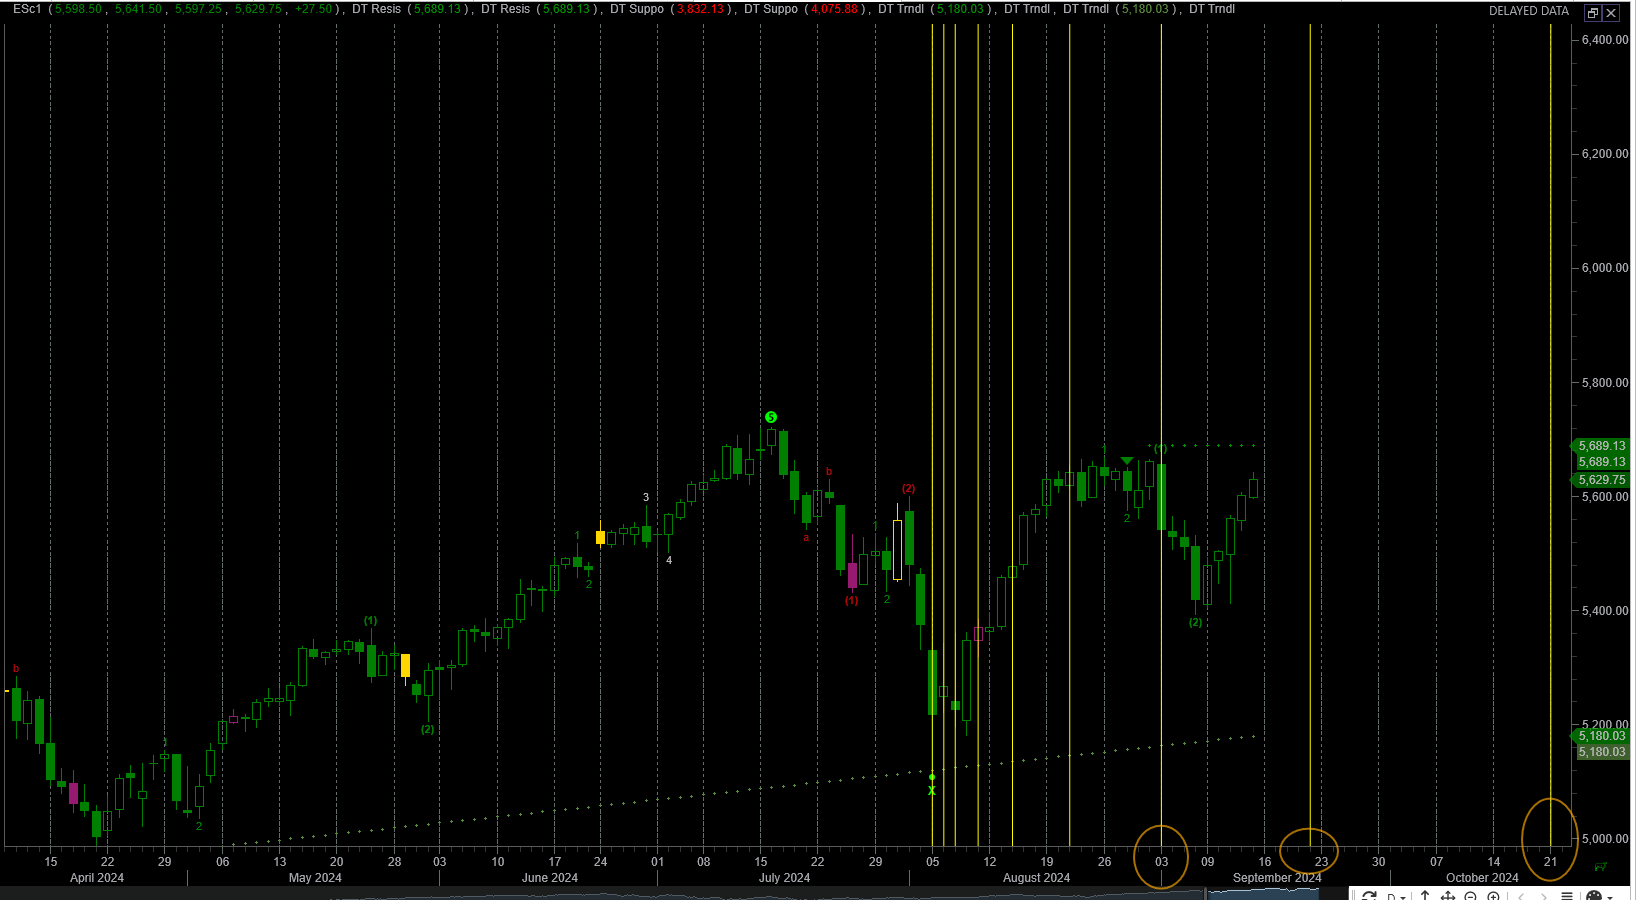
With the same daily chart, I have added a Fibonocci projection, for the S&P 500. I believe it can go anywhere from 5767 to 6045 before the next down move commences.
I believe it will hit this price over the coming weeks.

Using Fibonocci timezones on the chart below i am projecting potential significant events occuring. The starting place of the time projection was on August 5. This date marked a significant low and outlier volatility.
Date projections for example:
9/3 coincides with the start of the most recent downdraft.
Both 9/20 and 10/21 show as potential significant events.
All the events are highlighted below.
NQ futures Chart
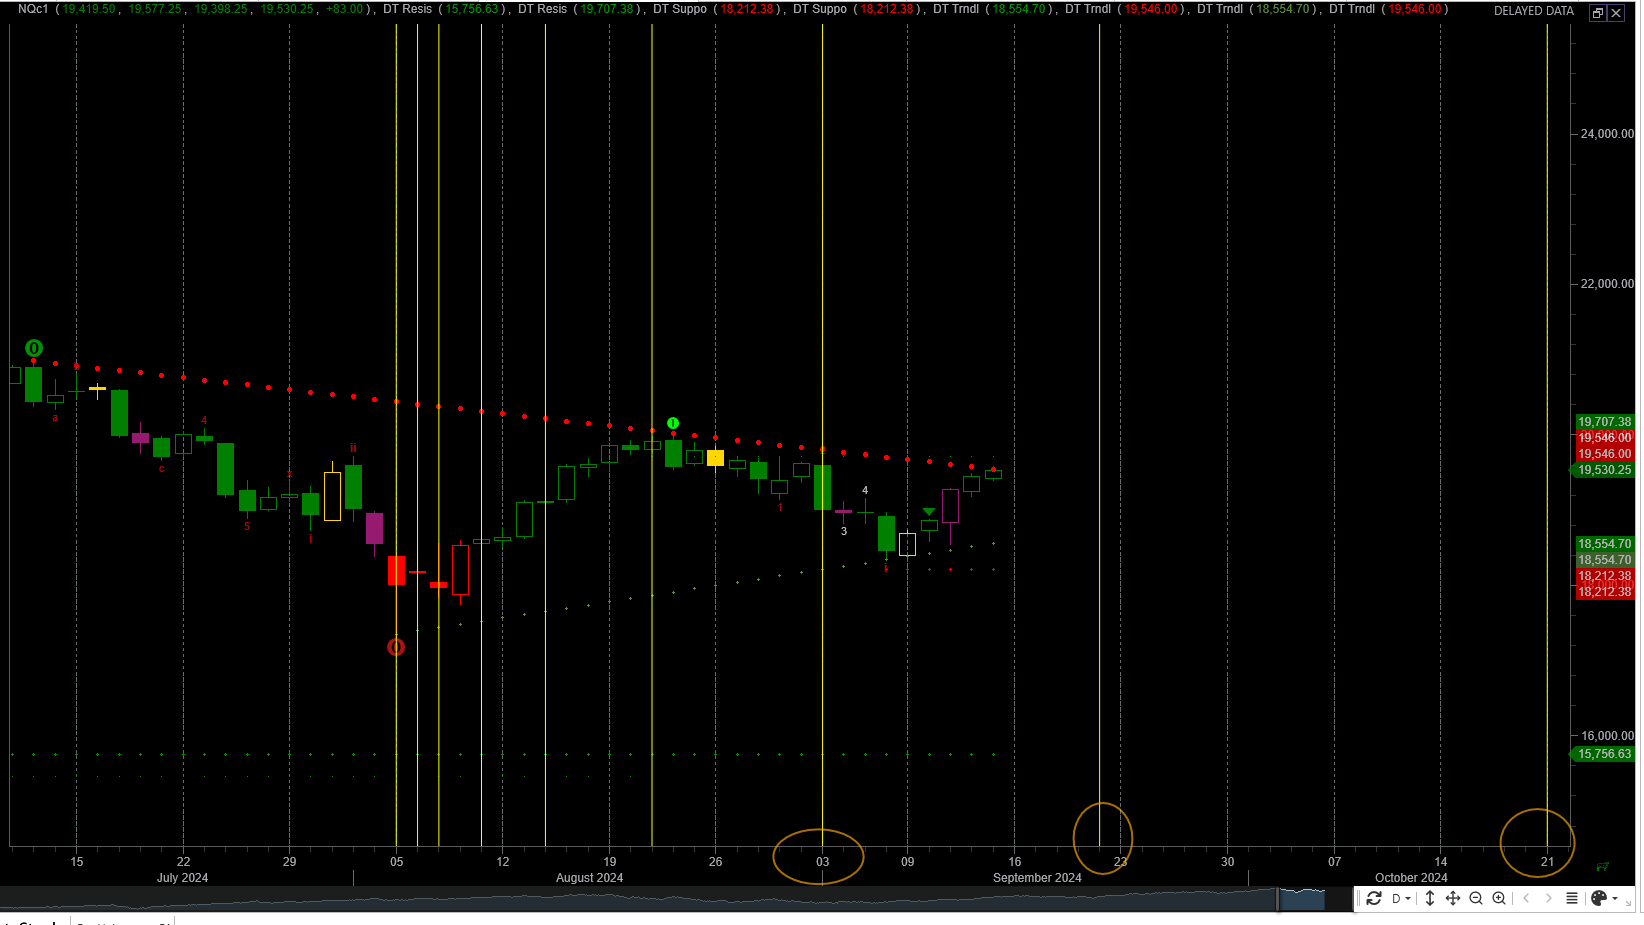
The nazdaq futures are currently at a resistance point based on a trendline drawn from the mid-July high. As discussed before, the nazdaq 100 has been weaker since mid July. Ultimately for the market to go significantly higher, would require a strong a nazdaq.
Recently, the Nazdaq also made a higher swing low. I have a drawn a potential upside targets below. I dont see significant upside movement beyond the trendline break. Potential targets of 20,735 to 21,467.

Shown below are the Fibonocci time projections:
9/3 was the day of the last swing high. Both 9/20 and 10/21 are projected as significant events.
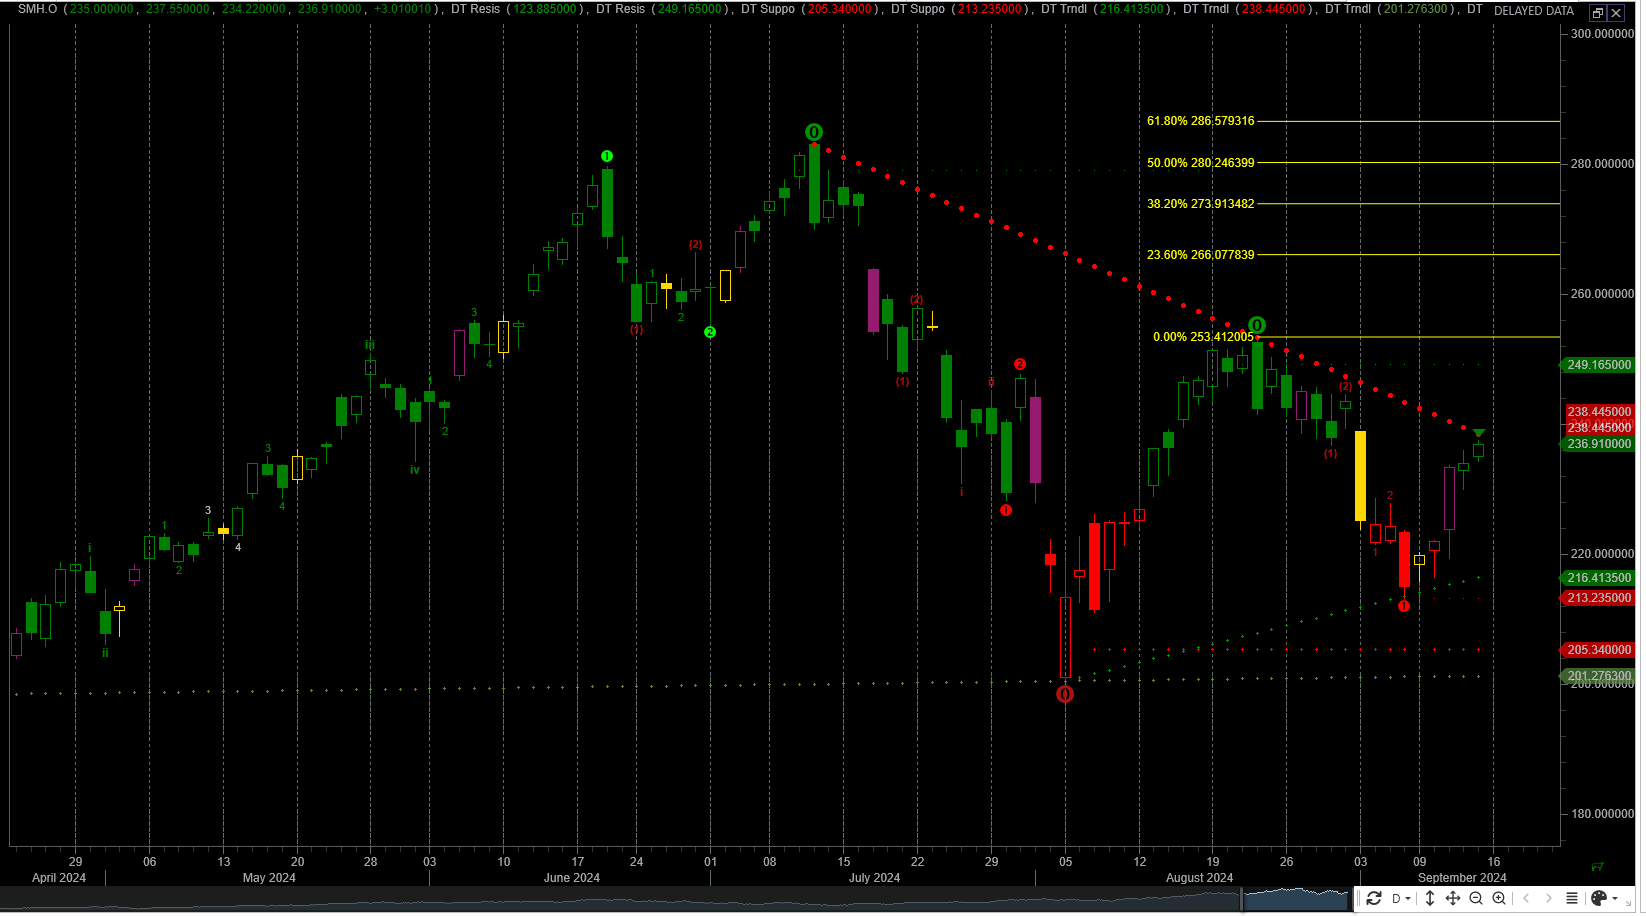
SMH Chart
The semiconductor chart looks similar to the Nazdaq chart. NVDA is the major component in the space. The semiconductors paused at the trendline.
I have drawn in the fibonocci price projections.
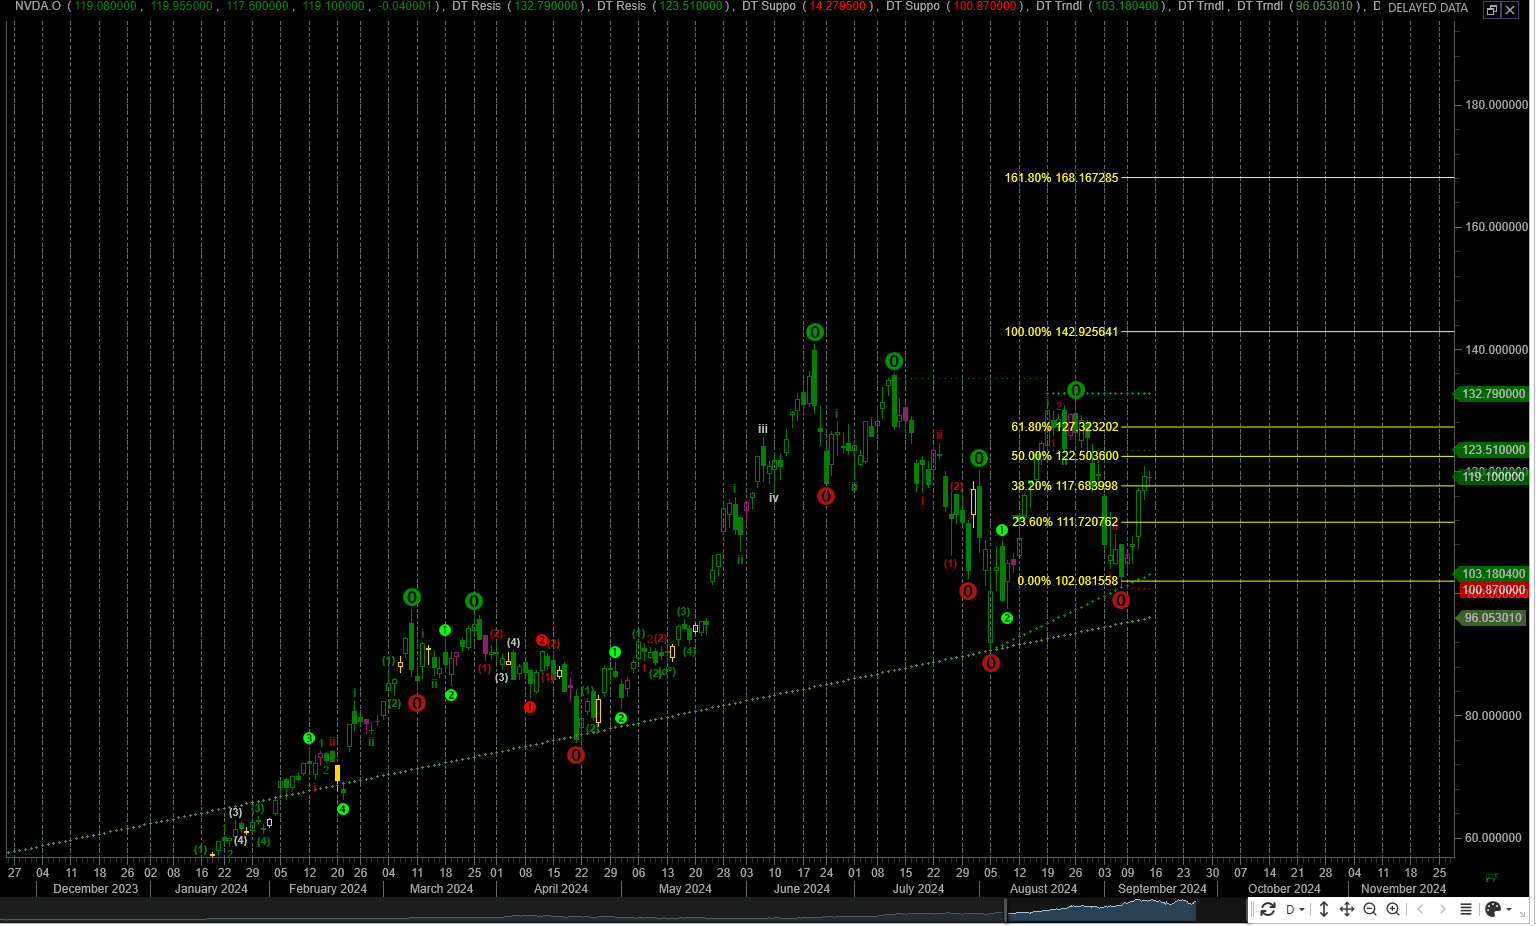
NVDA
Upper projections for NVDA are 123.50, 133, 142, 168. NVDA accounted for 40% of the up move last week.
So what is driving the S&P now.
The S&P is derived from both growth and value components. As pointed out earlier, the technology or growth area is showing weakness.
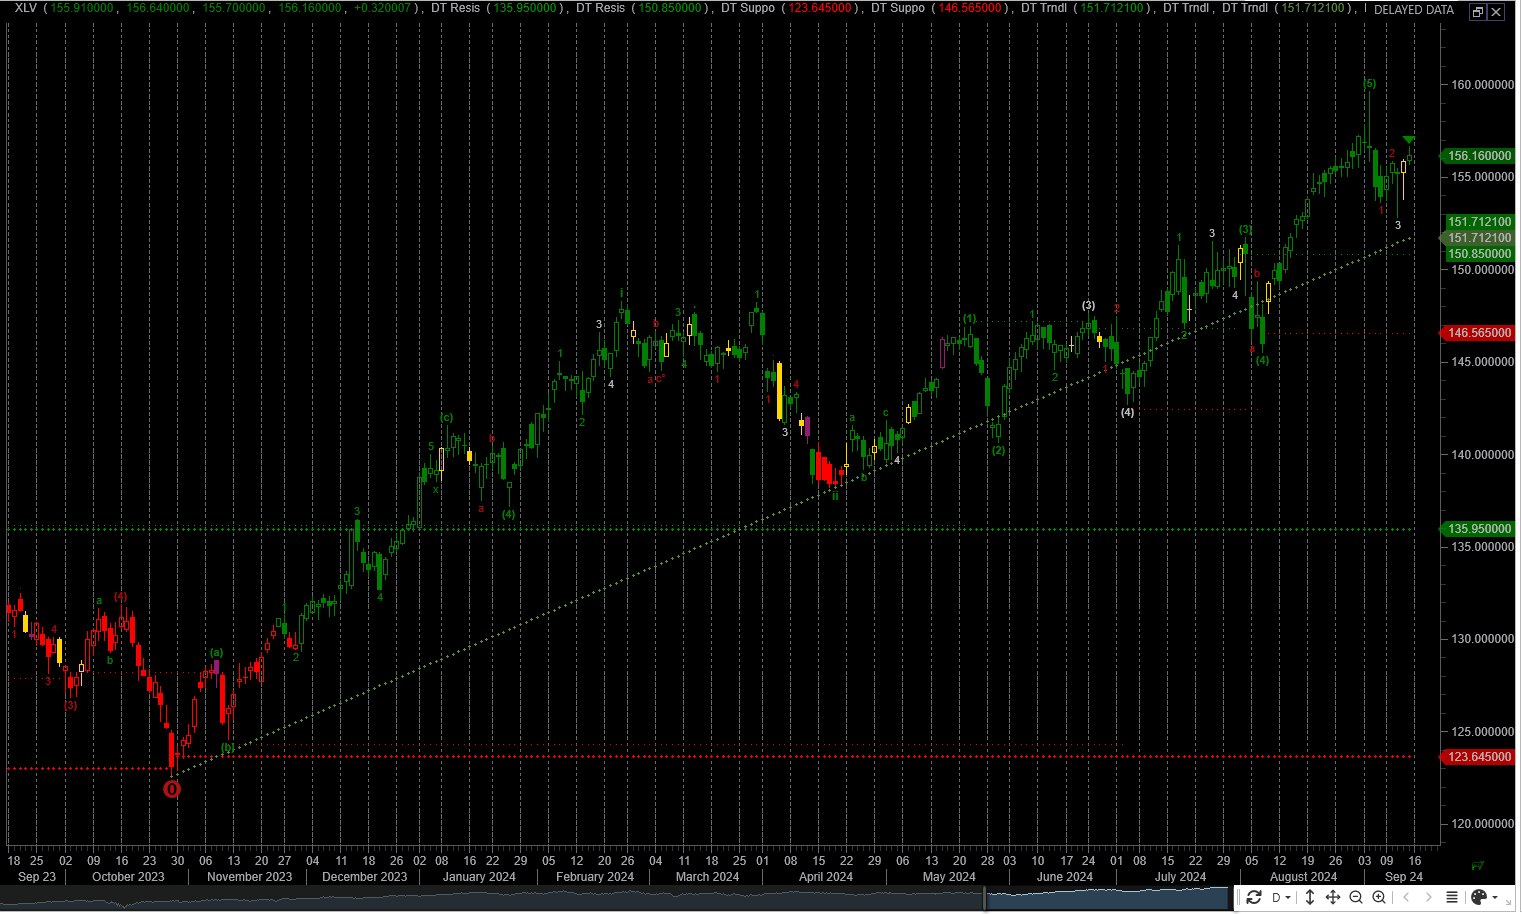
Healthcare
This represents 12% of the S&P. Rebounding from a recent swing low.
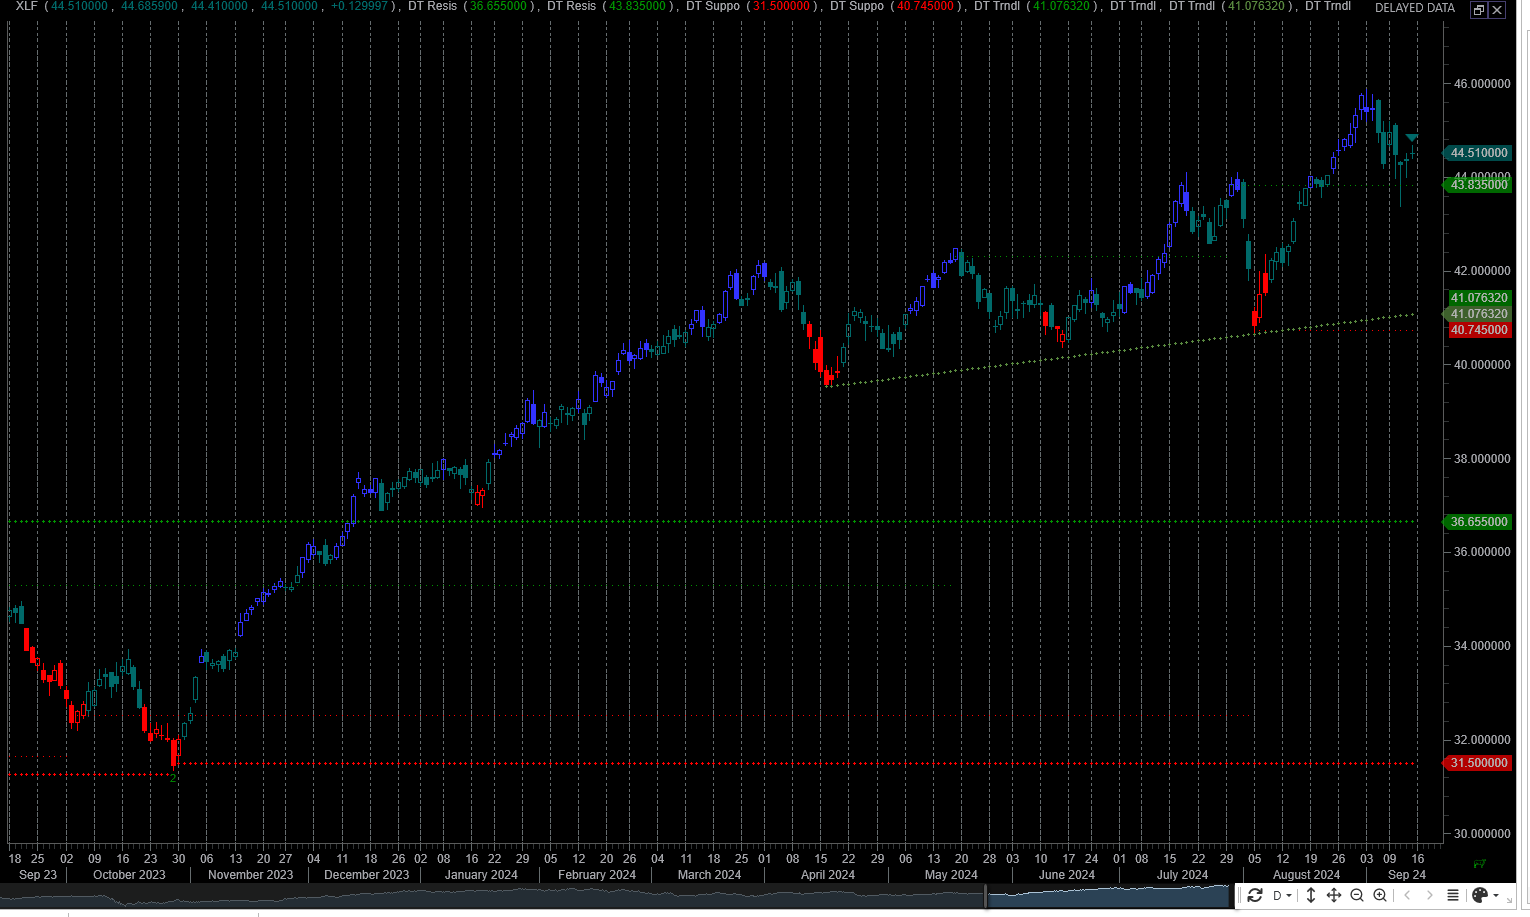
Financials
This sector represents 10% of the S&P. Making a weak rebound from recent swing low.
Communications
The communication sector is represented by the XLC It represents 10% of the S&P 500. This is rebounding into a supply zone.

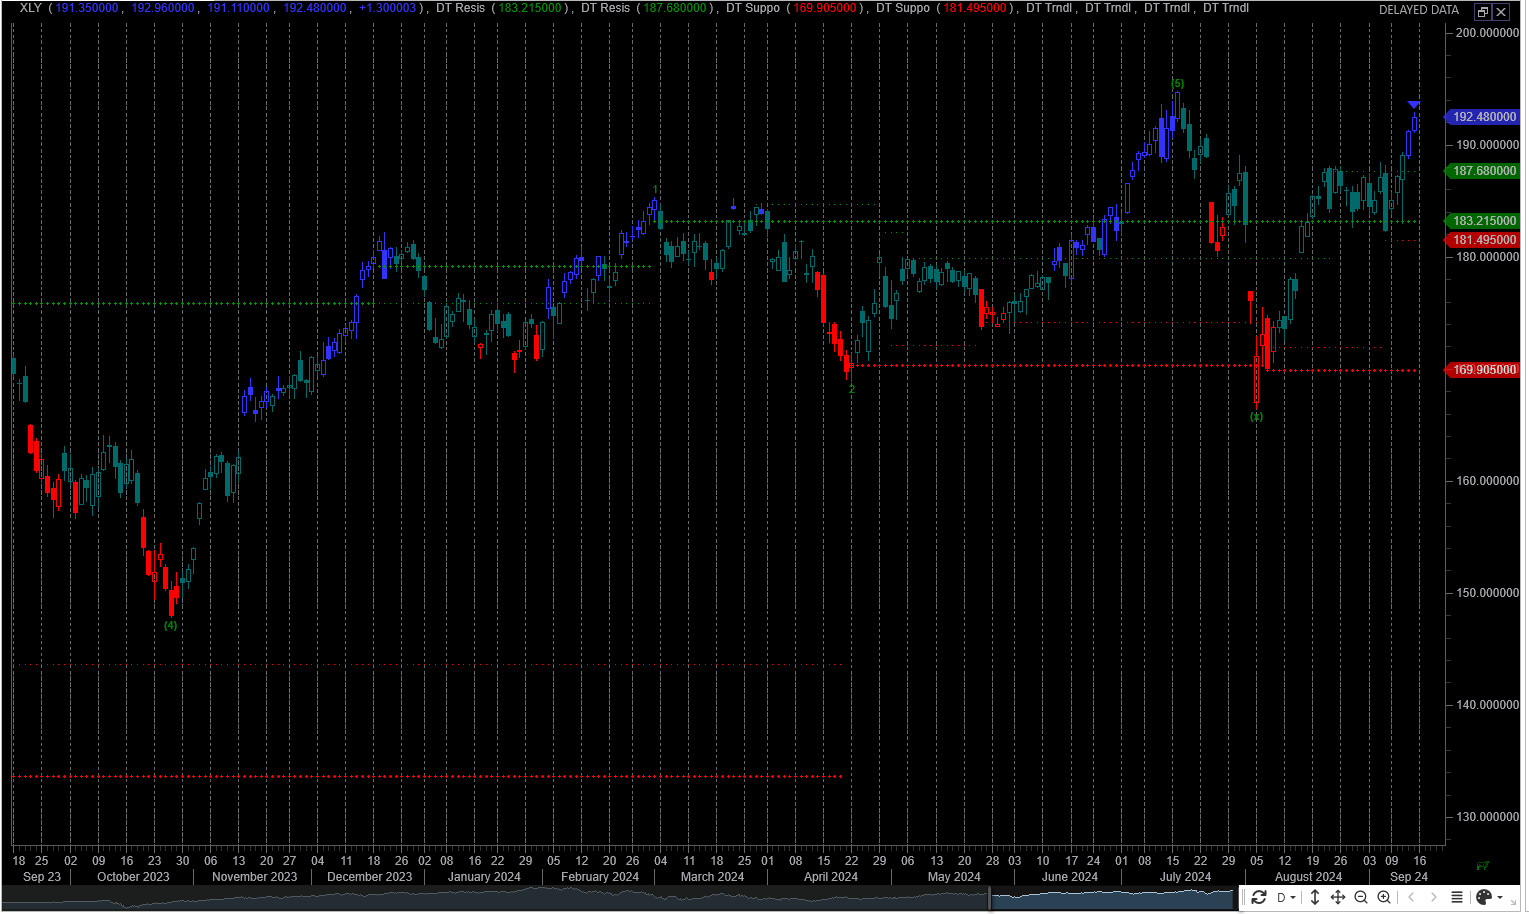
Consumer Discretionary
This sector is represented by the XLY ETF. It represents approximately 10% of the S&P. It is targeting the all time high made in July.
Industrial Sector
The industrial sector as represented by the XLI. It represents 8% of the S&P. It is targeting a recent high.

Technology Sector
This is the largest sector of the S&P and mimics the same pattern as the nasdaq 100. It represents 31% of the S&P. It is at a key trend resistance level.

Where we go from Here…
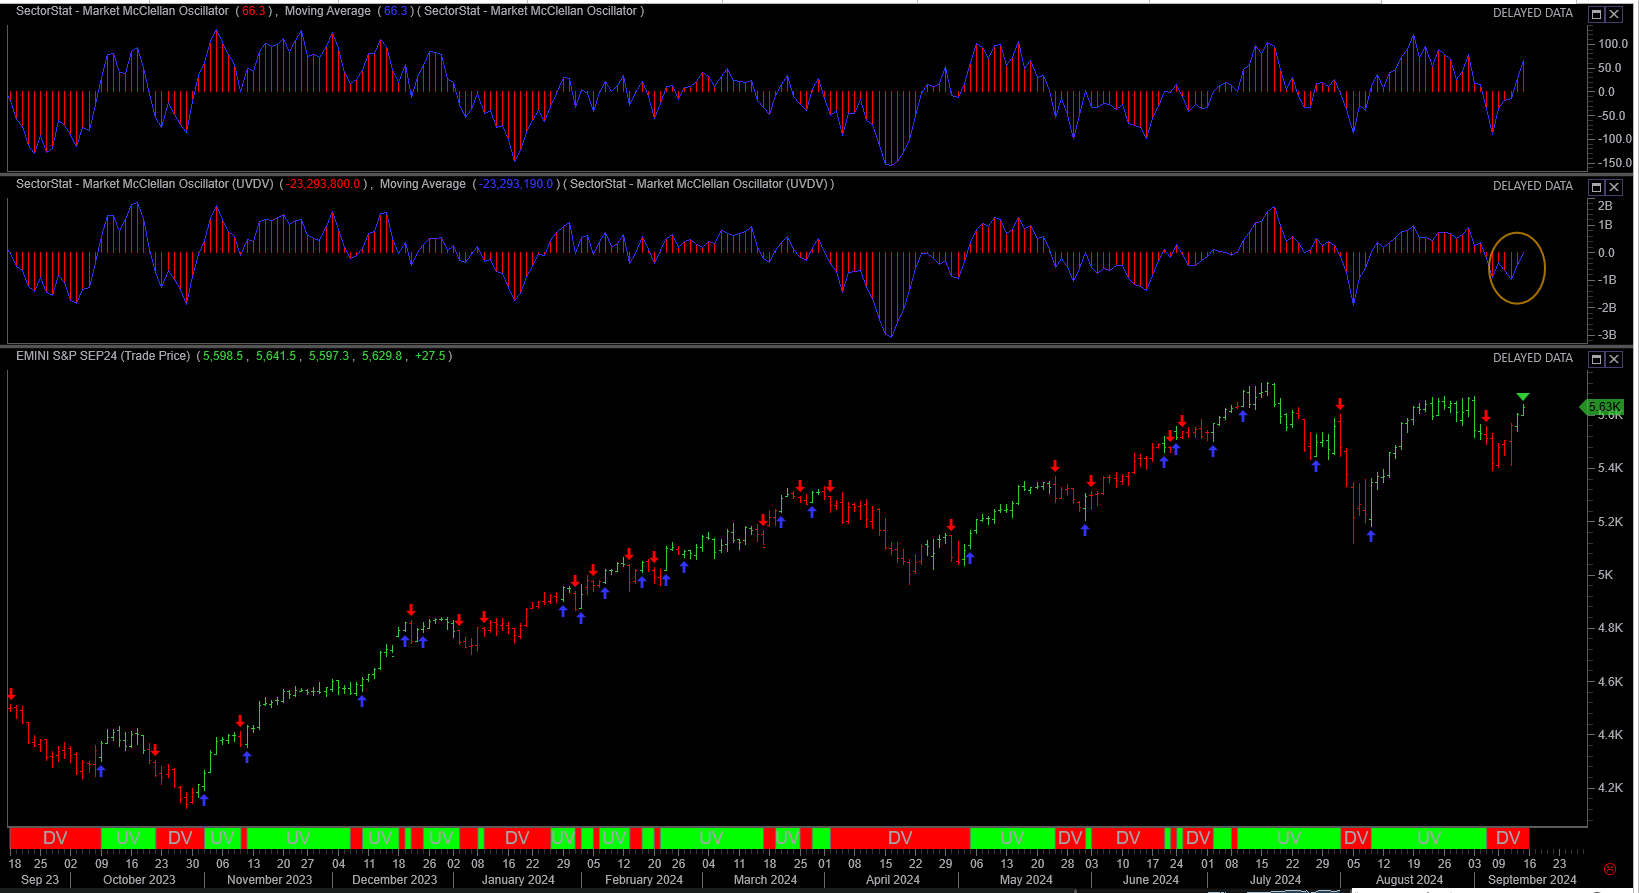
The S&P 500 has moved higher on weaker volume. This indicated by the chart below. For the short term the index can move higher, i believe in the longer term ( 3 months ) the index will correct lower.
The chart shows S&P 500 vs volume, and market sentiment. The circled area shows declining volume. The chart at the bottom is the S&P price movement. The upper chart represents market sentiment.
The Weekly Plan
I am long the S&P 500 going into this week. I see the index moving higher and hit the recent high of 5660.
The wild card this week is on Wednesday with the Fed announcement on interest rates. This will be a market moving event.
Good Luck, stay safe and have a successful trading week.
Thank you for reading my weekly plan.
Joel