Weekly Plan for September 1
Market is in balance. Waiting for a new catalyst. The weekly S&P chart shows a potential downside reversal.

Summary
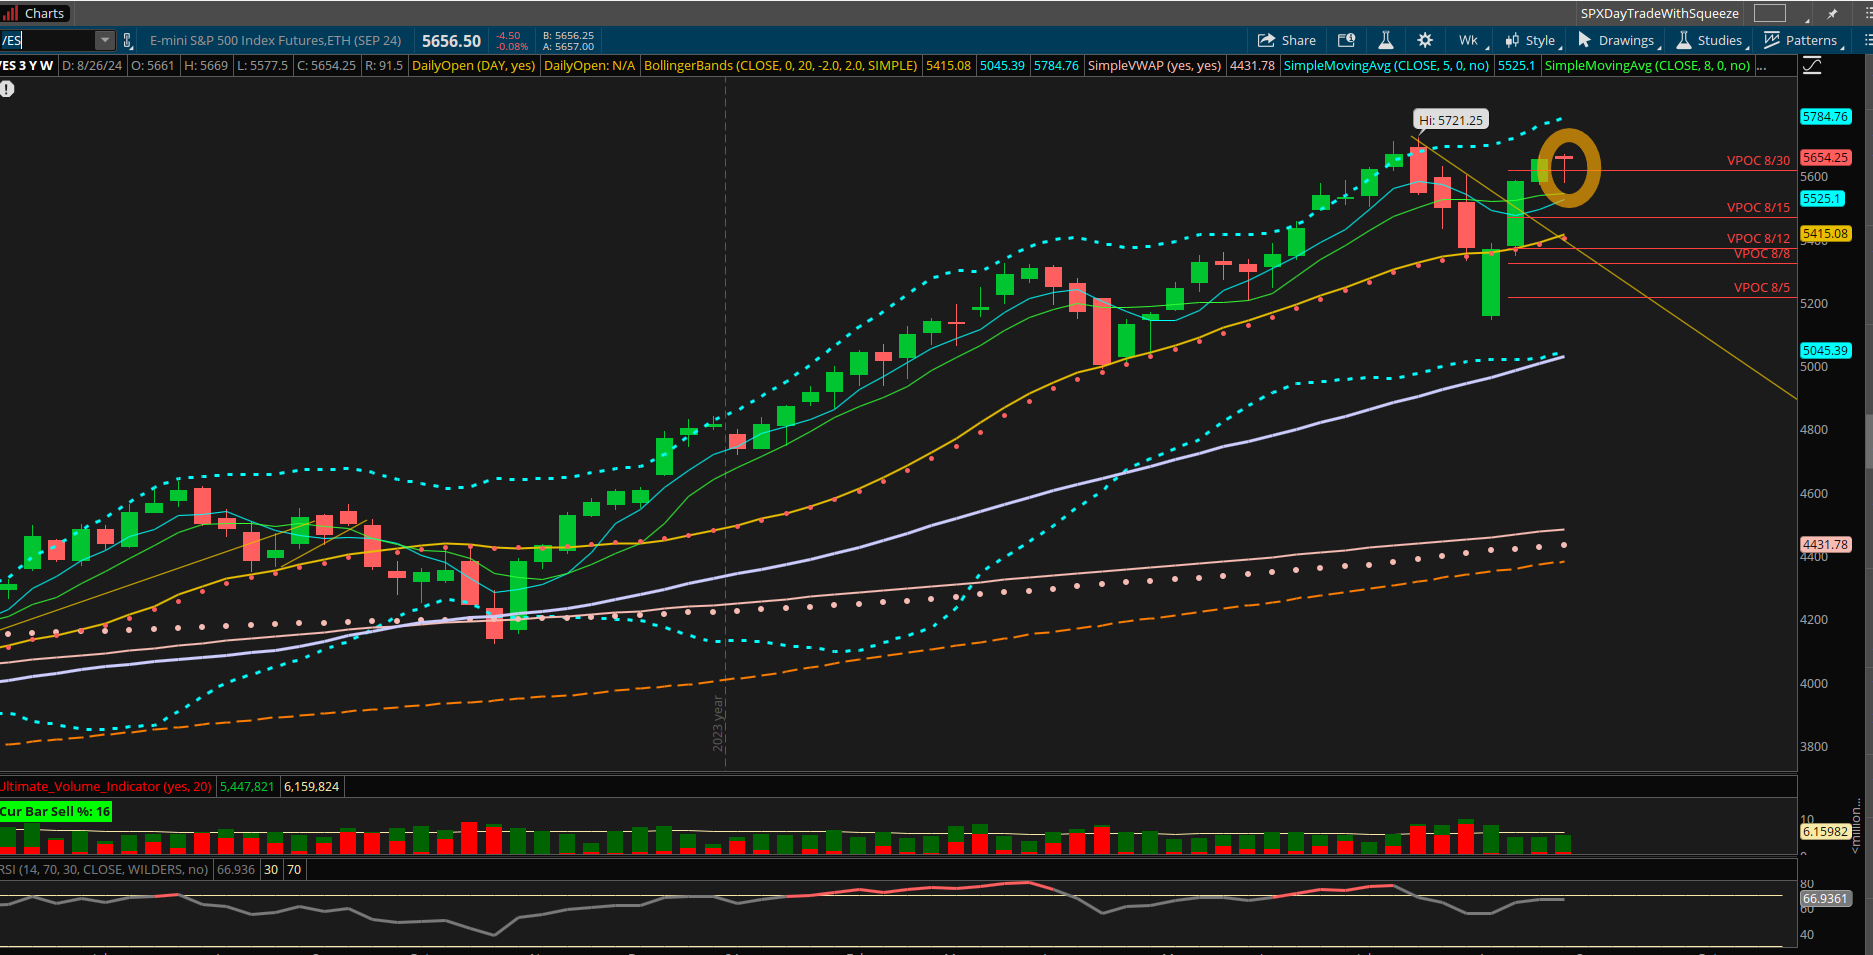
The S&P futures market has been in balance for the past 9 days. The volume profile graphic shows the market is in a distinctive range waiting for a new catalyst. This is highlighted. There are potential catalysts which could move the market this week.
The graphic represents the volume profile for the S&P futures.

S&P futures Chart
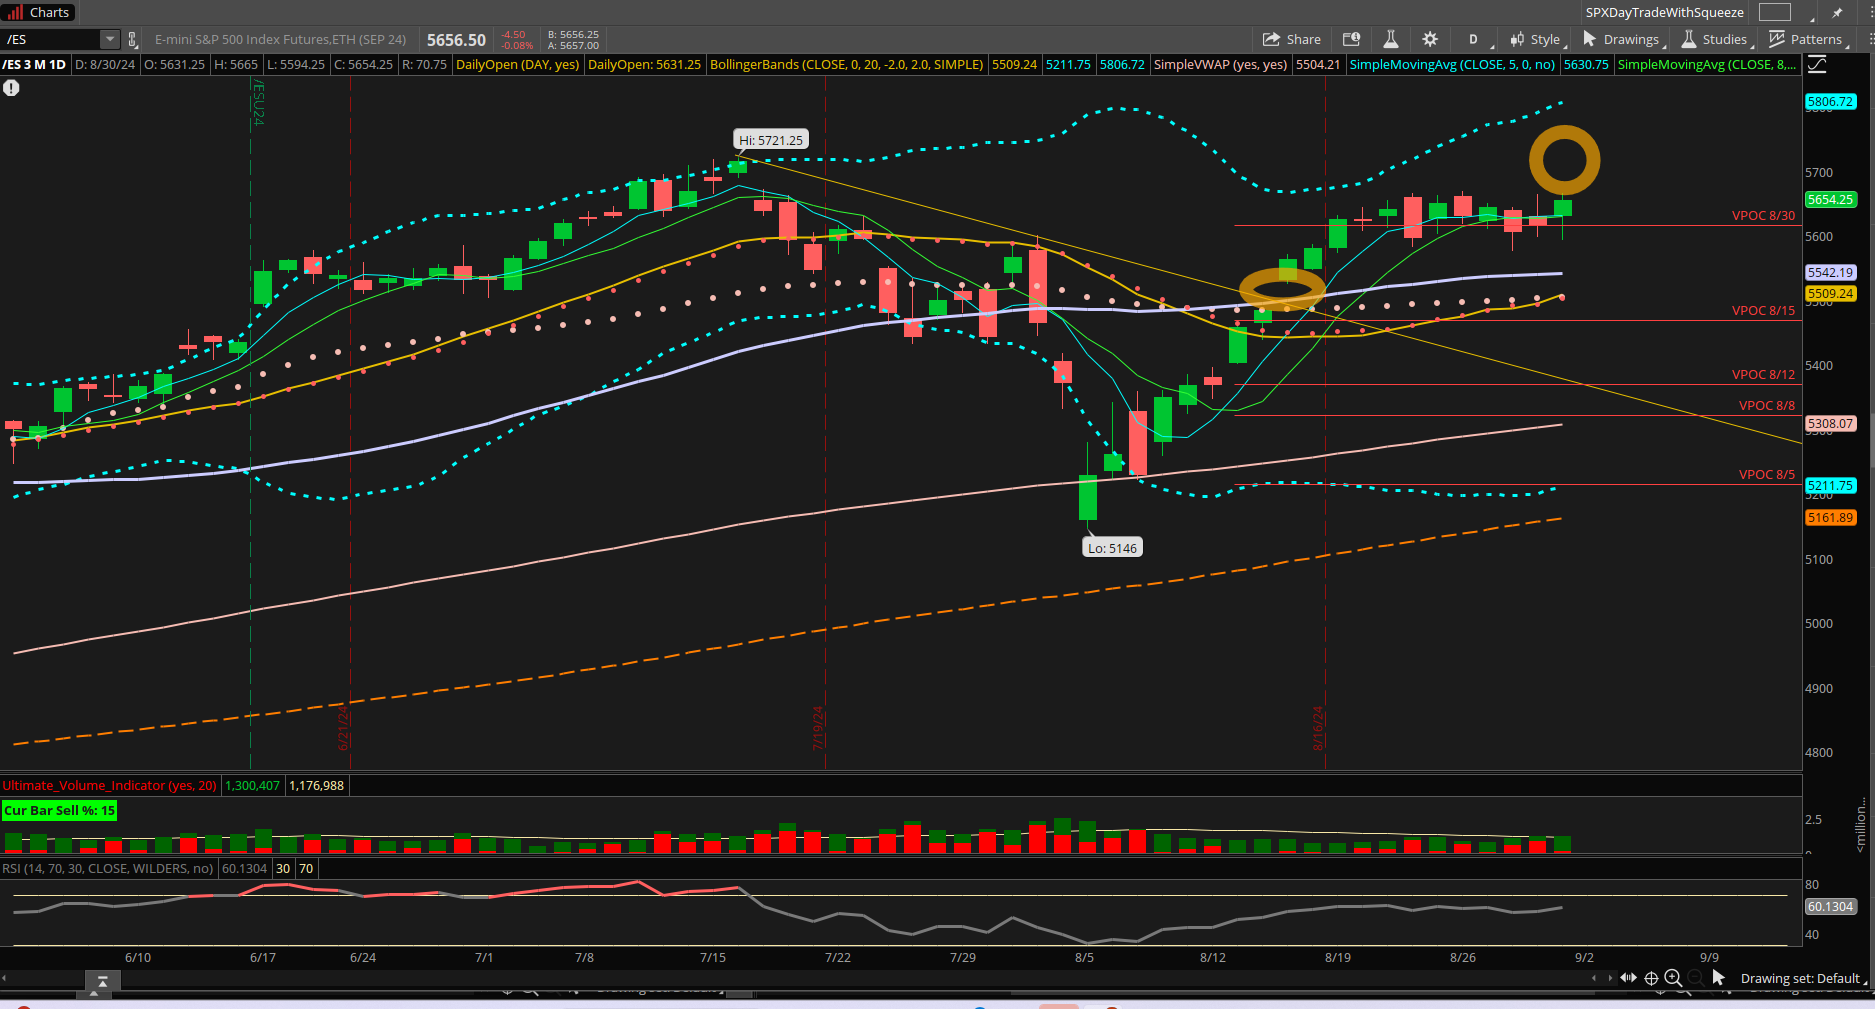
The S&P futures completed both the week and the month on Friday. A potential negative change for the market occured with the both weekly and monthly chart showing a hanging man candle.
In order to have a valid reversal, price would need to move lower than the previous price bar. The price bar has been highlighted.
I have highlighted two areas. The top area represents the distance to the new high. The circled area below represents the gap over the trendline. As September is seasonally bearish, i expect the lower gap to get filled.
Weekly chart of S&P Futures
Monthly chart of S&P Futures

The significant events for this week include the following:

The key for the federal reserve will be the unemployment reports, showing whether there is an increase or decrease in unemployment.
September may lead the S&P lower and the gap getting filled.
On 9/18 the Fed reserve has a Meeting where rates cuts may occur. The Federal reserve has already hinted that they will start lowering rates. The current projection is between 25 to 50 basis point change in the target rate.
Typically, when the Fed begins lowering rates, it is indication that economy has already fallen into recession, and the S&P will move lower.
This current market is very tricky as the price is above all key moving averages. That is due to the following key points:
Price is above the 8 day, 21 day and 50 day Simple Moving Averages.
Additionally market breadth has been strong over the past few weeks.
Price has consolidated by time, rather than falling.
NQ futures Chart
The nazdaq futures have made a similar move as compared to the S&P. The relative strength of nazdaq is much weaker than the S&P. As the S&P is near a high, however is a number of percentage points away. The highlighted region represents overhead supply in the Nazdaq chart.
Earlier in the year, the nazdaq was the leader, and now is the laggard. This can impede the progression of the S&P 500.

SMH Chart
The semiconductor chart looks similar to the Nazdaq chart. NVDA is the major component in the space.
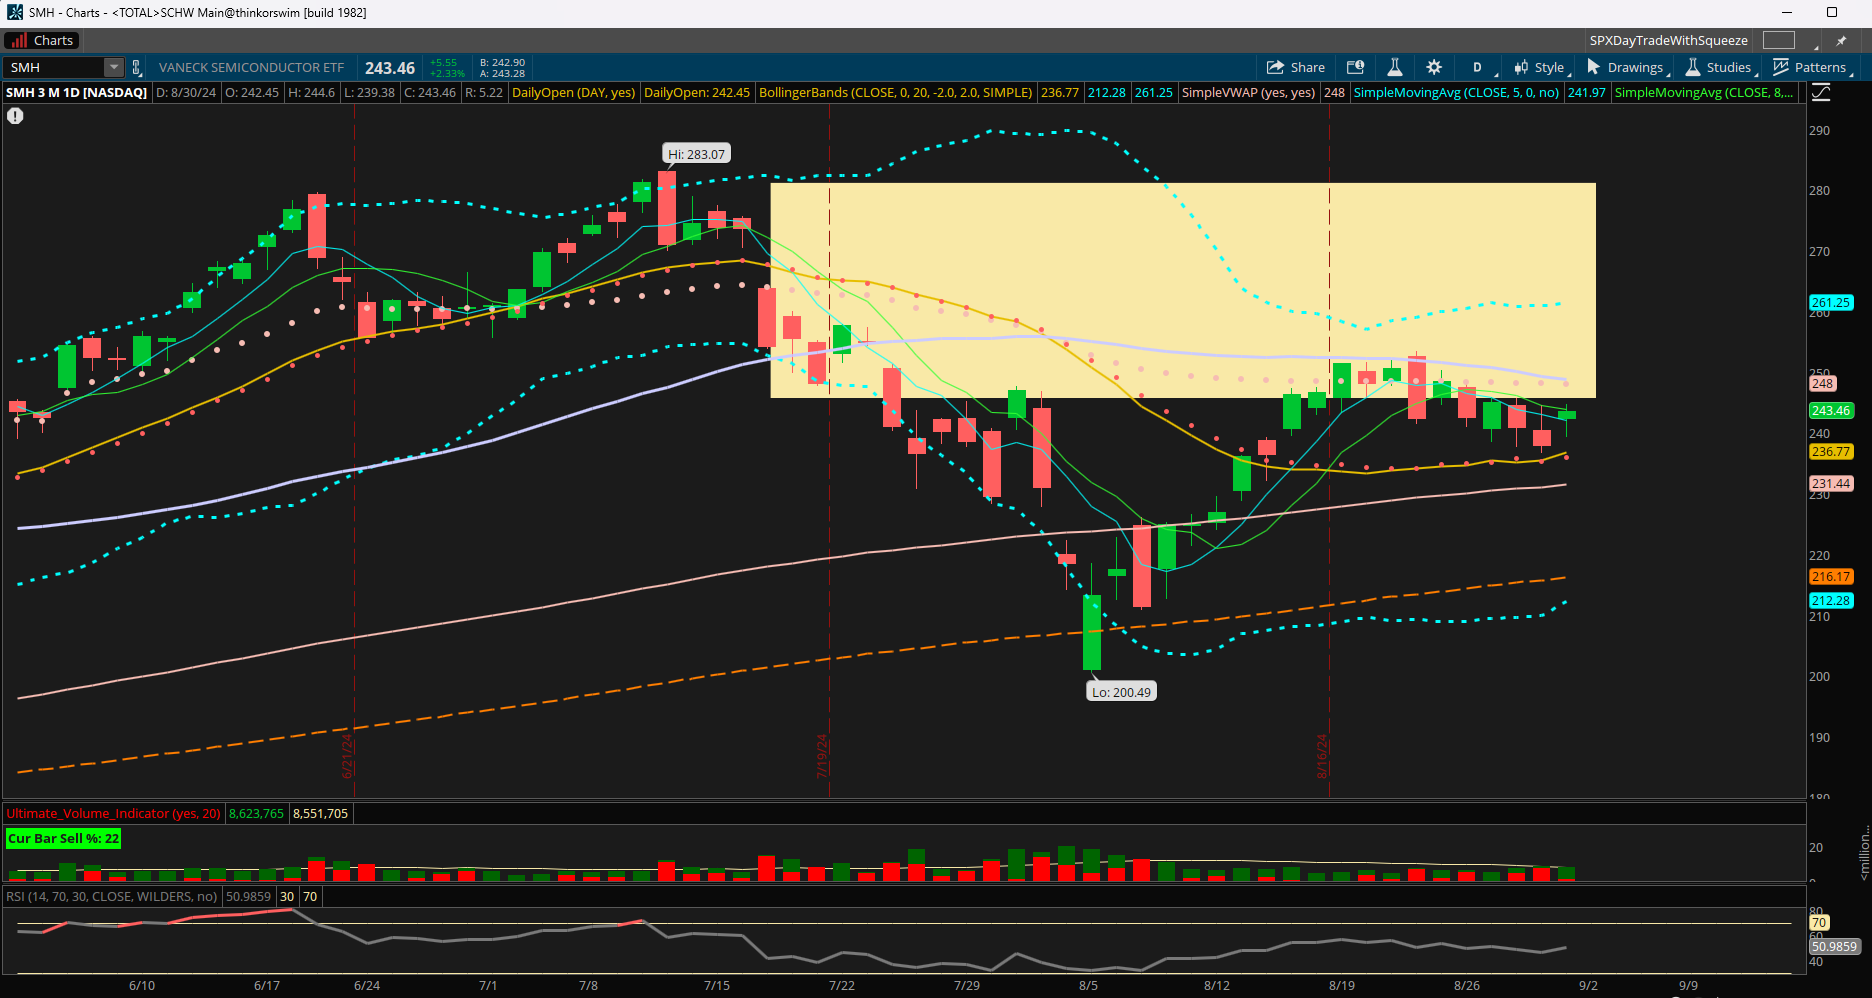
NVDA
NVDA had good earning results yet the stock sold off. The expectation for the stock was very high. This is potential drag on both the Nazdaq and the S&P.

So what is driving the S&P now.
The S&P is derived from both growth and value components. As pointed out earlier, the technology or growth area is showing weakness. For the S&P to move higher and a weak technology component rather then the value area of the S&P is moving the index higher.
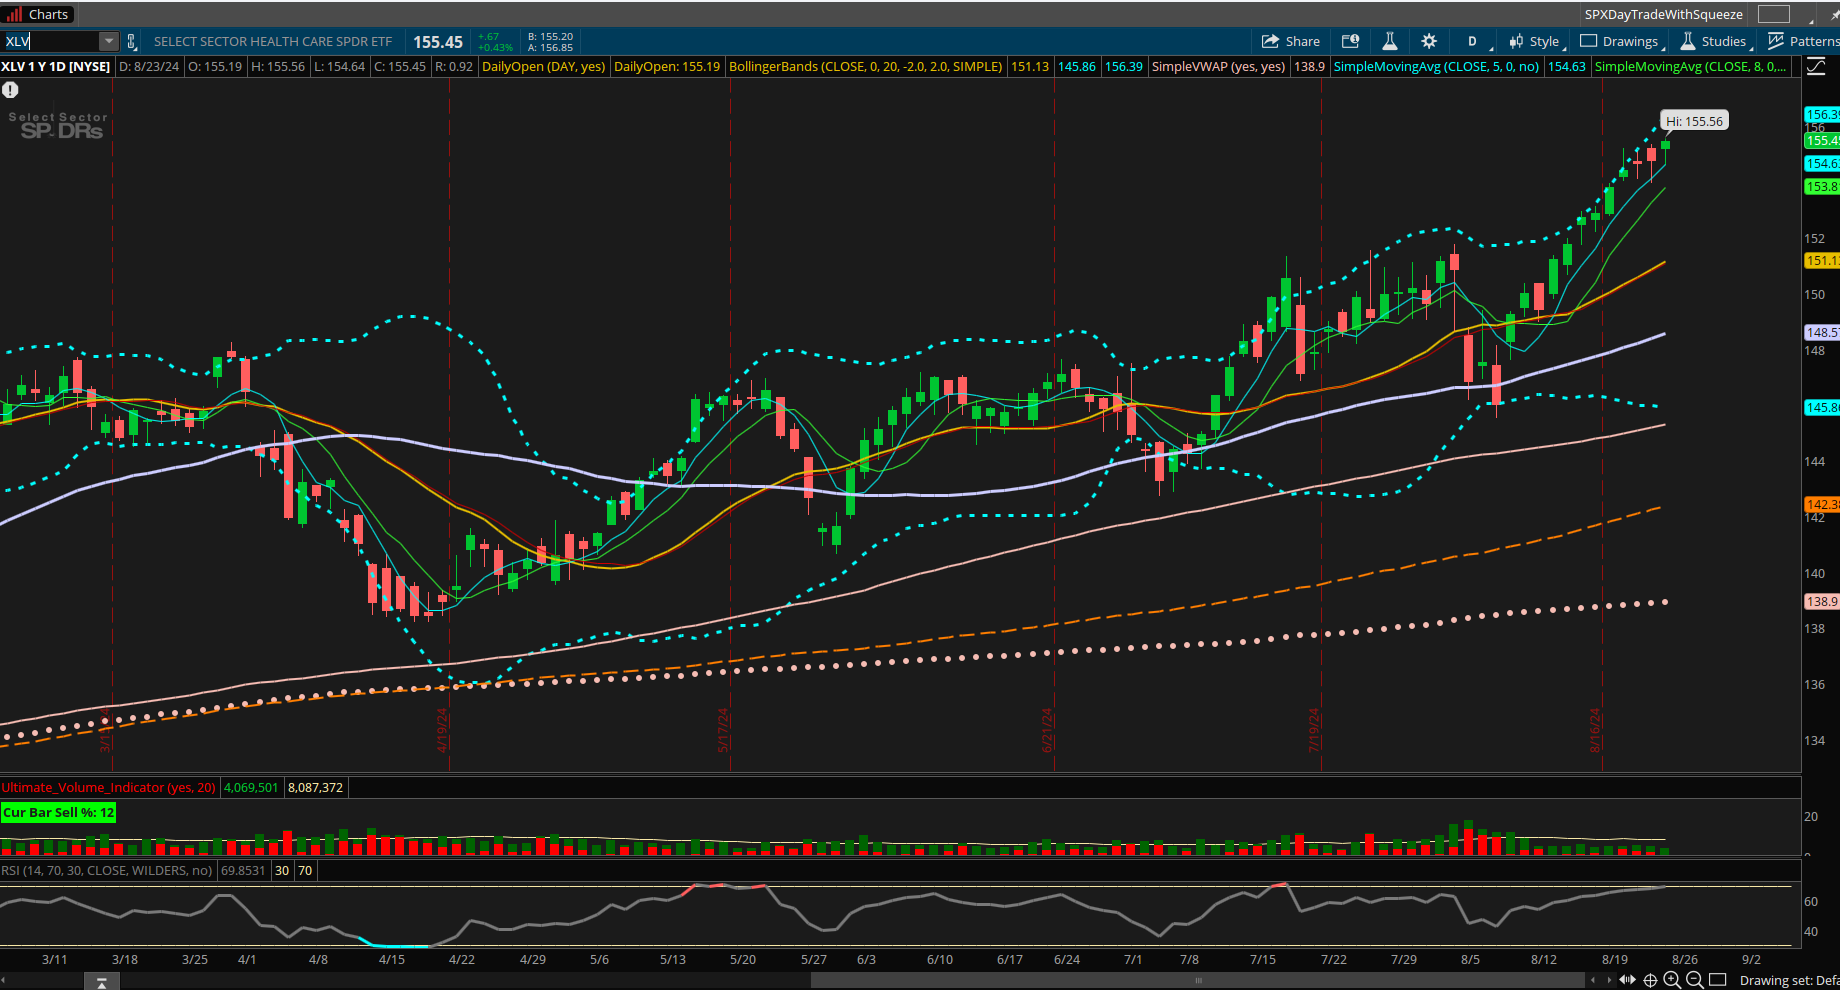
Healthcare
The healthcare sector as represented by XLV is making higher highs. This represents 12% of the S&P.
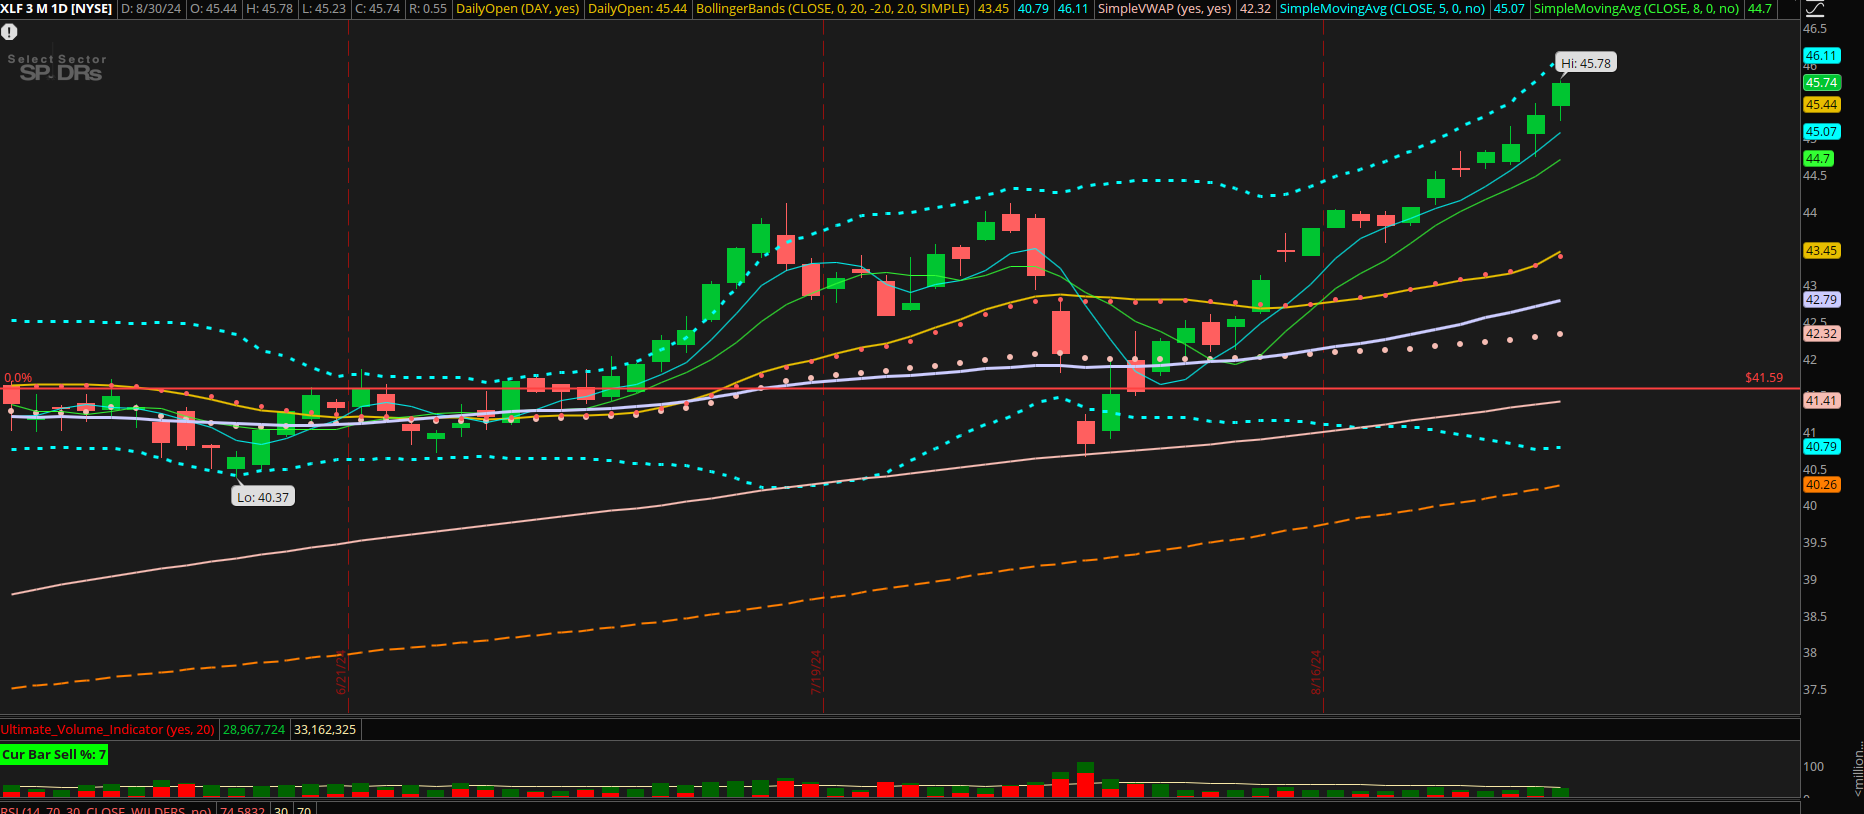
Financials
The financial sector as represented by XLF is making higher highs. This sector represents 10% of the S&P.
Communications
The communication sector is represented by the XLC. It is pausing the most recent move from the lows. It represents 9% of the S&P 500.

Consumer Discretionary
This sector is represented by XLY ETF. It is showing a large area of overhead supply. It represents approximately 10% of the S&P.

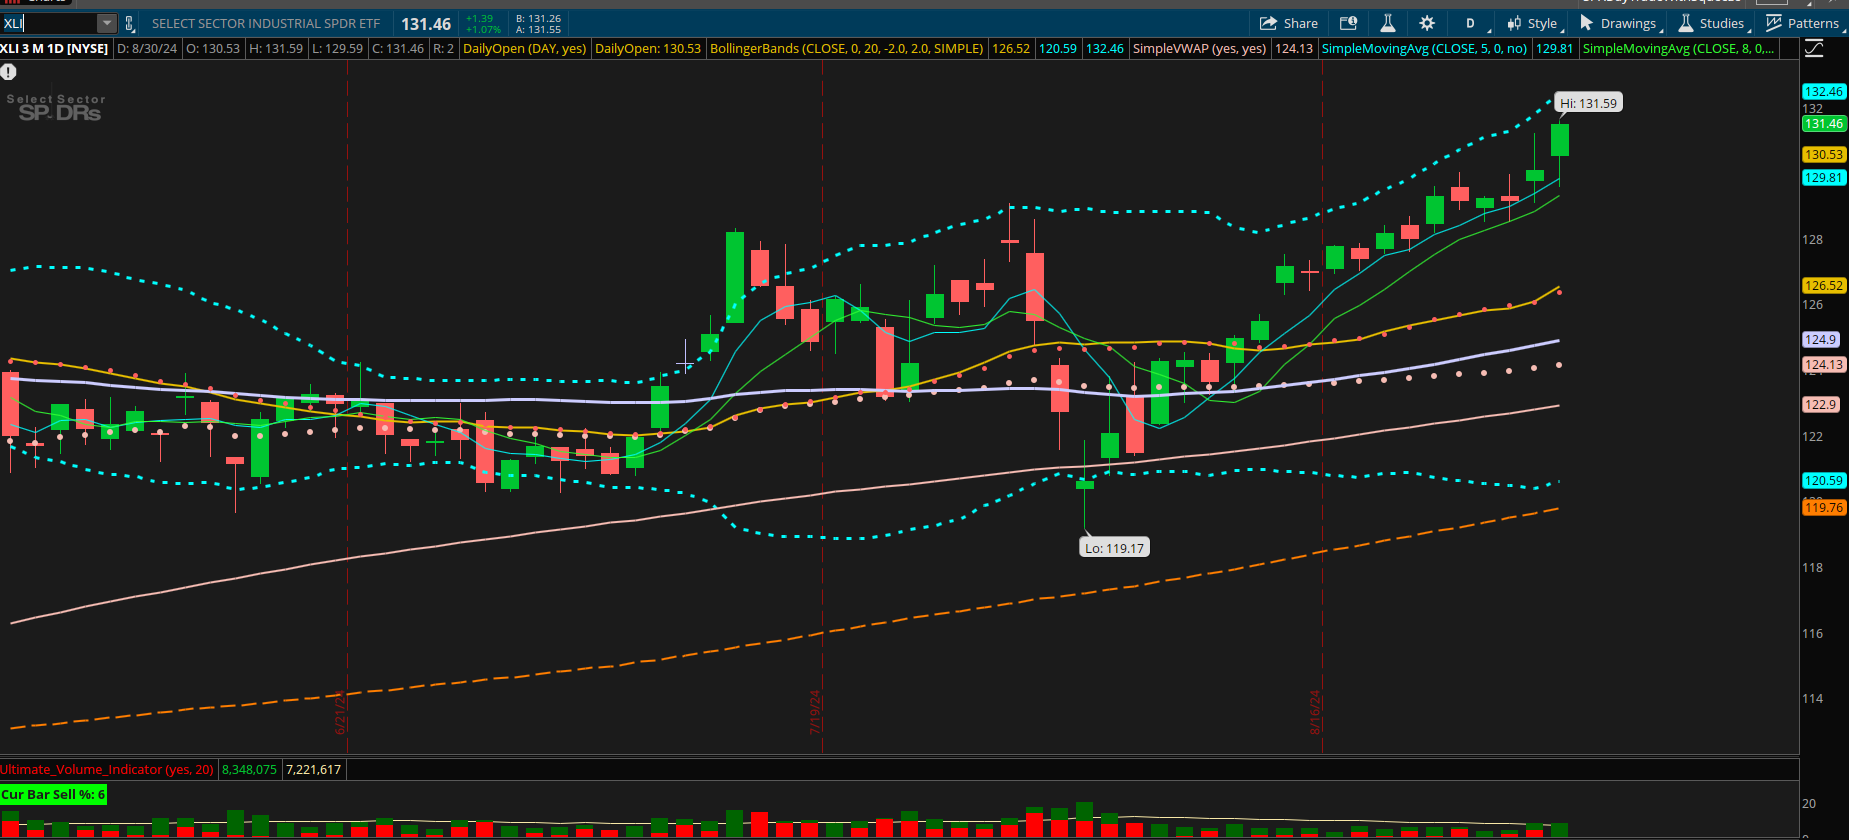
Industrial Sector
The industrial sector as represented by the XLI. It represents 8% of the S&P. It appears to be making all time highs.
Where we go from Here…
The S&P futures have rallied nearly 550 points since August bottom. The chart below represents a weekly chart showing how far price has moved from the trendline. In August it rallied to 9% above the trendline before retreating. Price is now near a similar distance from the trendline.
The “V” shaped reversal observed is a momentum driven rally. My expectation is that the gap near 5500 will fill. This is approximately 165 points below the current price.

Currently, I am mostly in CASH waiting for the S&P to trigger it’s next move. I believe we will see lower prices. I am NOT front running this price action and trying to pick a top. I will wait for the market to signal the next sequence. For now, I am not placing any large trades and only scalping the price action in the S&P.
The Weekly Plan
The expected range for the S&P is 165 points for the week. My expectation is for the S&P to slowly move higher, followed by a stronger move lower.
Scenario 1
If the market breaks above 5681 I will only enter long trades. A target is 5725
Scenario 2
If the market breaks below 5600 I will only enter short trades. A short term target is 5450.
These potential plays are very short term, approximately one week.
Good Luck, stay safe and have a successful trading week.
Thank you for reading my weekly plan.
Joel