Weekly Plan for September 22
The federal Open Market Committee (FOMC) reduced interest rates by 50 basis points. How do we trade the next move in the S&P 500?

Summary
Last week was another volatile week with lots of oppurtunity for the patient trader and or investor. The S&P 500 did make an all time high last week. When the FOMC announced the rate cut the S&P moved within a range of 85 points and ended up closing at the low of the day. The following day (Thursday 9/19) it opened higher with a large gap; approximately 100 points higher. By the end of the day it closed nearly unchanged for the day session. Friday also showed action where price closed and opened near the same price.
S&P futures Chart
Daily Chart of S&P Futures
I have circled the price action for Thursday and Friday. The price pattern for Thursday and Friday is considered a “hanging man candle” . It has potential for a trend reversal of an upward trend. There is a tendency for gaps to get closed. In the markets there never is a rule where it has to move in a specific manner, however there is higher probability that price will close the gap prior to moving higher.

The weekly trend provides a different view. It shows a strong close for the week. I have circled the area on the chart. I have also highlighted a Fibonacci extension target which price hit last week.
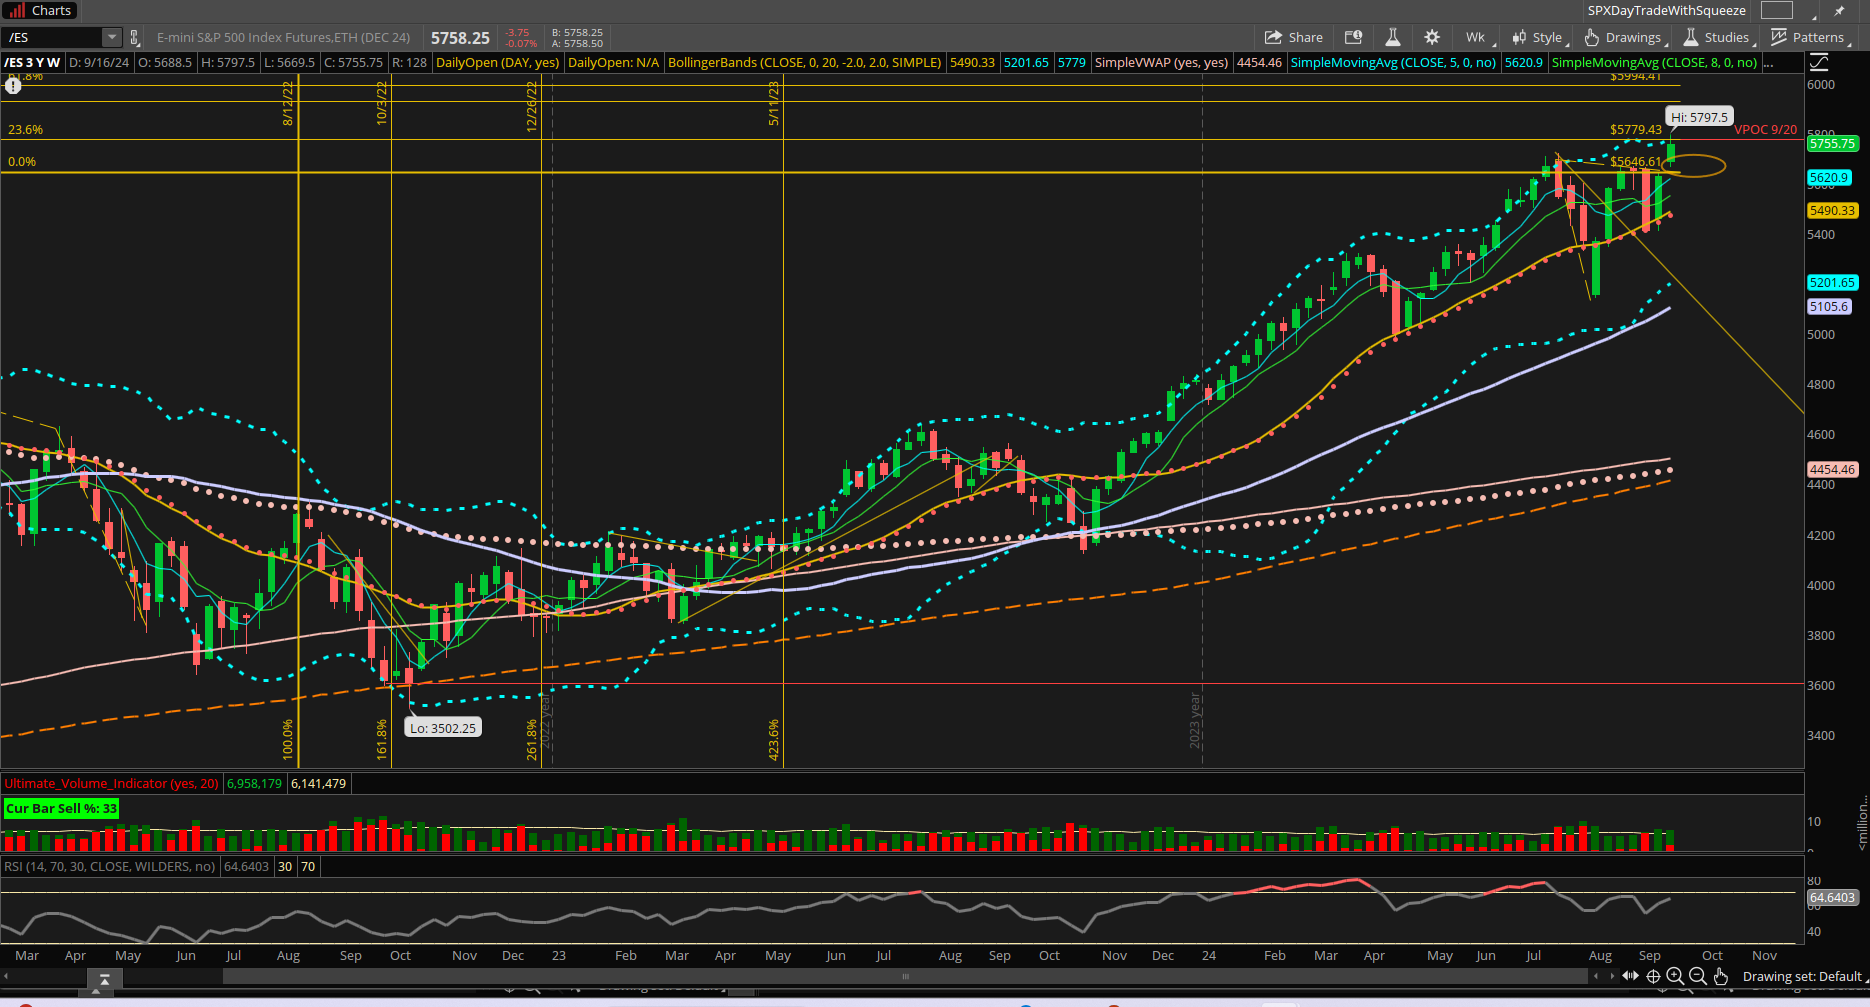
On both Thursday and Friday, the price action was stalling. This means that price could not move significantly higher from the overnight high. Additionally, price could not significantly move lower as well. The S&P establishished a new balance range and now is waiting for the next catalyst to send it higher or lower out of range.
I have highlighted the volume profile chart. The circled area represents a two day balance range for the S&P

The Commitment of Traders Report
What does this tell us?
It shows us overall that traders on behalf of businesss as well as speculators are selling the market in aggregate.
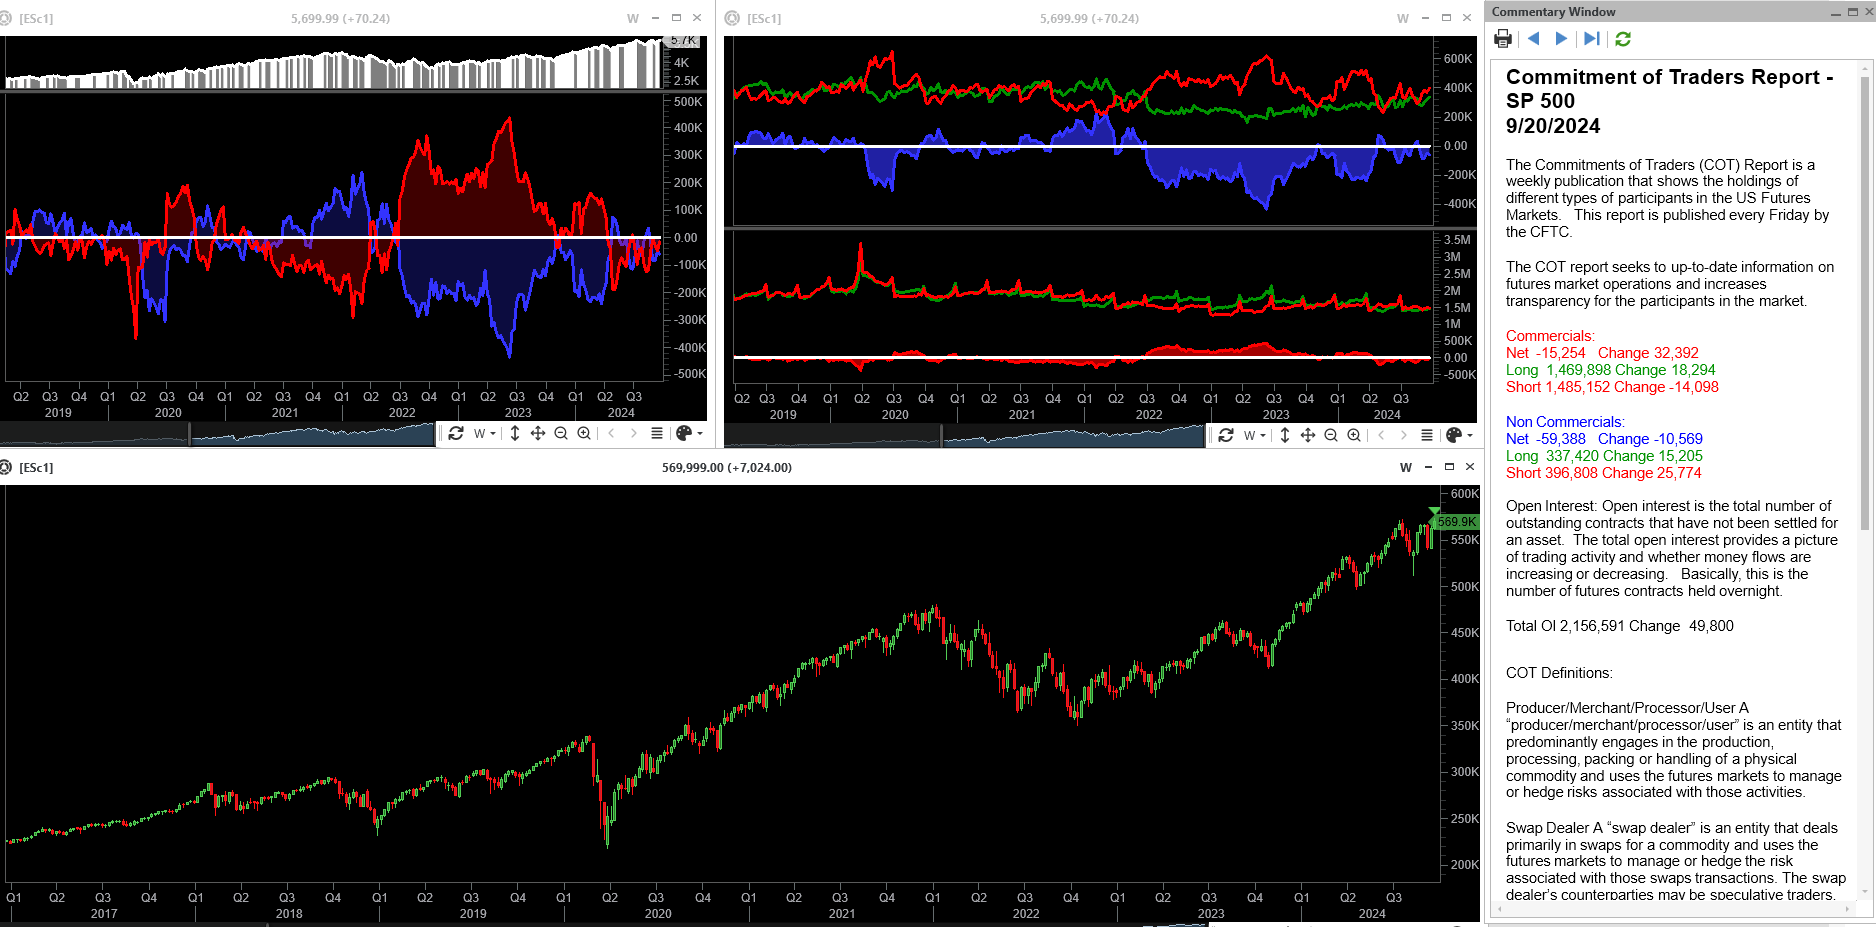
So in inspite of the S&P continously making new highs large players are sellers.
NQ futures Chart
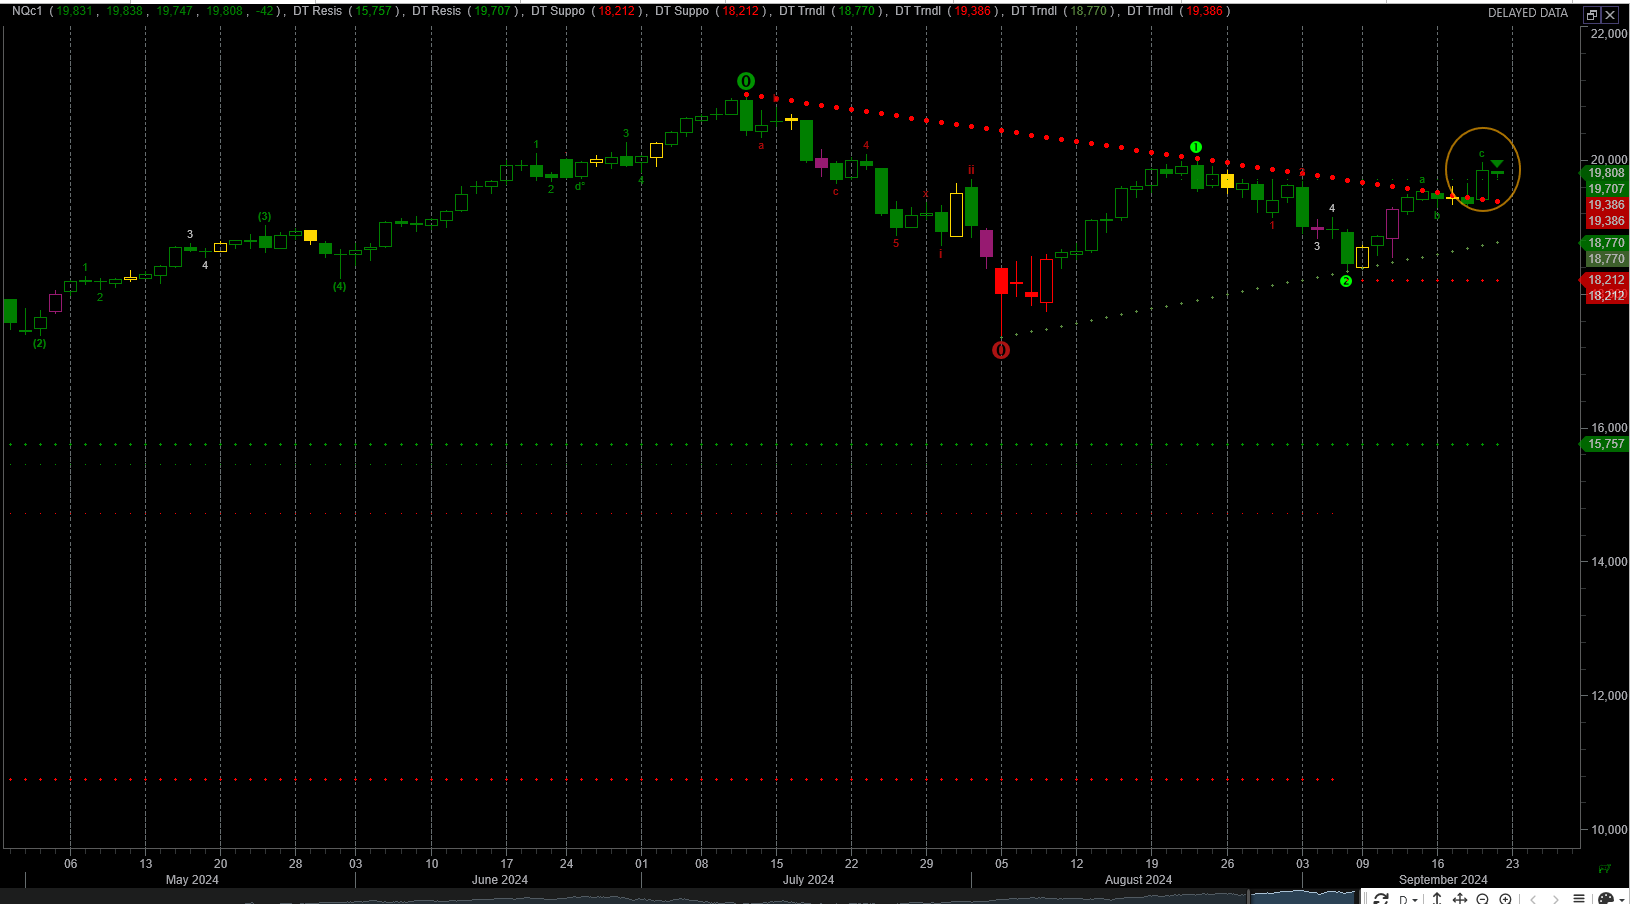
The NQ broke above a trendline drawn from the July 11 high. The circled area was Thursday and Friday’s price action.
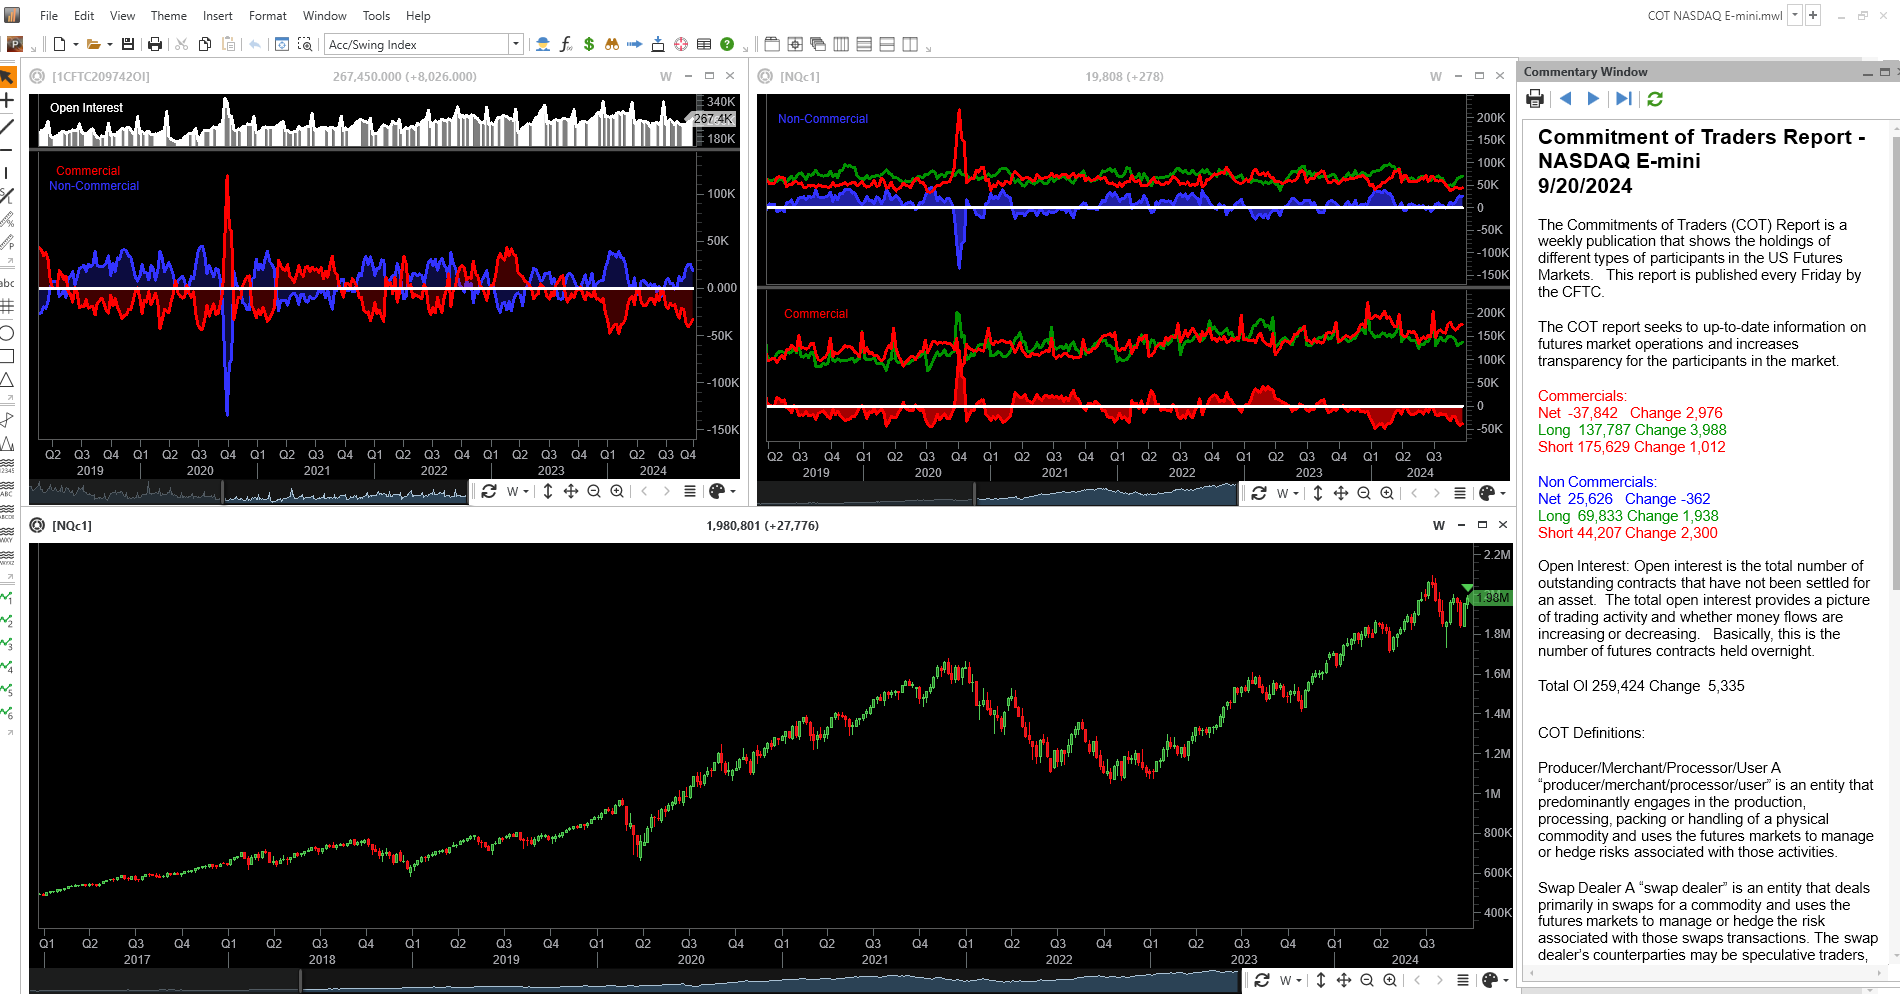
The Nazdaq COT report.
This report is giving a different message from the S&P 500. The commercials are net short the Nazdaq while the speculators are net long.
What are the potential catalysts for the week?
A number of Federal Reserve policy makers are making speeches this week.
The Personal Consumption Expenditures (PCE) is getting delivered on Friday. This is a metric the FOMC team uses as one of it’s inputs for interest policy decisions. It is a potentially a high impact event and could move the markets.
SMH Chart
The semiconductor chart looks similar to the Nazdaq chart. The semiconductors broke above the trendline.

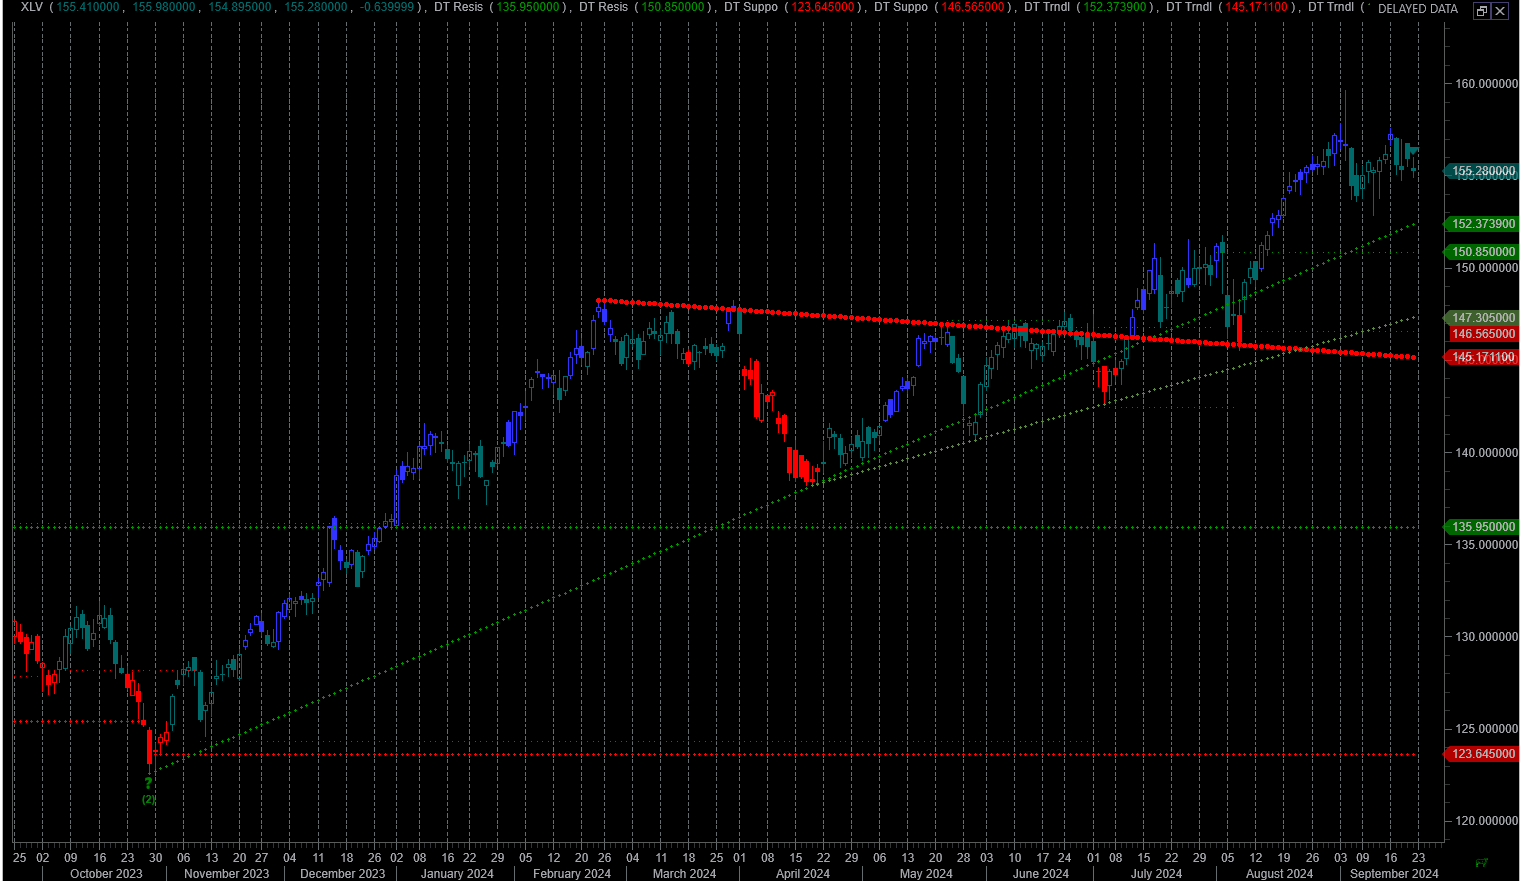
Healthcare
This represents 12% of the S&P. It is consolidating at a recent high.
Financials
This sector represents 10% of the S&P. It is consolidating a recent high.

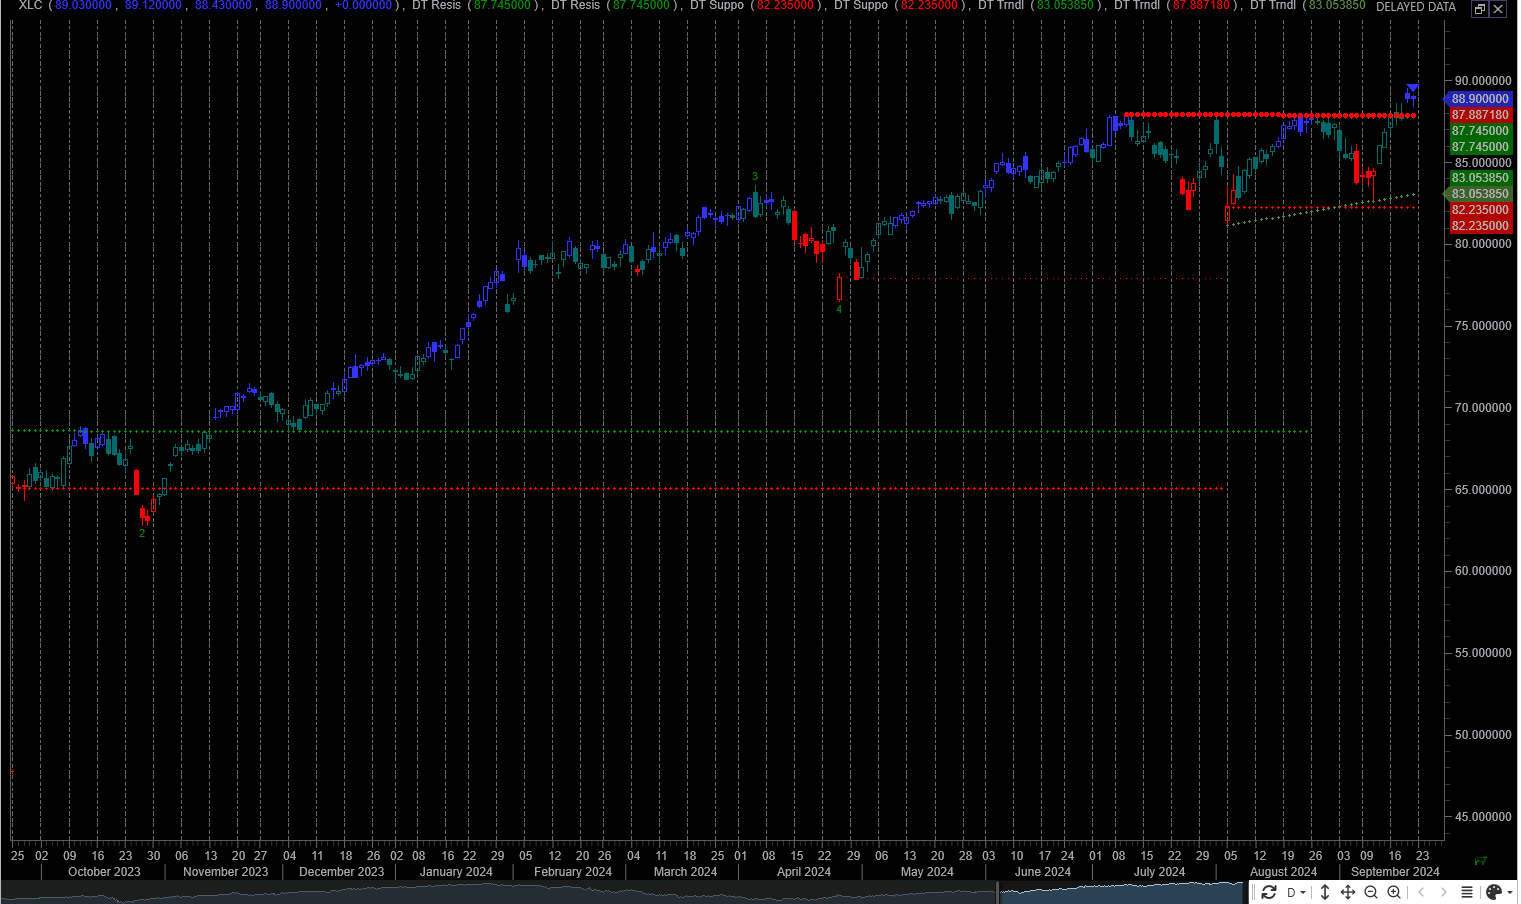
Communications
The communication sector is represented by the XLC It represents 10% of the S&P 500. This is moved above a trendline.
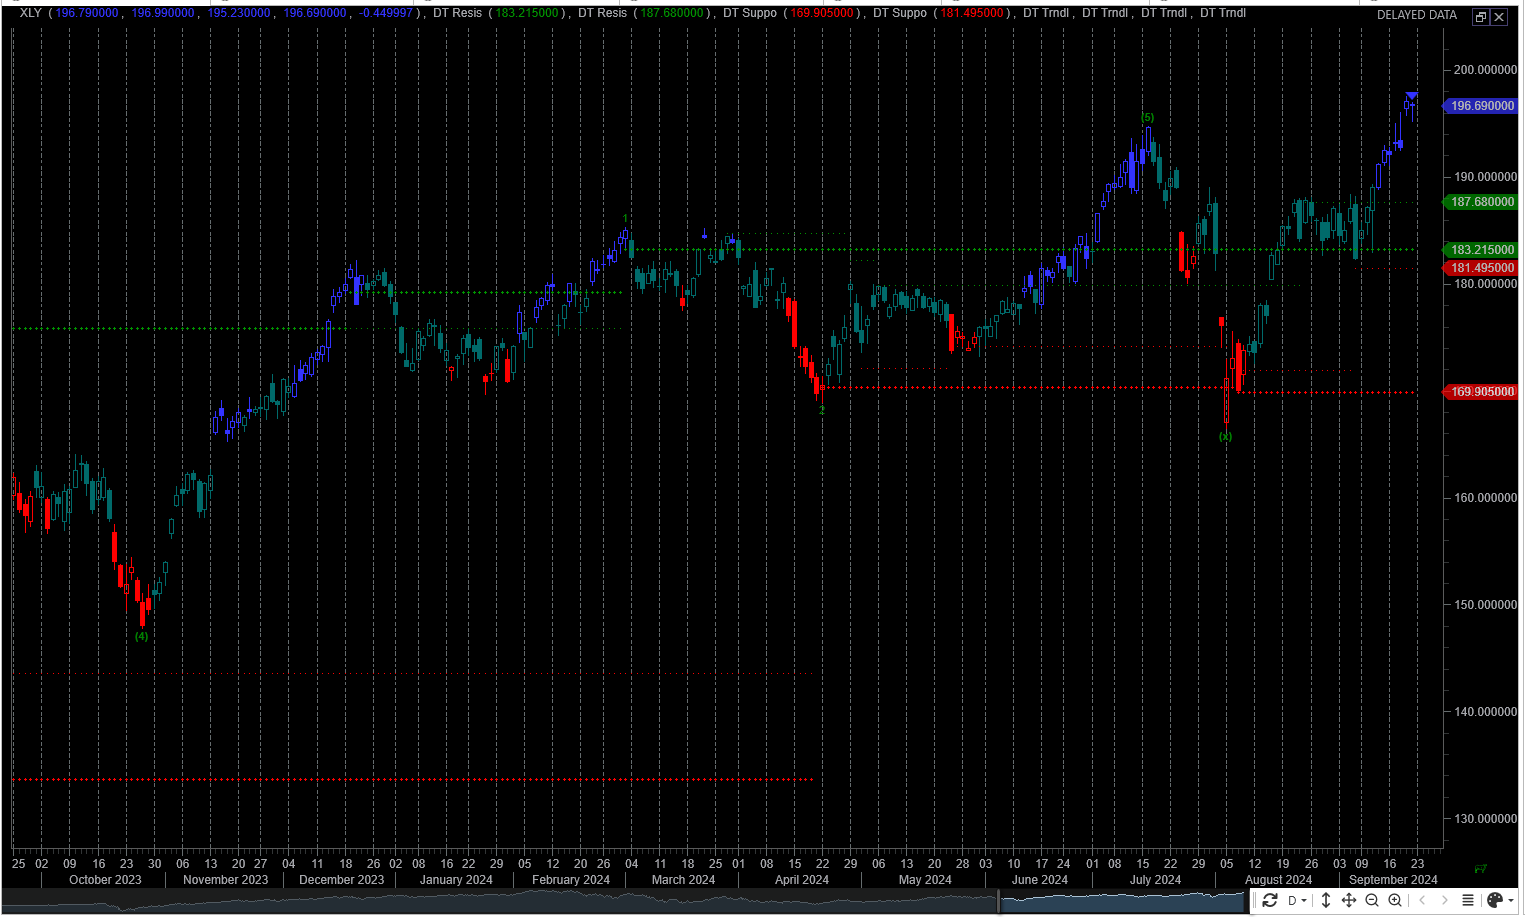
Consumer Discretionary
This sector is represented by the XLY ETF. It represents approximately 10% of the S&P. It is trending higher and has made a new high this past week.
Industrial Sector
The industrial sector as represented by the XLI. It represents 8% of the S&P. It is has made new highs.

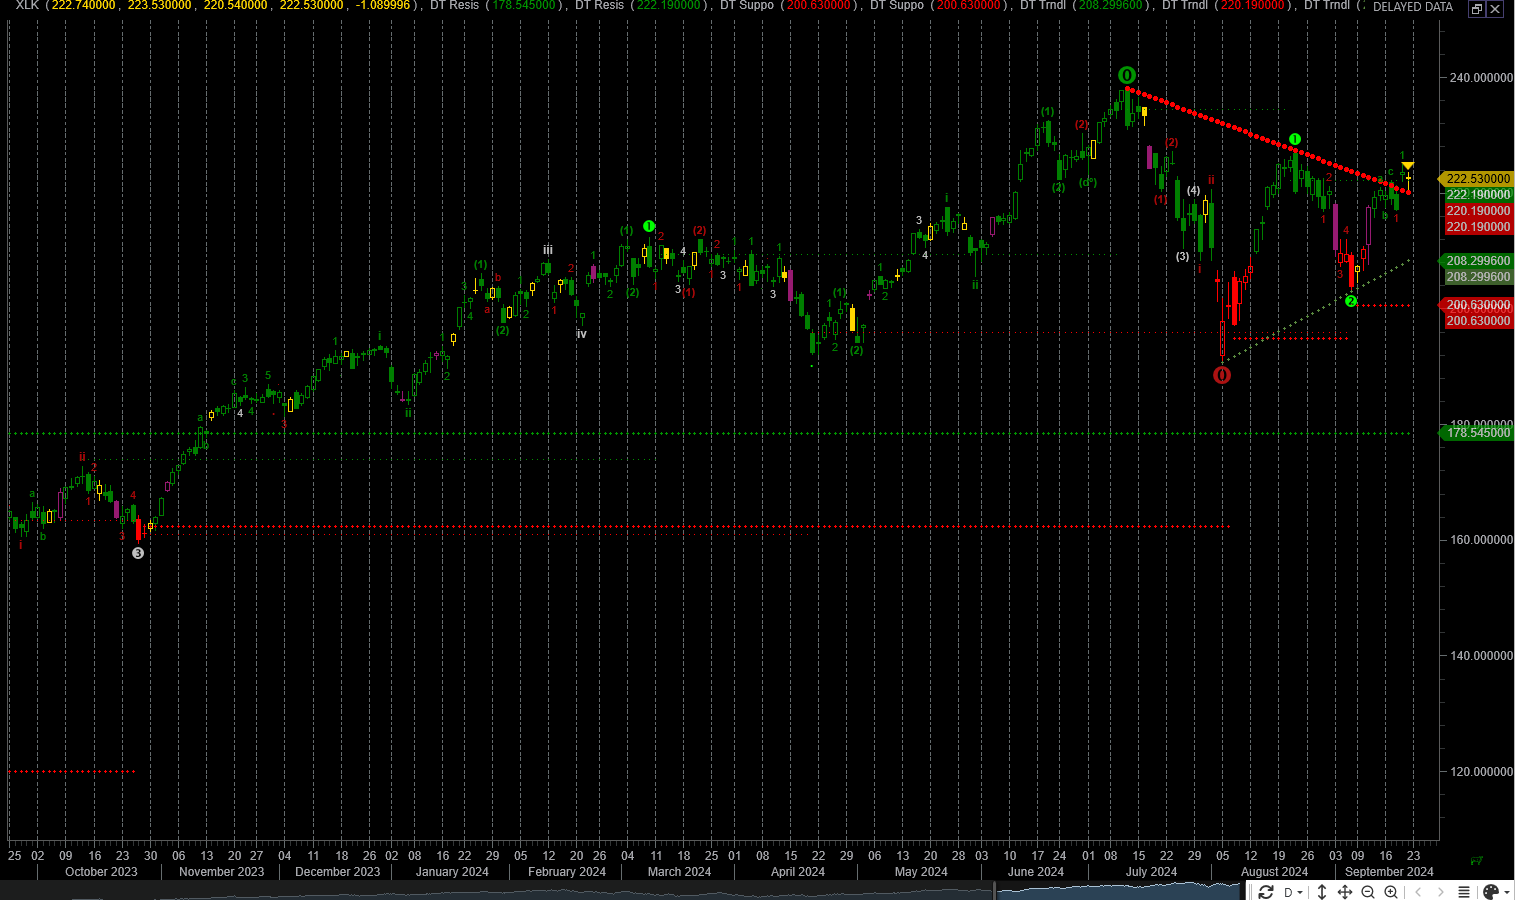
Technology Sector
This is the largest sector of the S&P and mimics the same pattern as the nasdaq 100. It represents 31% of the S&P. It has broken above a key trend resistance level.
Where we go from Here…
The S&P 500 has moved higher this past week and has made new all time highs. It is very hard to be bearish with the aggregation of all the sectors moving higher. The most significant one begin the technology sector.
Overall the market is showing mixed signals currently. From the daily chart, I believe it is showing a pause before we move higher. The weekly chart is strong and I believe the S&P 500 will go higher in the coming weeks. The COT reports are showing the S&P 500 is getting liquidated. From a longer term perspective caution is required.
From a seasonality perspective, this week tends to be a bearish week. Last week the Sept futures contract expired, and thus the December contract commenced trading. When trading begins in the new futures contract a large spread will initially exist relative the S&P 500 cash market. As the futures contract moves towards expiration, the difference between the cash market and the futures market declines till finally the difference is 0.
Therefore there will be a gap in price when the old contract closed and new contract opened. This price differential when the new contract starts trading is approximately 60 points. There is a strong tendency for this new contract to fill the price void left by the old contract.
My expectation is that this get will get filled this week and I will trade accordingly.
The Weekly Plan
I have a couple medium term trades ( approximately 4 weeks out ) that have an expection for the S&P to stay within a range that is below the current price.
For trades this week, I am looking at the following scenarions:
If S&P 500 futures is above 5800.
Look for only long trade setups
If S&P 500 futures is below 5720
Look for only short trade setups
Good Luck, stay safe and have a successful trading week.
Thank you for reading my weekly plan.
Joel