Weekly Plan for September 29
Typically September is a seasonally down month of the year, however the S&P continued it upward ascent.

Summary
Election years typically have higher volatility. The chart below shows the S&P return over the last six presidential election cycles.

Also of importance is that over the last 40 years the S&P 500 fell within 3 months of a new loosening (rate-cutting) cycle when the first rate cut was 50 basis points. These rate cuts often occur in response to economic stress, leading to volatility and declines in the short term.
In the chart below is a summary of how the S&P 500 performed after 3 months of a rate cutting cycle.

This past week saw the s&p 500 make another all time high, however I believe October will see an increase of volatility with both the S&P and Nazdaq 100 declining.
Summary of Nasdaq 100 Performance after the Federal Reserve begain with a 50 Basis Point Rate Cut:
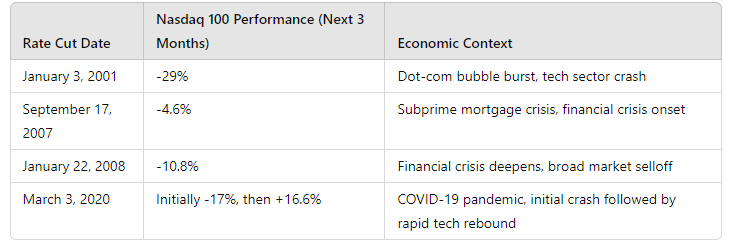
The key takeaways is the Nasdaq is even more sensitive to the initial rate cuts as compare to the S&P 500.
For the longer term outlook, it really depends as to whether you believe that inflation is under control and unemployment is getting managed effectively.
I believe it is time to get cautious in the US markets.
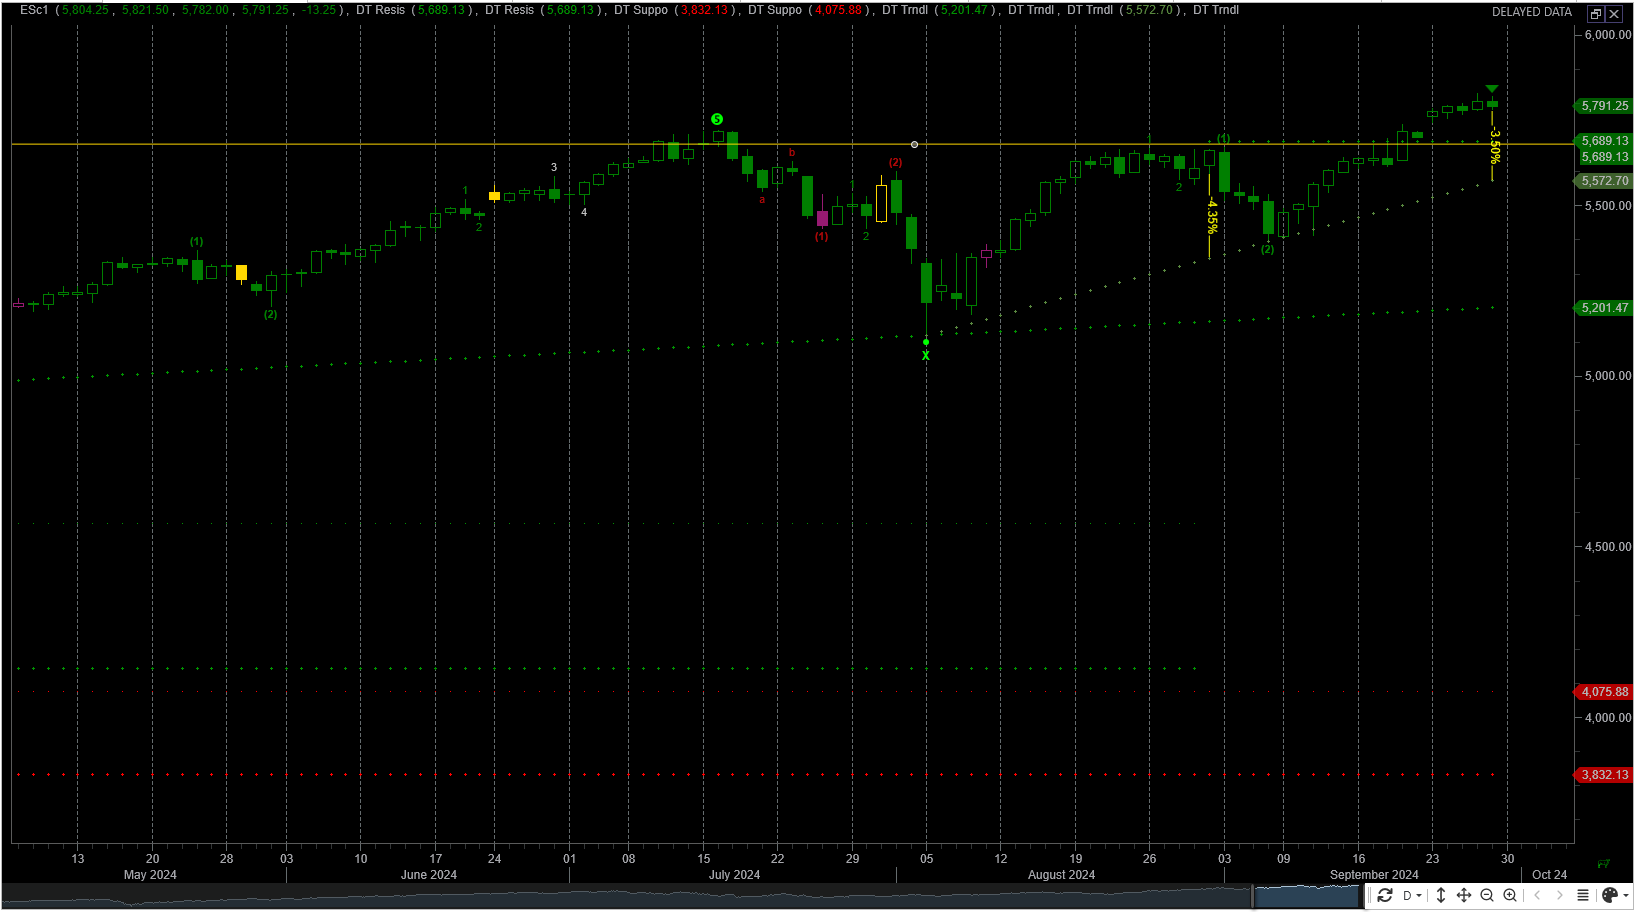
S&P futures Contract Chart
Daily Chart of S&P Futures
At the end of August 2024, the S&P was approximately 4.5% above the daily trendline before declining to it. Currently the S&P is approximately 3.5% above the trendline.
My potential targets are:
5689 This was a prior area of support.
5572 This corresponds to the daily trend line.
5190 This corresponds to the weekly trendline. Price has bounced off this trendline twice since forming in May 2024.
S&P futures Weekly chart
In August the S&P futures touched the trendline. Prior to touching it was extended approximately 9.5%. Currently the S&P is extended by 9.75%. Therefore i expect a reversion to the mean, with price moving towards the trendline.
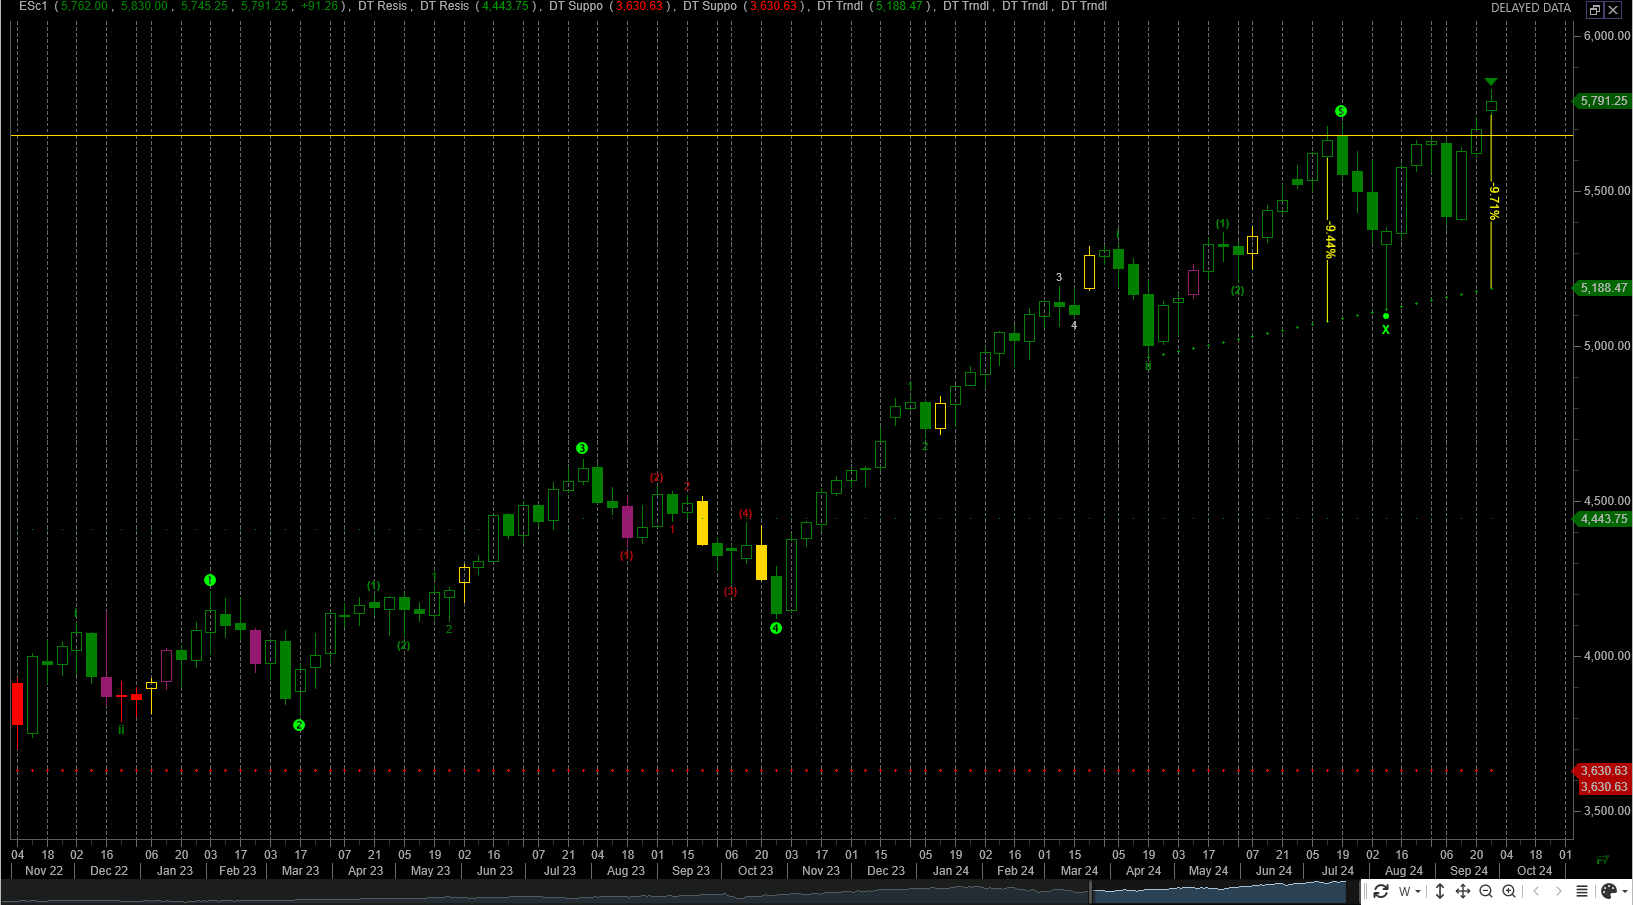
I do not expect this to be end of the rally in the S&P. I see this as a pause into the US election in Novermber.
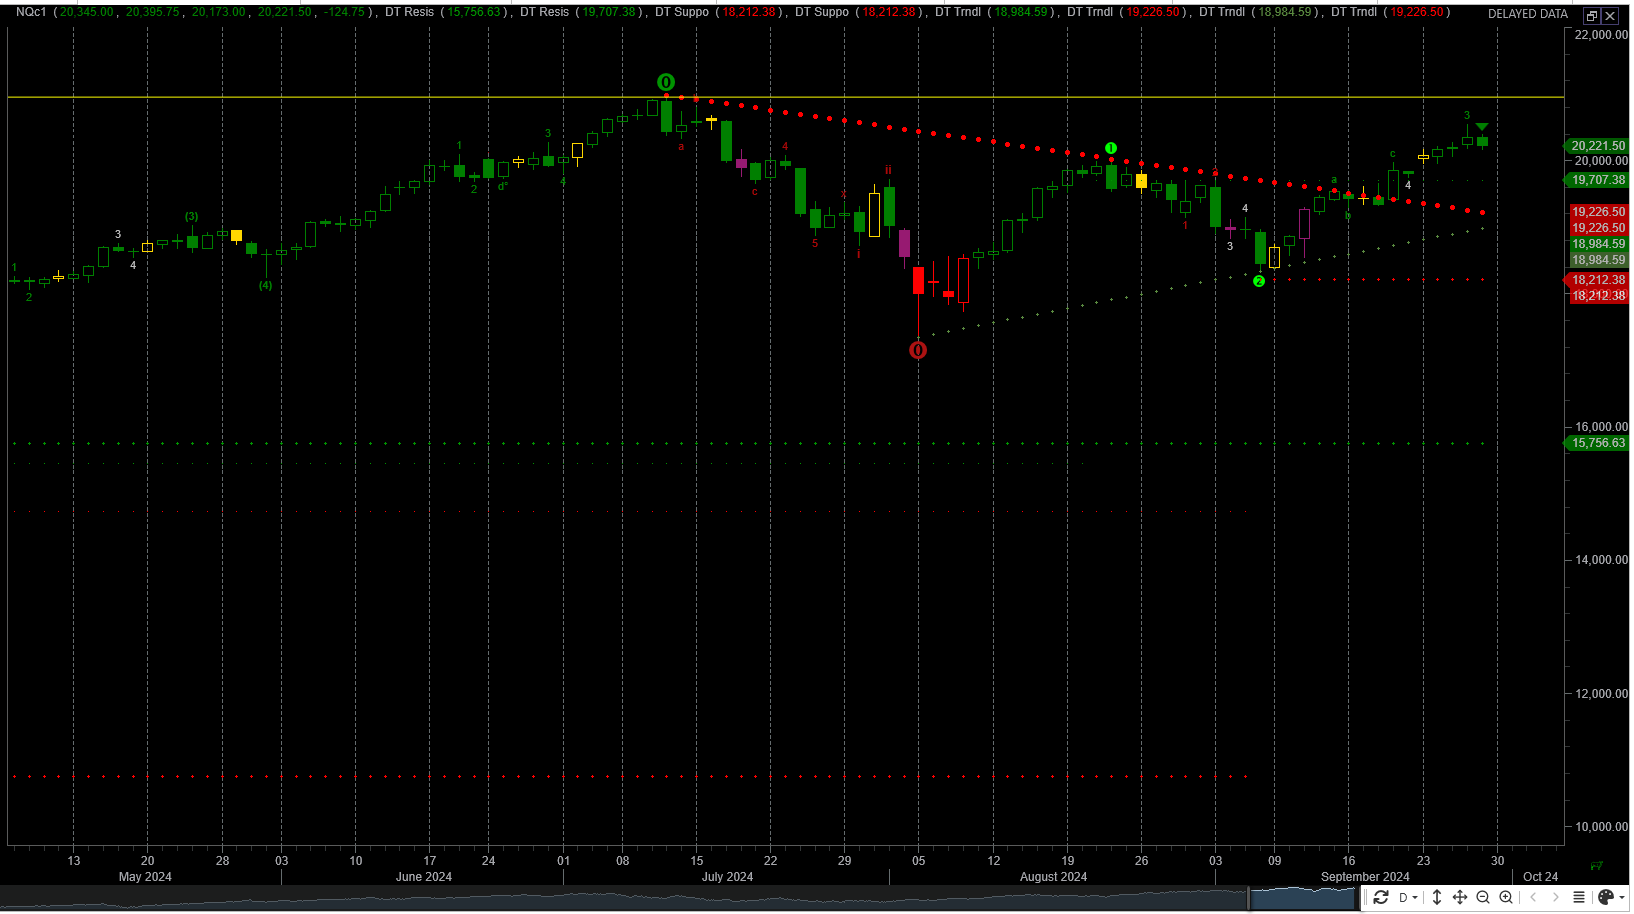
NQ futures Chart
The NQ broke above a trendline drawn from the July 11 high. It is approximately 3% below the all time high.
Where we go from Here…
There are gaps below the current price in the S&P chart. Potentially we could see the price swiftly move through these levels.
The VIX (volatilty index) increased by 10% on Friday, with a small change in the price of the S&P.
JP Morgan fund (JHEQX) will rebalance its large option trade and sell options for the end of the fourth quarter. This is used as a hedge. The resulting hedging can have a significant influence on the market.
The Weekly Plan
I have a monthly trade which expects the S&P to go either down or sideways.
For trades this week, I am looking at the following scenarions:
If S&P 500 futures are above 5750.
Look for only long trade setups
If S&P 500 futures is below 5700
Look for only short trade setups
Good Luck, stay safe and have a successful trading week.
Thank you for reading my weekly plan.
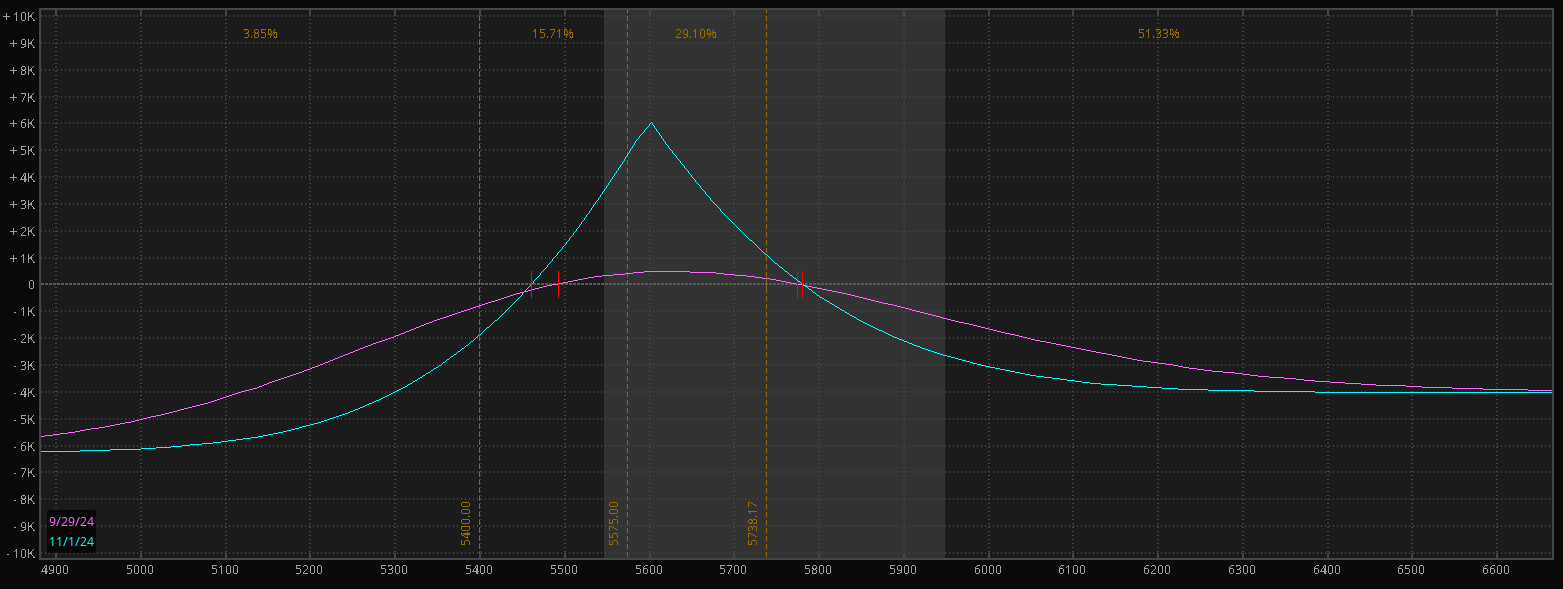
Sample Weekly Idea
A sample trade in the S&P 500 that makes money with an increase in volatility in the short term. The trade is:
Place a long PUT Calendar spread in the S&P cash index. This involves selling
Sell 1 Oct 31 5600 Put
Buy 1 Nov 29 5600 Put.
The area under the triangle is the profit zone. The trade profits when the SPX (S&P 500) is between 5775 and 5450.
The trade makes money by an increase in volatility along with time decay. The earlier dated option declines in value faster than the later date option.
Trading involves Risk. Please do your own due dilligence before you attempt to trade.
Joel