


Weekly Plan for September 8
The market falls out of balance. Will the downdraft continue this week? I am providing my trading plan for this week.

Summary
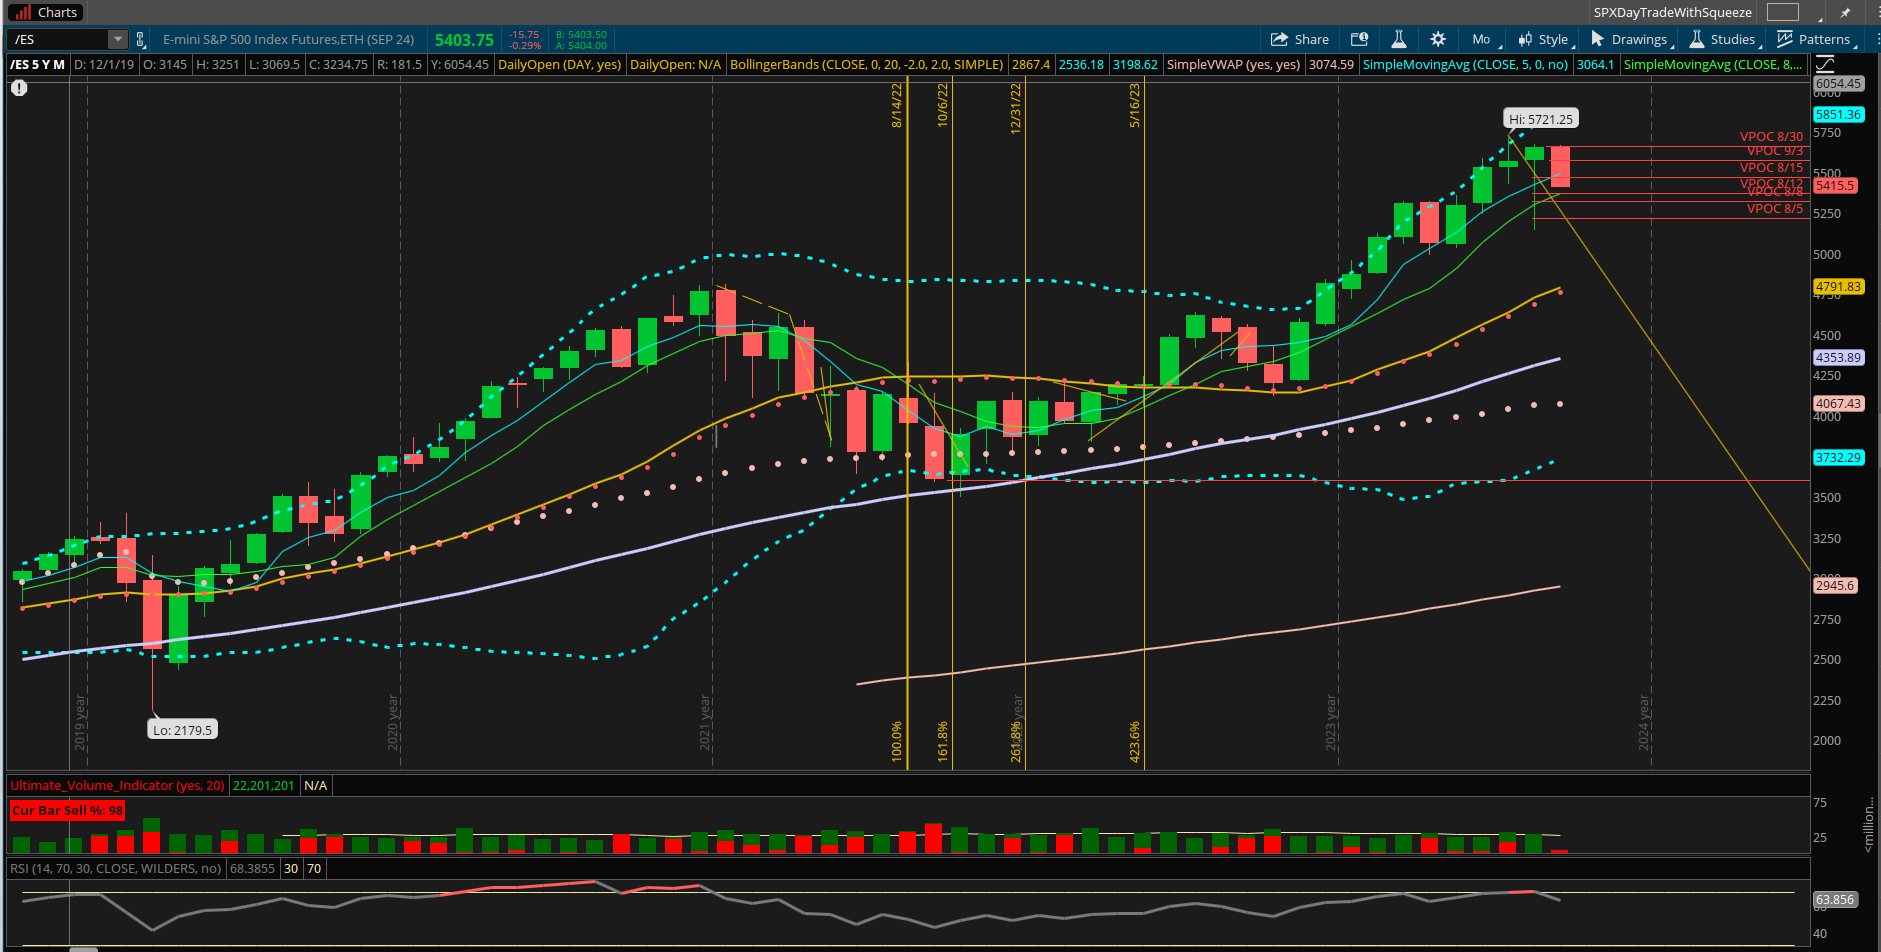
The S&P futures market had been in balance for 9 days. On return from the labor day holiday balance broke down to the downside. The highlighted area shows the balance area and below is the subsequent breakdown.
The graphic represents the volume profile for the S&P futures. We can see in the graphic that price made lower lows each day. Additionally we can see that the highest volume area moved lower each subsequent day. This is represented by the pink/green across each bar.

S&P futures Chart
The S&P futures fell each day of last week.
The highlighted area is expected area to end the decline. My expectation does not mean it will stop there, however there is good probability it will.
The highlighted area has two points of confluence. They are the following:
It represents the 50% fibonocci level from the August 5 low to the most recent top. I have drawn an arrow of the most uptrend.
It also represents the lower level of the bollinger band. This is a statistical reference based on volatility.
Both of these indicators lead me to belive that the S&P will pause here.
Daily Chart of S&P Futures

September Monthly chart of S&P Futures
The significant events for this week are the following:
9/11 August CPI report
9/12 Unemployment report
9/12 Core PPI
On Friday the number of revised jobs created for July and August was lower. The Federal reserve uses this as part of its mandate to control interest rates.
On 9/18 the Fed reserve has a Meeting where rates cuts may occur. The Federal reserve has already hinted that they will start lowering rates. The current projection is between 25 to 50 basis point change in the target rate.
Typically, when the Fed begins lowering rates, it is indication that economy has already fallen into recession, and the S&P will move lower.
Over the last few months the number of jobs created has repeated been revised lower. This is one data point indicating that US economy is either in recession or moving towards recession.
NQ futures Chart
The nazdaq futures are currently at the 61.8% retracement of the recent move from August 5 to August 21. I have depicted the most recent up move with the arrow. The boxed area shows the distance to that recent low from the current price. Generally, when price falls below the 61.8% level it will complete retrace to the prior low.
Earlier in the year, the nazdaq was the leader, and now is the laggard. This can impede the progression of the S&P 500.

SMH Chart
The semiconductor chart looks similar to the Nazdaq chart. NVDA is the major component in the space. The semiconductors stopped at the 200 day moving average.

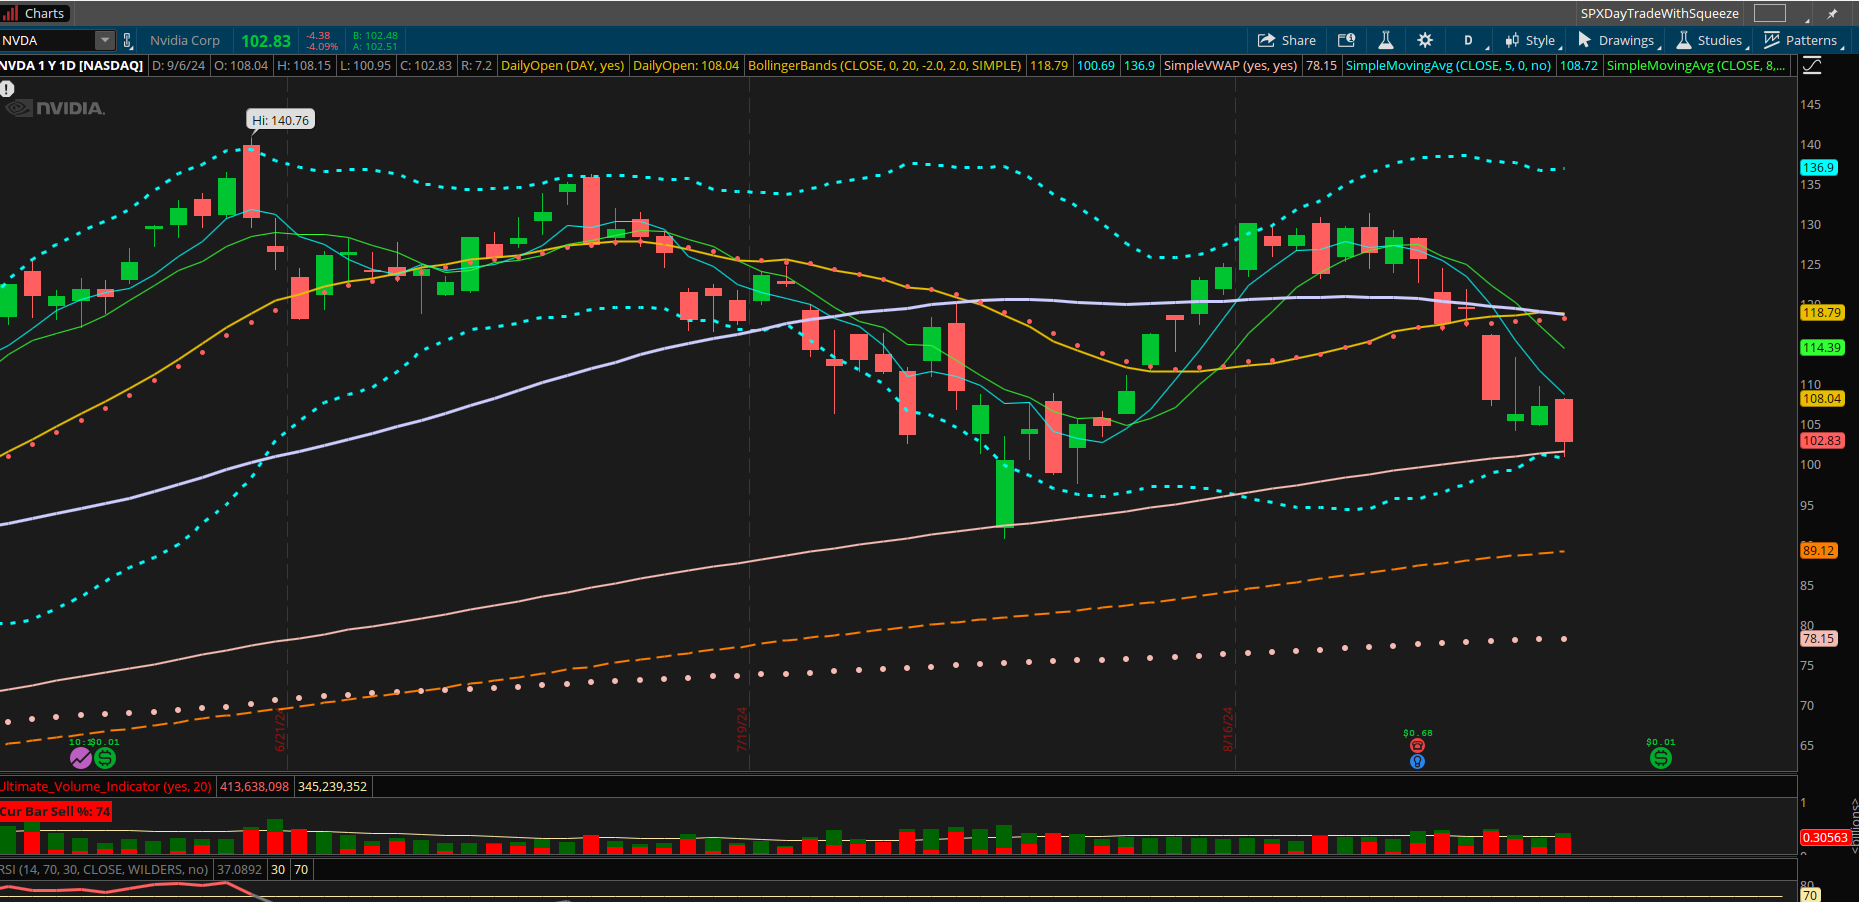
NVDA
NVDA had good earning results yet the stock sold off. The expectation for the stock was very high. This is potential drag on both the Nazdaq and the S&P. The stock has moved to the 150 day moving average. This could be a potential area where price stops going down. NVDA accounts for 3% of the S&P market cap. This past week NVDA moved 13% lower.
I would not be a buyer here as price is below all shorter time frame moving averages.
So what is driving the S&P now.
The S&P is derived from both growth and value components. As pointed out earlier, the technology or growth area is showing weakness. This past week had all the sectors move lower. All sectors were highly correlated and everything sold.
Healthcare
This represents 12% of the S&P. Profit taking has occured and it stopped at its 20 day simple moving average.

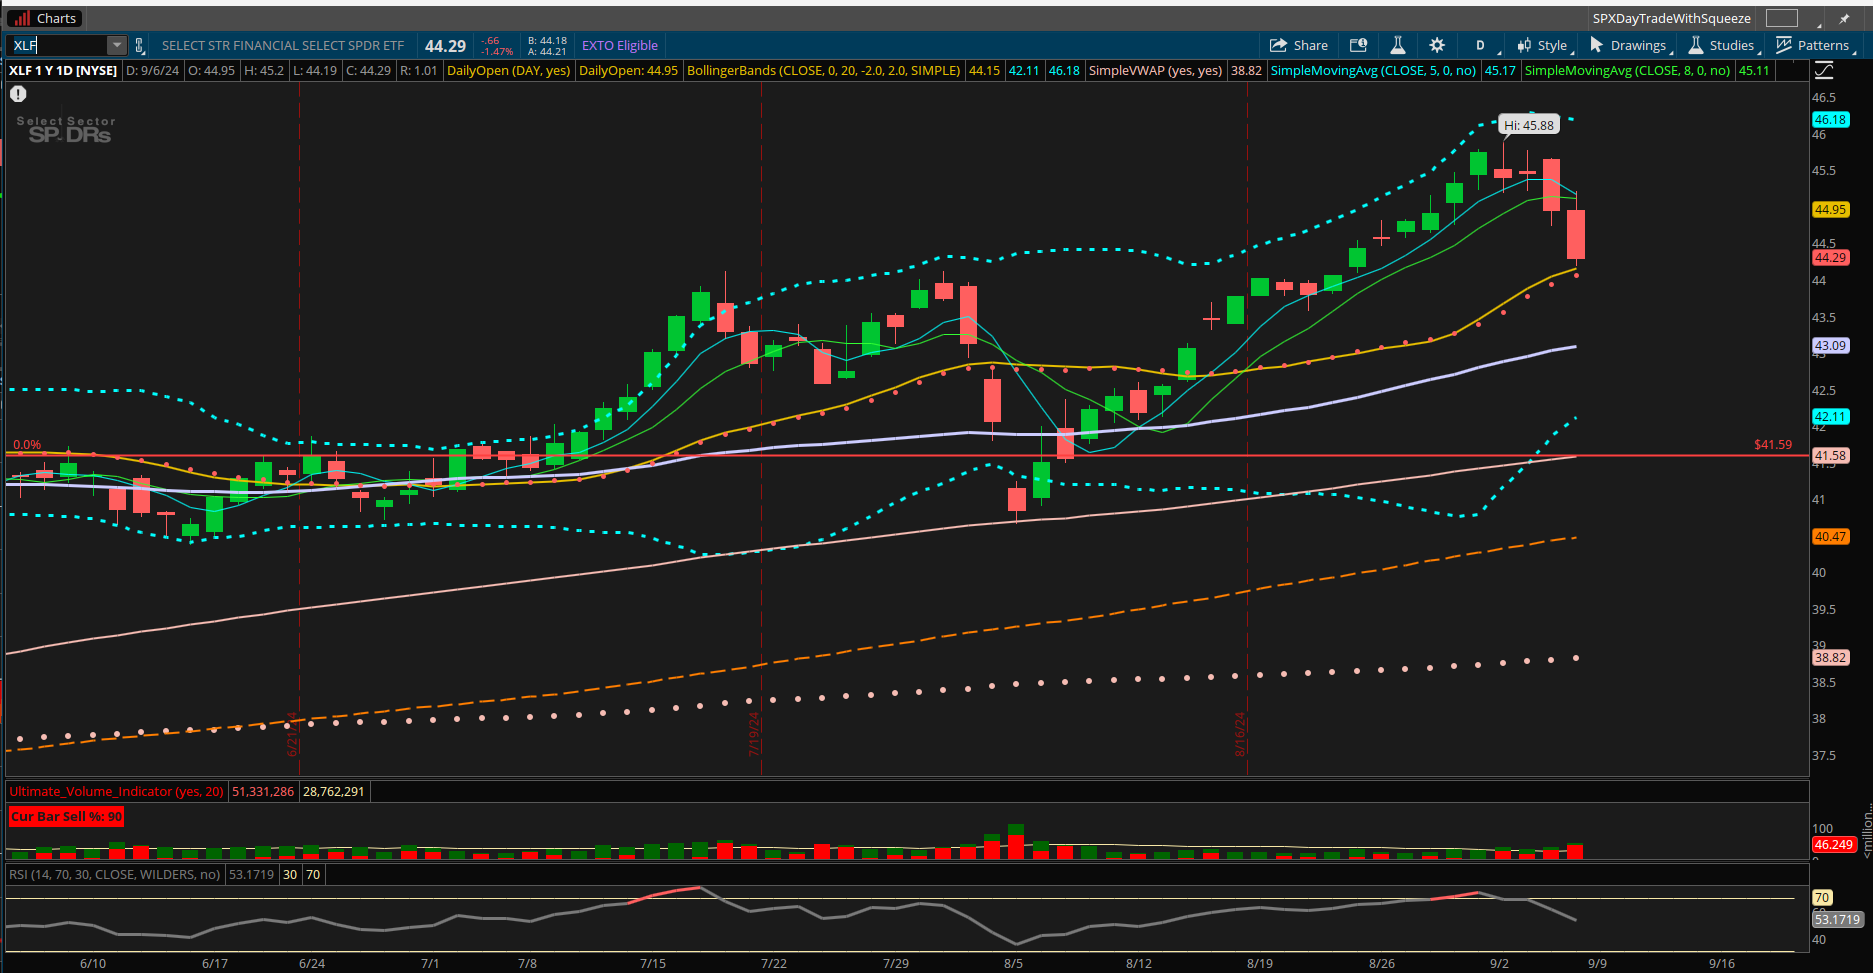
Financials
This sector represents 10% of the S&P. Profit taking has occured and it stopped at its 20 day simple moving average.
Communications
The communication sector is represented by the XLC It represents 10% of the S&P 500.. This looks like it will target its 150 day simple moving average as highlighted below.

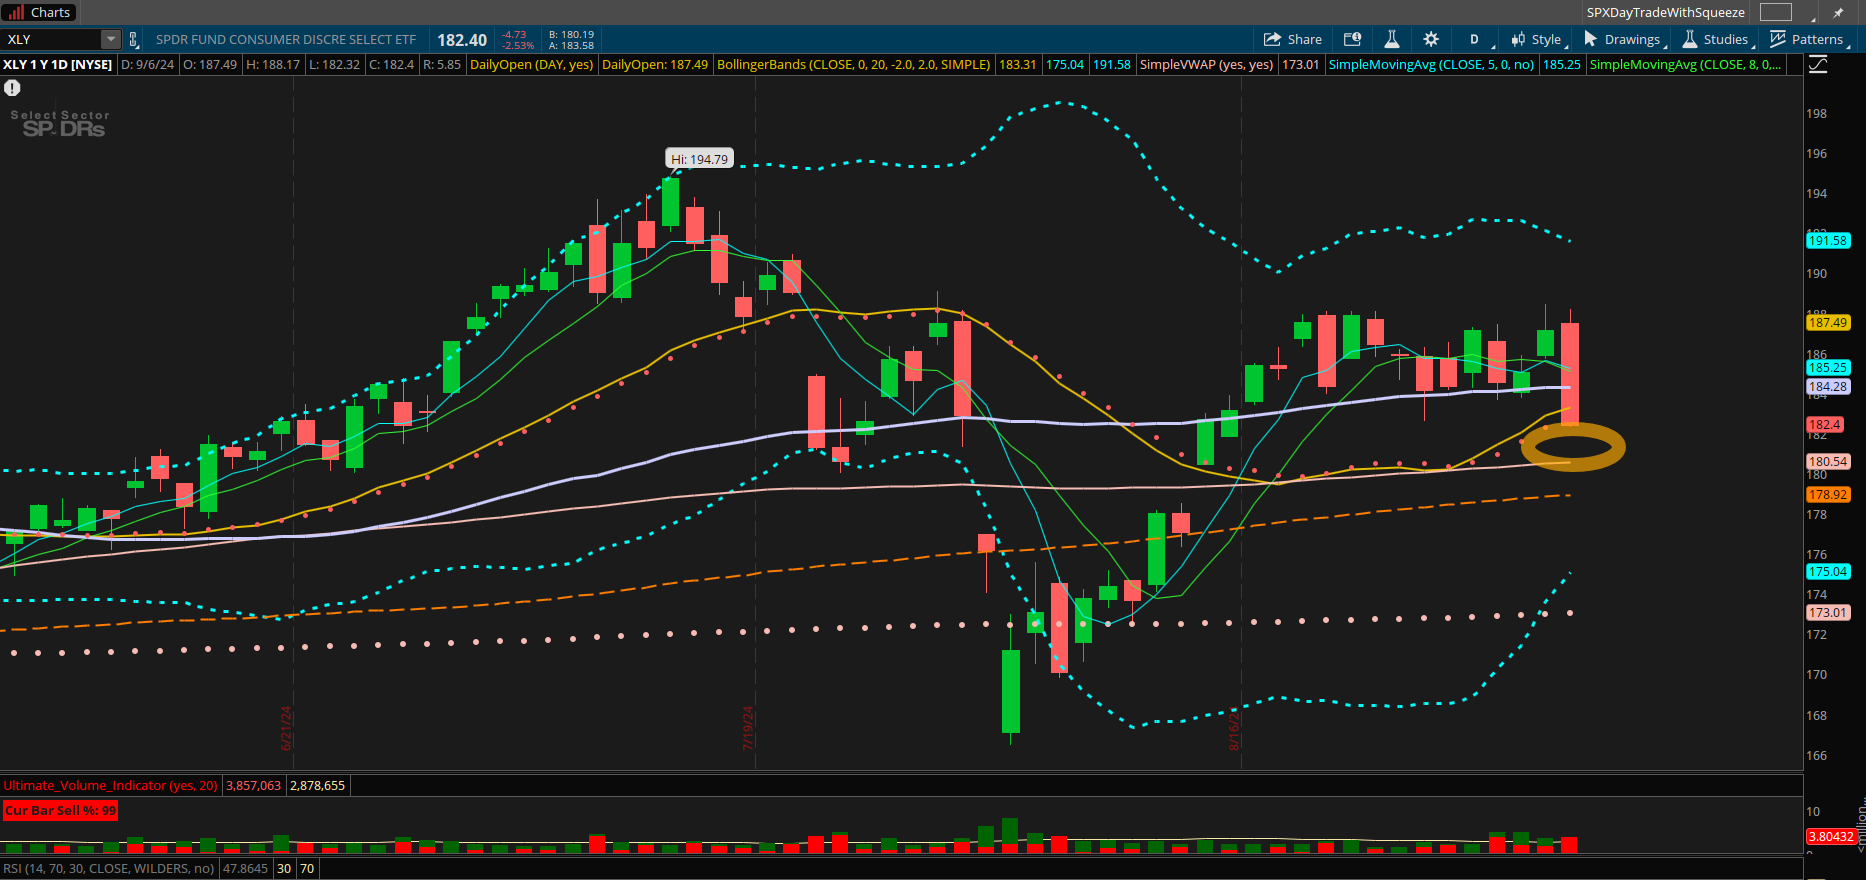
Consumer Discretionary
This sector is represented by XLY ETF. It represents approximately 10% of the S&P. It appears ready to target its 150 day simple moving average.
Industrial Sector
The industrial sector as represented by the XLI. It represents 8% of the S&P. It appears to be close to its 50 day simple moving average.

Technology Sector
This is the largest sector of the S&P and mimics the same pattern as the nasdaq 100.

Where we go from Here…
The S&P futures has declined nearly 250 points in the last 4 trading days. I expect a pause in the 5350 - 5375 area. The chart below represents a daily chart showing how far price has moved from the trendline. For this week, i expect price to move towards 5450 to 5500 before it continues its decline to 5130 to 5160.

Currently, I am mostly in CASH. I had put on some short SPX trades last week and took them off within a day as targets were met.
Additionally, I am not placing any large trades and only scalping the price action in the S&P on a daily basis.
The Weekly Plan
I expect the S&P to initially target the 5350 - 5375 area before it makes a bounce to the 5450 - 5500 area. Once the S&P hits those higher targets I expect a decline and will execute short term shorting plays. The short term target is to hit the August 5 lows.
I strongly believe one most be extremely cautious at this time as price swings are large in both directions. Currently, market makers/dealers are trading in the direction of market participants. By doing this moves will make extreme moves both higher and lower.
Good Luck, stay safe and have a successful trading week.
Thank you for reading my weekly plan.
Joel
