


Weekly Review for August 25
Market in balance. Waiting for a new catalyst.

Summary
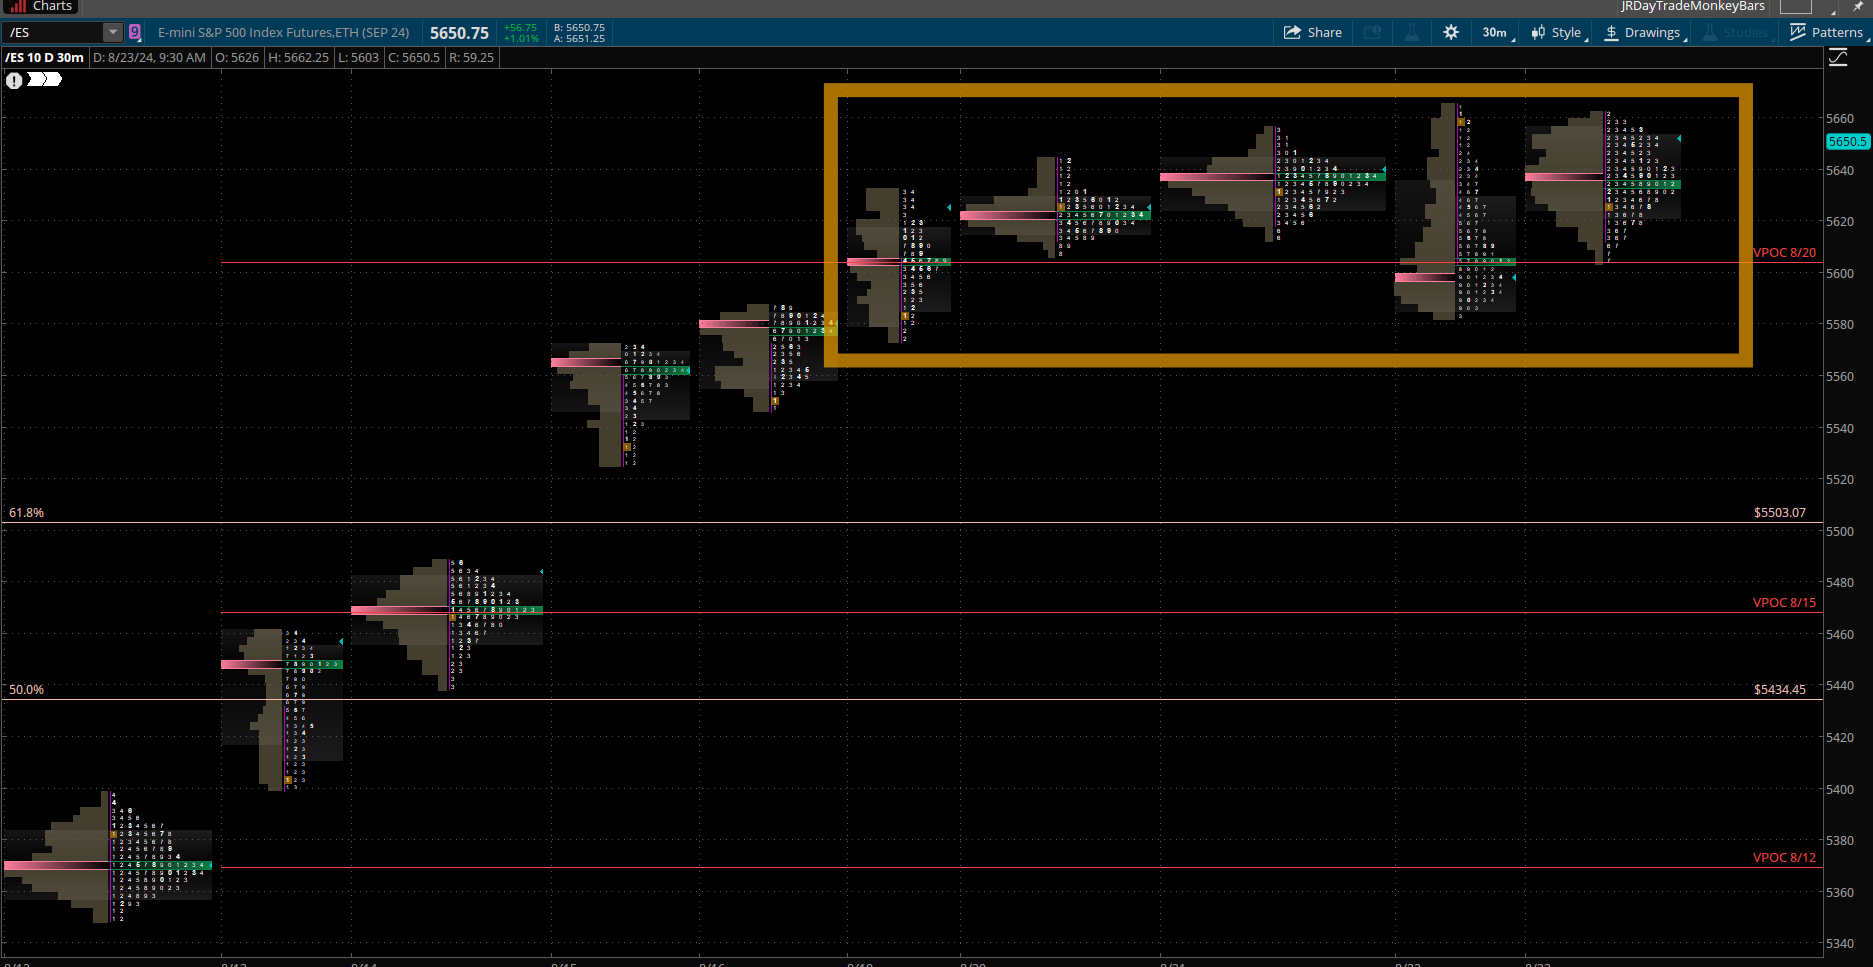
The S&P futures market has been in balance the past five days. The volume profile graphic shows the market is in a distinctive range waiting for a new catalyst. This is highlighted.
There are a couple potential catalysts which could move the market. One is the earnings report for NVDA held on August 28 after the market closes. The other is CPI on August 29.
The technology sector noted as the XLK ETF makes 33% of the S&P 500. NVDA makes up 20% of the XLK. MSFT also makes up 20%. Therefore 40% of this ETF is made up of 2 stocks.
S&P futures Chart
The S&P has nearly retraced nearly 100% percent of the drawndown that ended 8/5/2024. The S&P has retraced more than 62% of the move lower. I expect the S&P to continue to melt up to the most recent high or even exceed it.
I have highlighted two areas. The top area represents the distance to the new high. The circled area below represents the gap over the trendline. As September is seasonally bearish, i expect the lower gap to get filled.
Two significant events in September may lead S&P lower gap getting filled.
On 9/6 the BLS unemployment rate. This is a datapoint watched by the Fed. If the expectation is
On 9/18 the Fed Meeting. The Federal reserve has already hinted that they will start lowering rates.
Typically, when the Fed begins lowering rates, it is indication that economy has already fallen into recession, and the S&P will move lower.

NQ futures Chart
The nazdaq futures have made a similar move as compared to the S&P. The relative strength of nazdaq is much weaker than the S&P. As the S&P is near a high, however is a number of percentage points away. The highlighted region represents overhead supply in the Nazdaq chart.
Earlier in the year, the nazdaq was the leader, and now is the laggard.

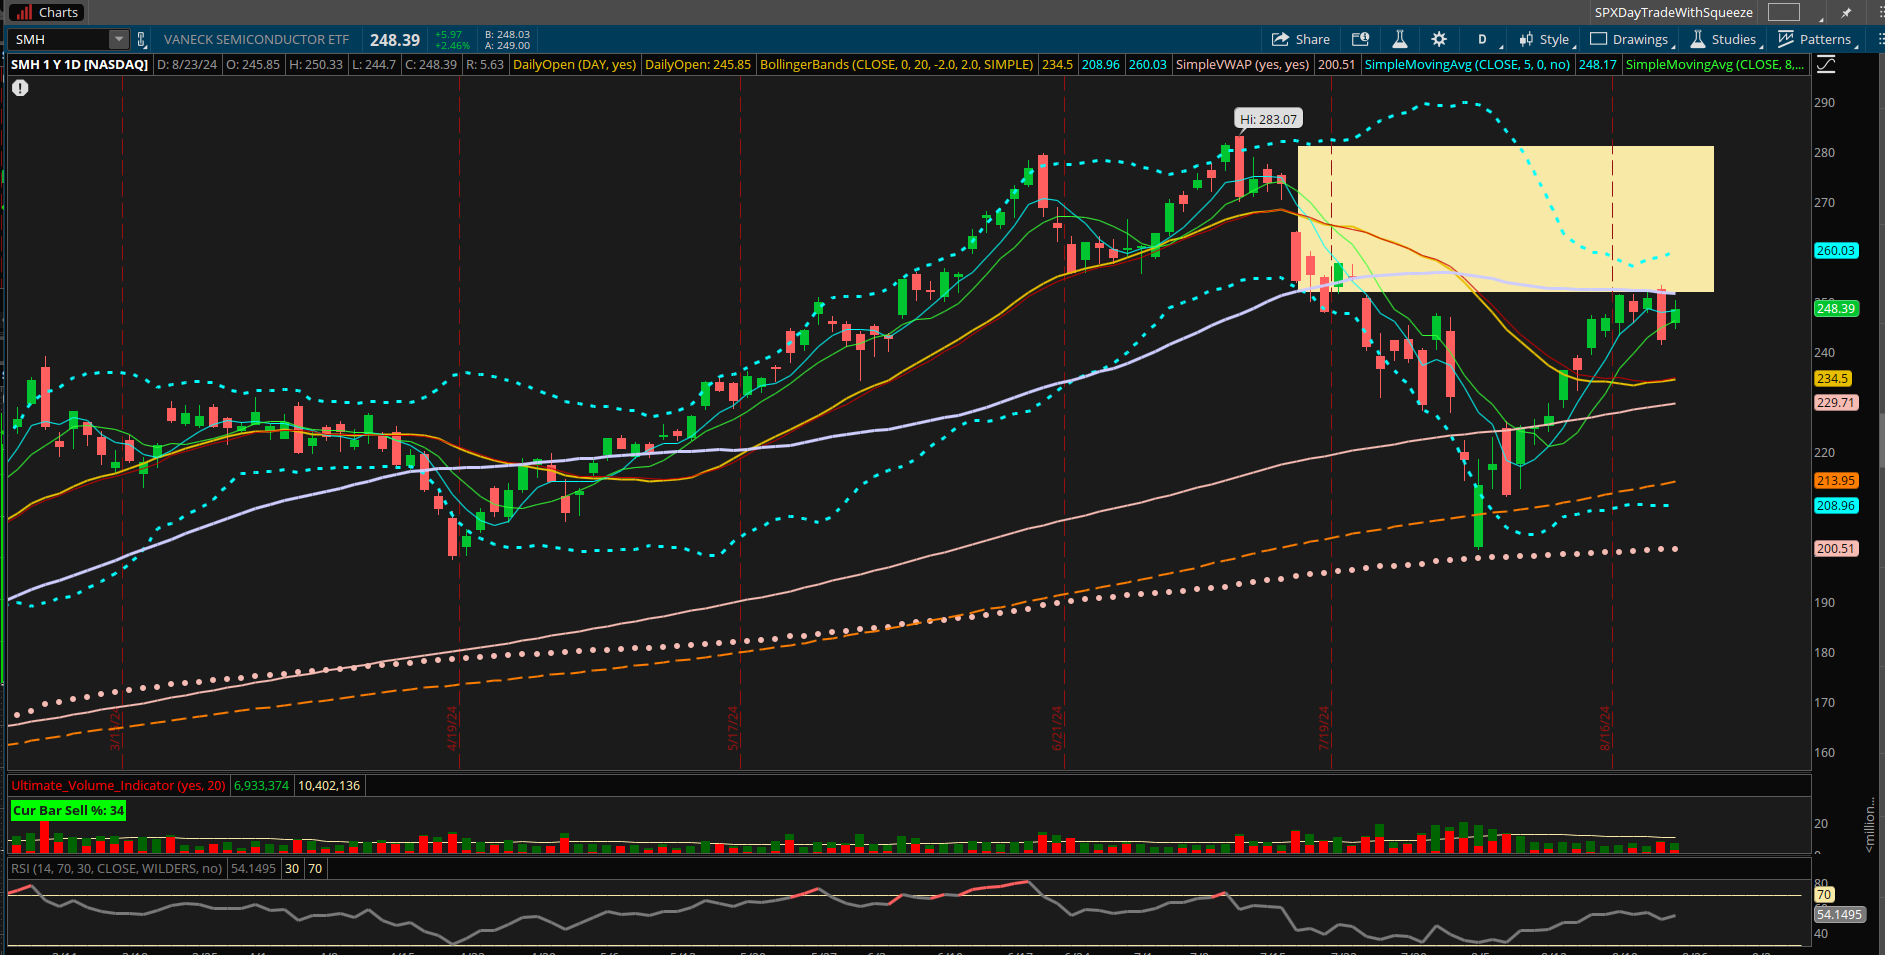
SMH Chart
The semiconductor chart looks similar to the Nazdaq chart. NVDA is the major component in the space and will drive the next move.
So what is driving the S&P now.
The S&P is derived from both growth and value components. As pointed out earlier, the technology or growth area is showing weakness. For the S&P to move higher and a weak technology component then the value area of the S&P is moving the index higher.
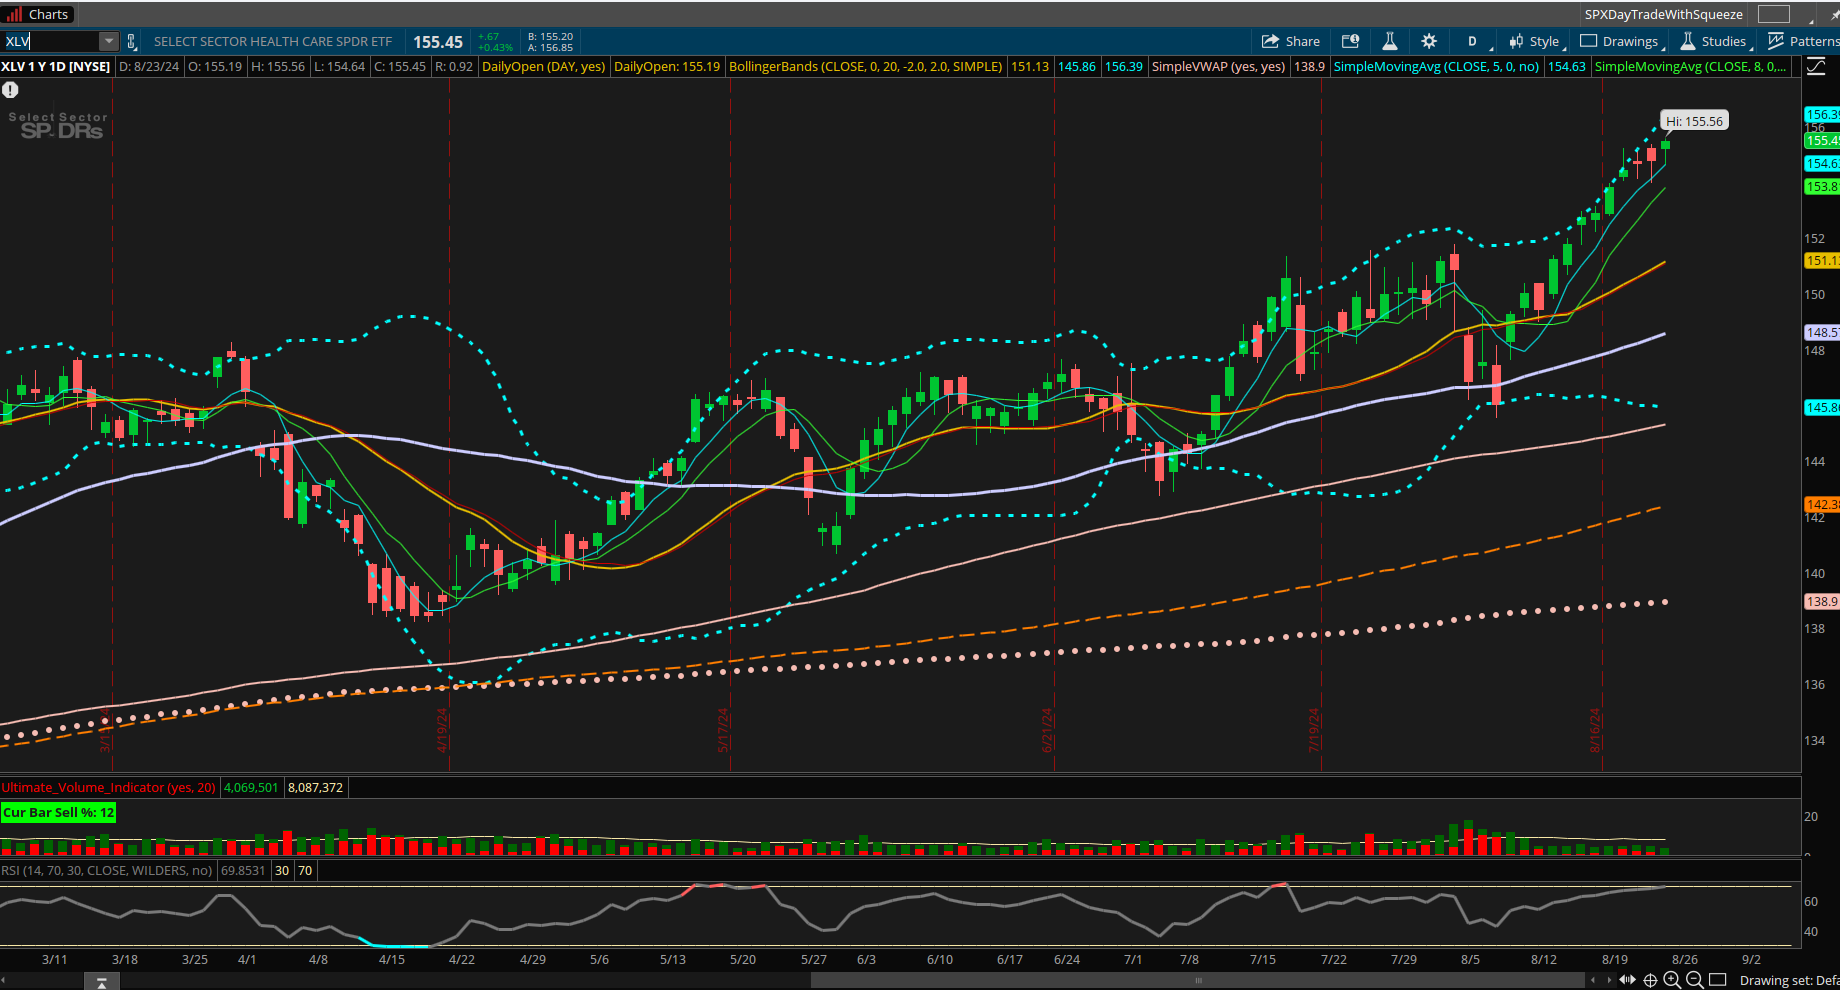
Healthcare
The healthcare sector as represented by XLV is making higher highs. This represents 12% of the S&P.
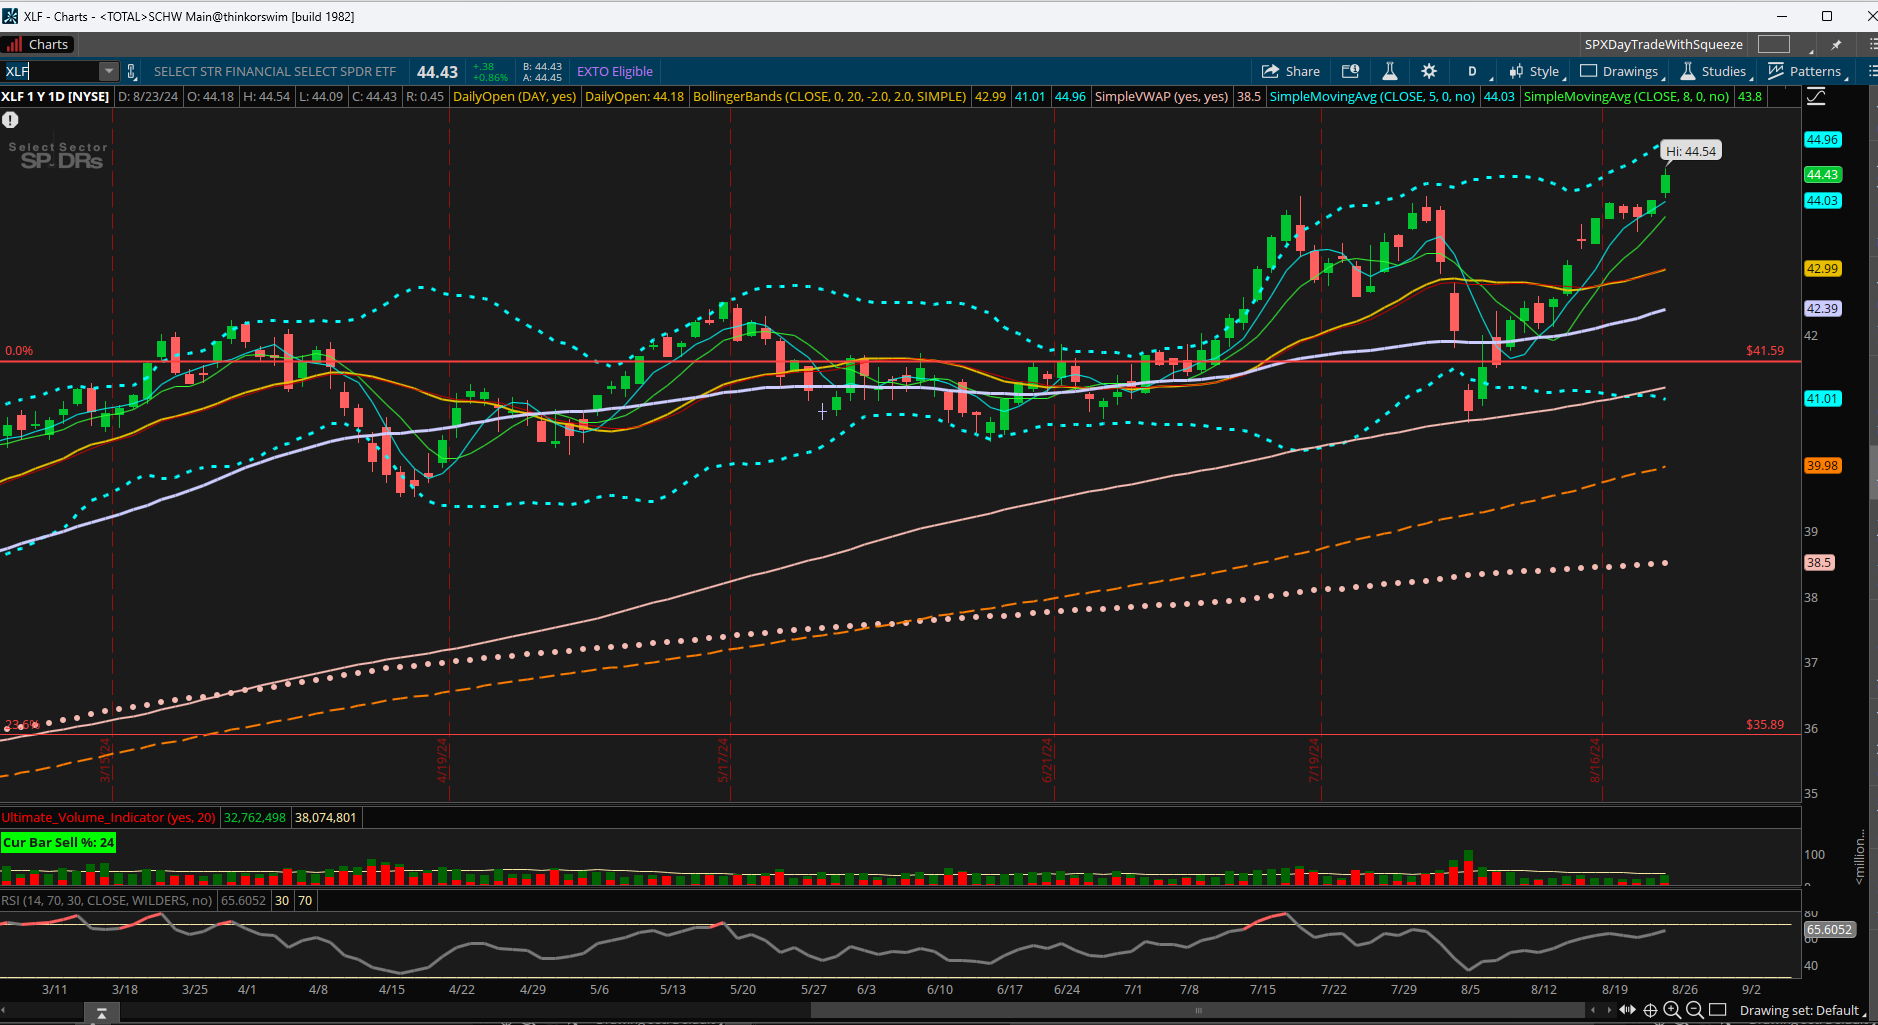
Financials
The financial sector as represented by XLF is making higher highs. This sector represents 10% of the S&P.
Communications
The communication sector is represented by the XLC. It is potentially topping here. It represents 9% of the S&P 500.

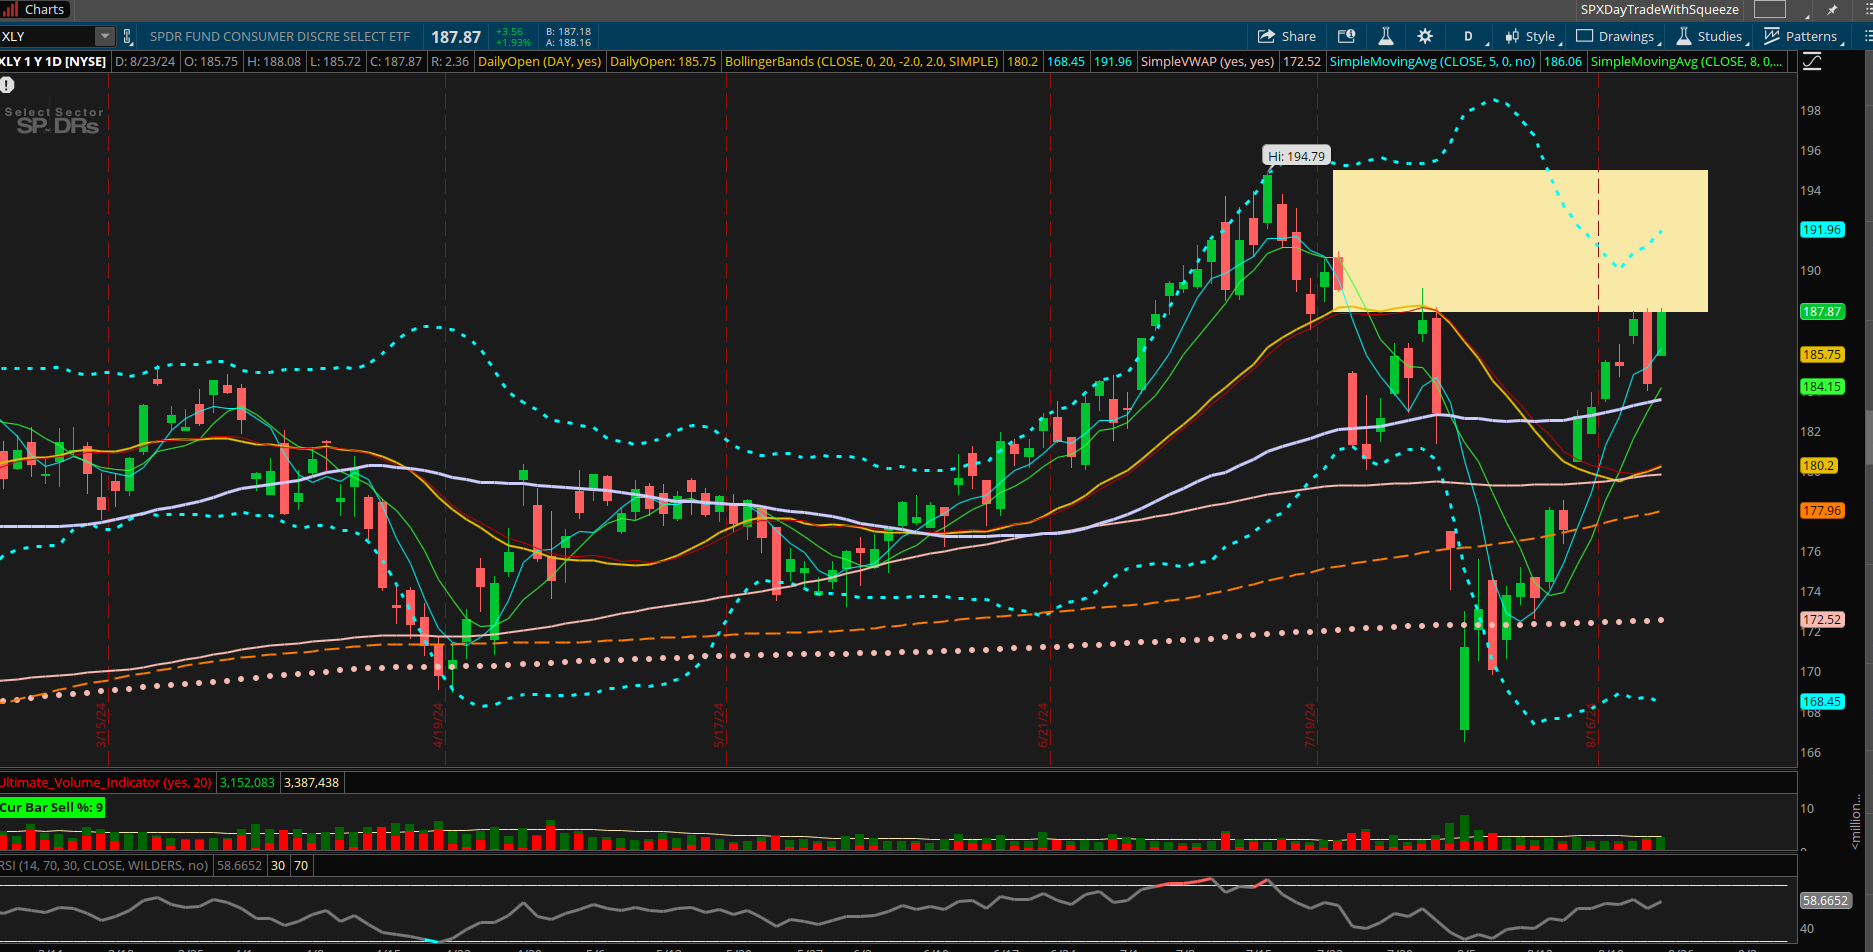
Consumer Discretionary
This sector is represented by XLY ETF. It is showing a large area of overhead supply. It represents approximately 10% of the S&P.
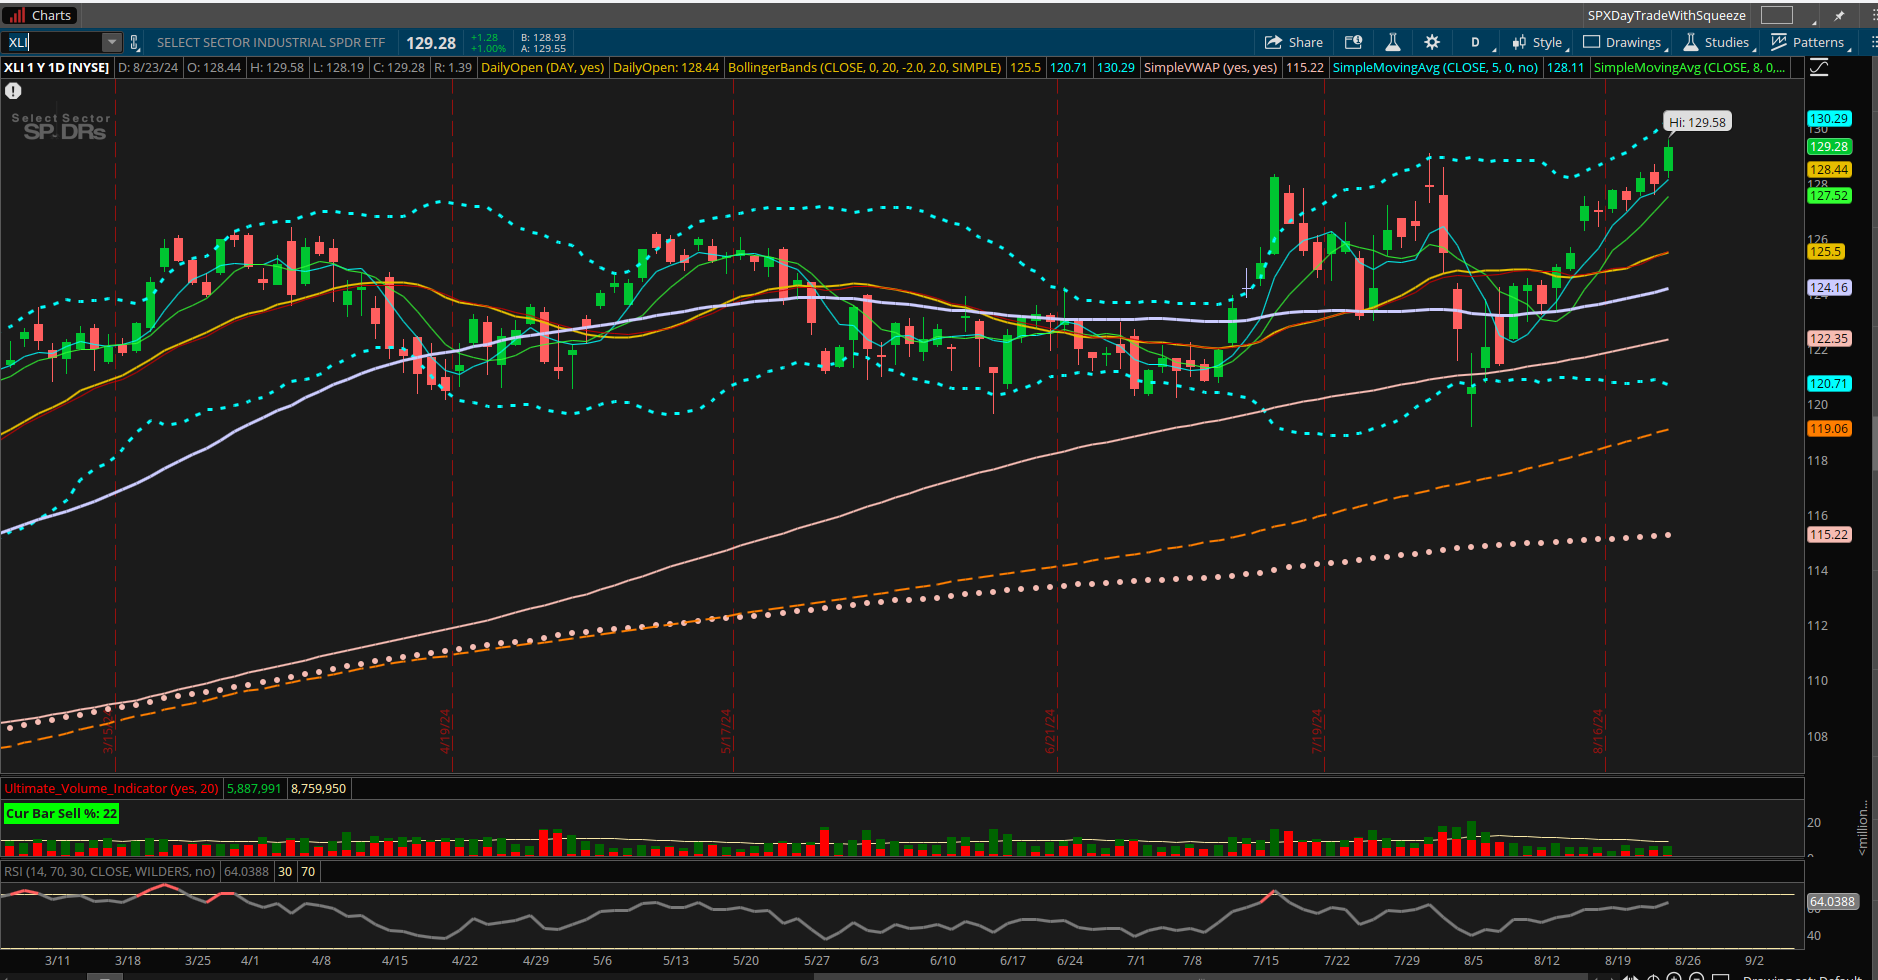
Industrial Sector
The industrial sector as represented by the XLI. It represents 8% of the S&P. It appears to be making all time highs.
Where we go from Here…
The chart below represents a monthly volume profile chart. I have highlighted June through August. The point of control (POC) represents the area of the largest concentration of volume. It is noteworthly to see that the POC has migrated lower during August. This implies that large players have been a net seller of the S&P.
The “V” shaped reversal observed is a momentum driven rally. My expectation is that sometime in the near future the August POC will get tagged. This is approximately 300 points lower at 5360.

Currently, I am mostly in CASH waiting for the S&P to trigger it’s next move. I believe we will see lower prices. I am NOT front running this price action and trying to pick a top. I will wait for the market to signal the next sequence.
The Weekly Plan
The expected range for the S&P is 165 points for the week. My expectation is for the S&P to slowly move higher.
Scenario 1
If the market breaks above 5581 I will only enter long trades. A target is 5650
Scenario 2
If the market breaks below 5561 I will only enter short trades. A short term target is 5450.
These potential plays are very short term, approximately one week.
Good Luck, stay safe and have a successful trading week.
Thank you for reading my weekly plan.
Joel