Weekly Plan for December 29
Are choppy markets ahead for this week? I describe my weekly plan with some thoughts on January 2025.

Summary
The market is in a seasonally bullish period where typically the last two weeks of December into the first few days of January has a positive drift. Liquidity is low as major market participants are taking some time off.
Management of last week’s plan
In last week’s plan, I was positioned in a neutral to slightly bearish trade for S&P 500. The market was in below its short term moving averages (5, 8, 20 simple moving averages). Positioning was bearish. I closed out the trade for a profit by end of the week when price hit the 20 day simple moving average.
S&P 500 Futures Daily
The chart below is the market/volume profile of the S&P futures. The large rectangle includes the action on FOMC trading day along with the last 6 trading days. This rectangle encompasses a very large trading range in the S&P futures. That is from 6255 - 5900. Over the past week, there has been some mean reversion as price moved higher touching the 20 day simple moving average.

The market is in the middle of a range so there is very little predictive direction. A potential upside target for the week is between 6094 - 6135. At 6135, price will touch the balance area prior to the FOMC meeting.
On the downside, the low of the price bar on the day of the FOMC meeting. That price area is near 5900.
The Weekly S&P futures chart.
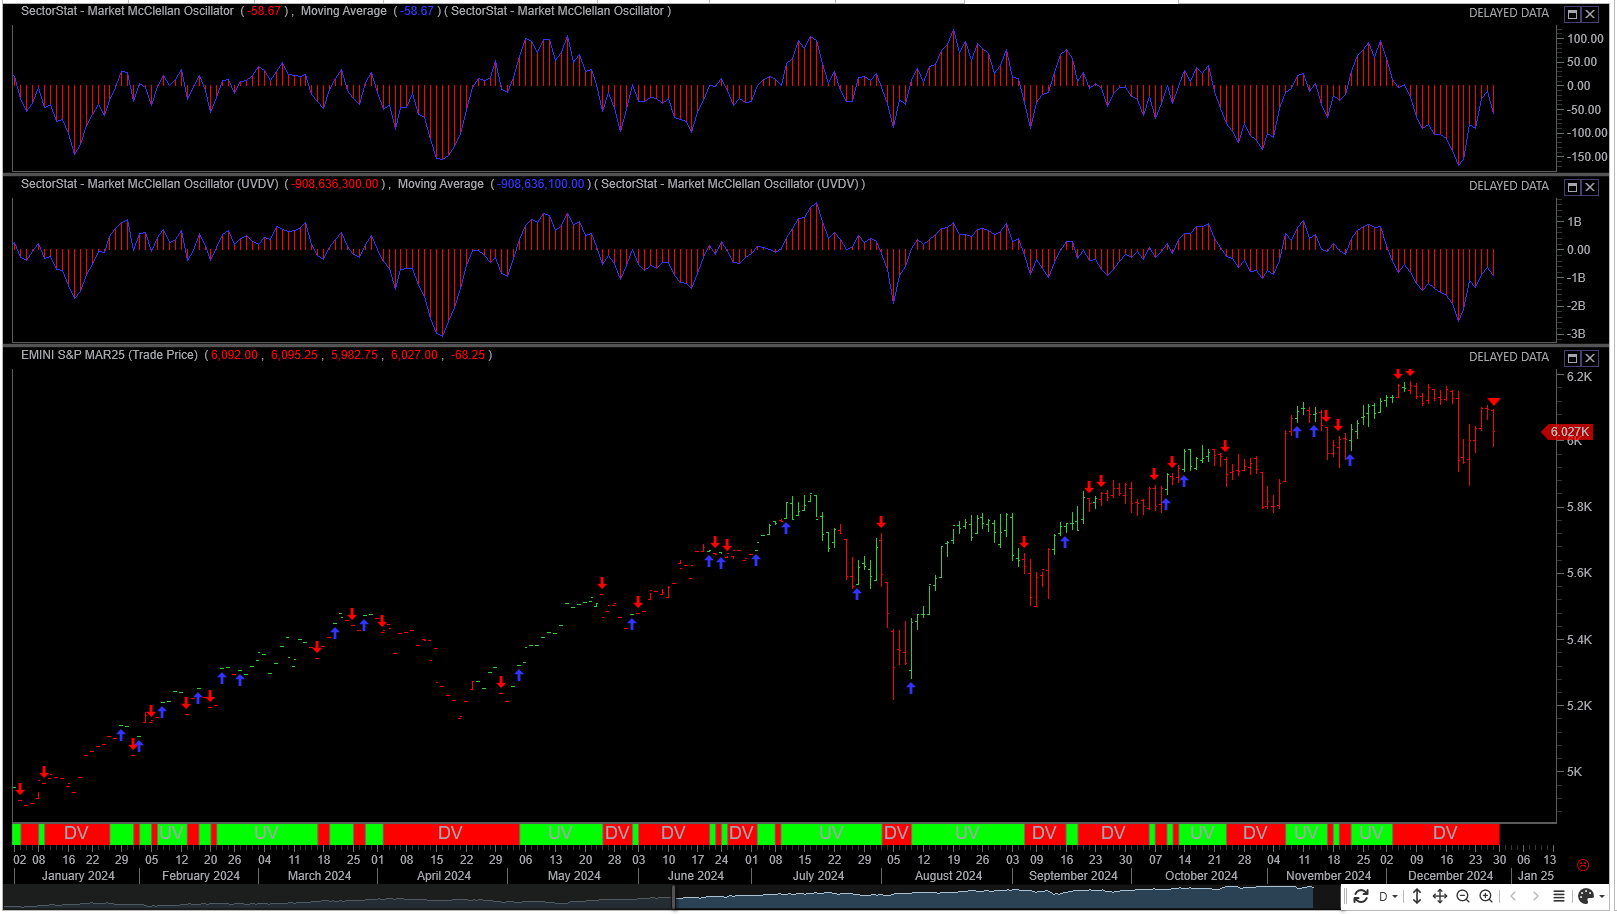
Both market and volume sentiment continues to stay bearish over the last week of trading. This is depicted by the chart below. This chart shows the McClellan Oscillator. The two histograms in chart represent market and volume sentiment. The S&P 500 price is shown in lower section of the chart.
This viewpoint has not changed in the last week and remains bearish from both a market and volume sentiment.
The S&P 500 skew is very high at 168. Last week the skew hit a value of 184 before falling. This was the highest value over the past two months, suggesting increased demand for tail-risk hedges.
This chart shows monthly skew values over the past 2 years. This past week skew reached a value higher than two standard deviations.
It should be noted, that just because something appears extremely high or extremely does not imply that something will happen tomorrow. It is just another data point to carry forward.

Long Term rates rise
After the FOMC cut rates there has been a steady increase in long term rates. This appears counter intuitative. The bond market is forward-looking, and higher long-term yields can reflect worries about inflation remaining persistent, high government debt levels, or a shift toward stronger economic growth despite lower short-term interest rates.
A rise in long-term rates increases the discount rate used to value future earnings of companies. The higher the discount rate, the lower the present value of future cash flows, which generally depresses stock prices.
This is particularly impactful for growth stocks, where a significant portion of their value is derived from future earnings. Technology stocks ( the nazdaq 100 or 30 percent of the S&P 500), for example, may be more sensitive to rising rates.
Rising long-term rates make bonds more attractive relative to equities, as the yield on government debt increases. As bond yields rise, investors may shift funds from the equity market (S&P 500) into bonds, causing selling pressure on stocks.
Therefore two scenarios exist:
Impact on S&P 500 due to Inflation expectations:
If rates rise due to inflation concerns, it suggests that bond investors are demanding a higher return to compensate for the decreased purchasing power of future cash flows.
This could cause equity markets to fall, especially for growth stocks, which rely on future earnings.
Impact on S&P 500 Due to Economic Growth
A rise in rates due to strong economic growth can be a more positive development for equities, as it signals that the economy is growing robustly and companies may be able to expand earnings at a faster pace.
US debt to GDP
As of September 2024, the U.S. government's debt-to-GDP ratio stood at approximately 120 percent.
Key Factors Influencing the Debt-to-GDP Ratio:
Government Spending: Increased expenditures, including pandemic-related relief measures and infrastructure investments, have contributed to the rising debt levels.
Economic Growth: While the economy has experienced growth, it has not been sufficient to offset the increase in debt, leading to a higher debt-to-GDP ratio.
Implications:
Fiscal Policy: The elevated debt-to-GDP ratio may prompt policymakers to consider measures to reduce the deficit, such as spending cuts or tax reforms.
Economic Stability: Sustained high debt levels could impact the nation's credit rating and borrowing costs, potentially affecting economic stability.
Addressing the debt-to-GDP ratio is a complex issue that requires balancing fiscal responsibility with the need to support economic growth.
Market Expectation
I believe that the market is in the former camp. This is due to market breadth showing sustained weakness. Leadership is from the megacaps masking the overall market weakness. That is the main contributers being Broadcom, Nvidia, Tesla, Amazon, Microsoft, Meta, Apple, and Alphabet. These technology giants collectively contributed to over 85% of the total increase in the S&P 500’s market capitalization. If these companies pause or decline in price, therefore a potential correction in the S&P 500 is expected.
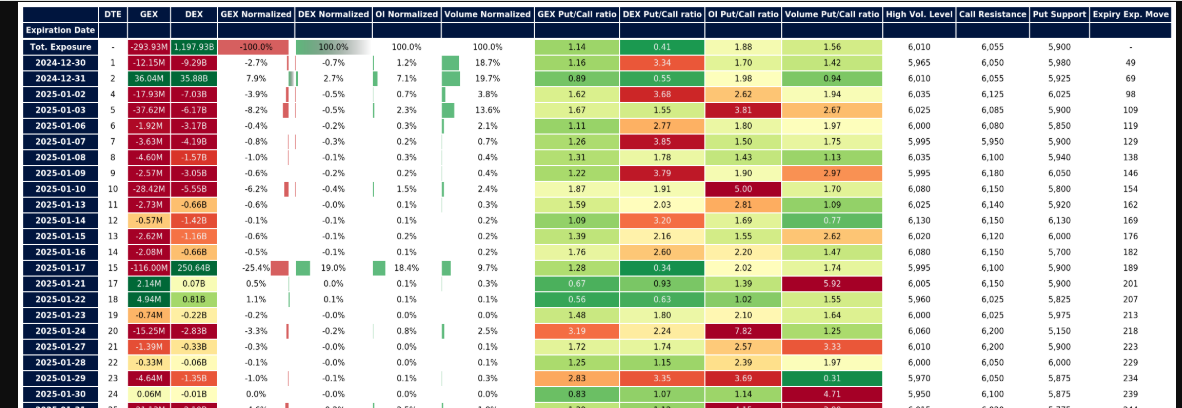
S&P 500 Cash Gamma levels
For the next 30 days market participants are positioned mostly bearish. If price breaks below the 5920 - 5925 zone then S&P 500 cash index could fall to an area between 5850 - 5825.
Above 5990 - 6010 zone, positioning is supportive of a bullish narrative. A potential target is 6100. This is the top of the most recent consolidation range.
Market makers are positioned to trade in the direction of the market. This is due to the negative gamma effect. This implies that moves both up and down will be large and extreme. This is period of time to trade smaller size.
The market moves from negative to positive in the 6000 area. The SPX cash index must break through the 6000 - 6025 area for any sustained bullish movement.
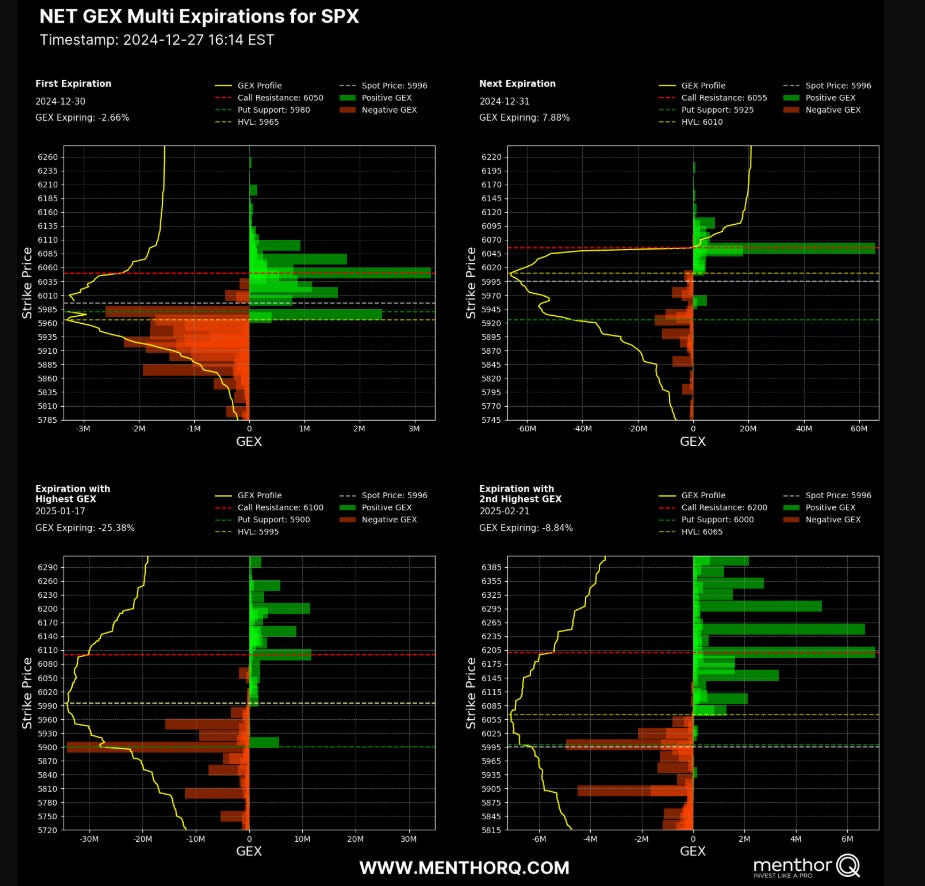
The market maker implied move for the S&P futures this week is +/- 73 points. Therefore the market maker expected range is between 5900 to 6040.
US Market Moving Events
The market moving events for the week of 12/29/2024
In the week of December 29, 2024, several key events are expected to influence the financial markets:
Economic Data Releases:
Pending Home Sales (November): Scheduled for Monday, December 30, this report from the National Association of Realtors will provide insights into the housing market's health.
S&P CoreLogic Case-Shiller Home Price Index (October): Due on Tuesday, December 31, this index will offer a snapshot of home price trends across 20 major U.S. cities.
Construction Spending (November): Also on Tuesday, the Census Bureau will release data on construction activity, reflecting the strength of the construction sector.
ISM Manufacturing Purchasing Managers' Index (December): On Friday, January 3, this index will provide a gauge of manufacturing sector performance, with a reading above 50 indicating expansion.
Market Hours and Holidays:
New Year's Day: Markets will be closed on Wednesday, January 1, in observance of the holiday.
Early Bond Market Close: The bond market will close early on Tuesday, December 31, ahead of the New Year's holiday.
Corporate Earnings Reports:
No major earnings reports are scheduled for this week. The fourth-quarter earnings season is set to begin on January 15, with financial institutions such as JPMorgan Chase, Citigroup, and Wells Fargo expected to report.
QQQ Weekly Chart
Looking at the QQQs or the Nazdaq 100 futures are an important part of my trading plan. The XLK (technology ETF) represents a 33% component of the S&P500. Therefore I use this as an indicator to trade the S&P 500.
The QQQs made a inside week on the weekly chart. This foretells indecision in the next move up or down.

QQQ Gamma levels
The chart below shows the positioning information for QQQ. Price staying below 520 is viewed as bearish positioning. Above the 525 level is constructive to the bullish narrative. Additionally, the QQQs are sitting at the 20 day simple moving average indicating a pause.

The Weekly Plan and trading idea
Going into this week, I have a neutral to bearish trades on the SPX ( the S&P 500 cash index). Therefore my current bias is neutral.
Current trade
For January 17 expiry I am net short calls with the following trade:
1 Long 6125 call, 2 Short 6140 call, 1 Long 6200 call.
The trade is defined as a broken wing butterfly. I am viewing this as a credit collection trade, however the trade does have the potential to make 15 points on expiration. A standard butterfly is symetrical in that the long options are equdistant from the short option. In my trade, I have the higher purchased option a greater distance from the short strike in order to place this trade as a credit.
The trade was placed above the most recent swing high in the SPX.
This trade was put on for $3 credit per contract. It currently has probability of 80 percent to expire worthless.
If I let the trades run till January 17, I will collect the full credit. I plan on closing these trades when values falls 75 percent of the credit collected.
S&P futures Weekly Scenarios
Scenario 1
If price falls below 5920 then I would target 5900- 5850. At approximately 5850, i would expect buyers to step and price to revert higher.
Scenario 2
If price moves above 6000-6020 then I would target 6040 to 6050. I expect price to mean revert here.
To compute the S&P 500 cash values, just subtract 60 from the S&P 500 futures to get the equivalent prices.
Have a successful trading week, by waiting for your trade setups to come to you. Always manage your risk and understand what you expect to lose prior to trade entry. By managing risk, you unlock profitability.
Gamma Level data (netgex data) and skew data (market sentiment) was provided by menthorQ.com
Disclaimer
Please don’t follow my idea(s) blindly. Do your own due dilligence before you attempt to trade. Again, always manage your risk.
Thank you for reading my weekly plan.
Joel