Weekly Plan for February 16
The S&P 500 moved higher for the week and reached the top of the 3 month consolidation. Will it break higher this week? I go over my plan for the week below.

Summary
The narrative has not changed as price remained in a large trading range for the last three months. The range is 5740 - 6128. Trading this market requires agility and a viewpoint of trading small and taking profits when available. This continues for the week ahead inspite of the 130 rally from the previous week.
If the market remains range bound, then a potential trade idea for the week is the IRON CONDOR. That is selling the lower end of the range along selling the upper range. This trade works best when price action within a range.
I place IRON condor spread is put on in stages to mitigate risk by selling the PUT spread below the weekly low and selling CALL spreads above the weekly high. This provides higher probability of a winning trade.
The Volume Profile View
The chart below shows the S&P 500 futures volume profile for the last 20 days aggregated by 30 minute periods. I am showing the candlesticks on the left with the profile histogram on the right. The area boxed in on the right is the value area for the 20 days. As you may recall the value area contains 70 percent of the trading volume for the period.
The key levels are:
Value Area High: 6106
Point of Control: 6078
Value Area Low: 6018
My expectation is that early in the week one or more of these levels will get tested. Depending on how bullish or bearish the S&P futures are will determine how far lower it will go.
For each of the levels we can have the following scenarios:
Extremely bullish
Touches or stays above the value area high and moves higher into Friday’s range. Price continues making new highs during the week.
Bullish
Touches the point of the control and moves higher. How high it moves can get viewed as continued consolidation or potentially if it moves aboves the value area high then potentially new highs for the week.
Least Bullish
Price backfills to the 6018 area. This is noteworthy because this where the bullish breakout emanated from.
Bearish
Price breaks below the value area low and trends lower potentially moving towards the 5950 price area.
It is also noteworthy that price stopped near the 3 month high (approximately 6162). It has been previously tested and rejected.
Read about market profile and auction market theory here.
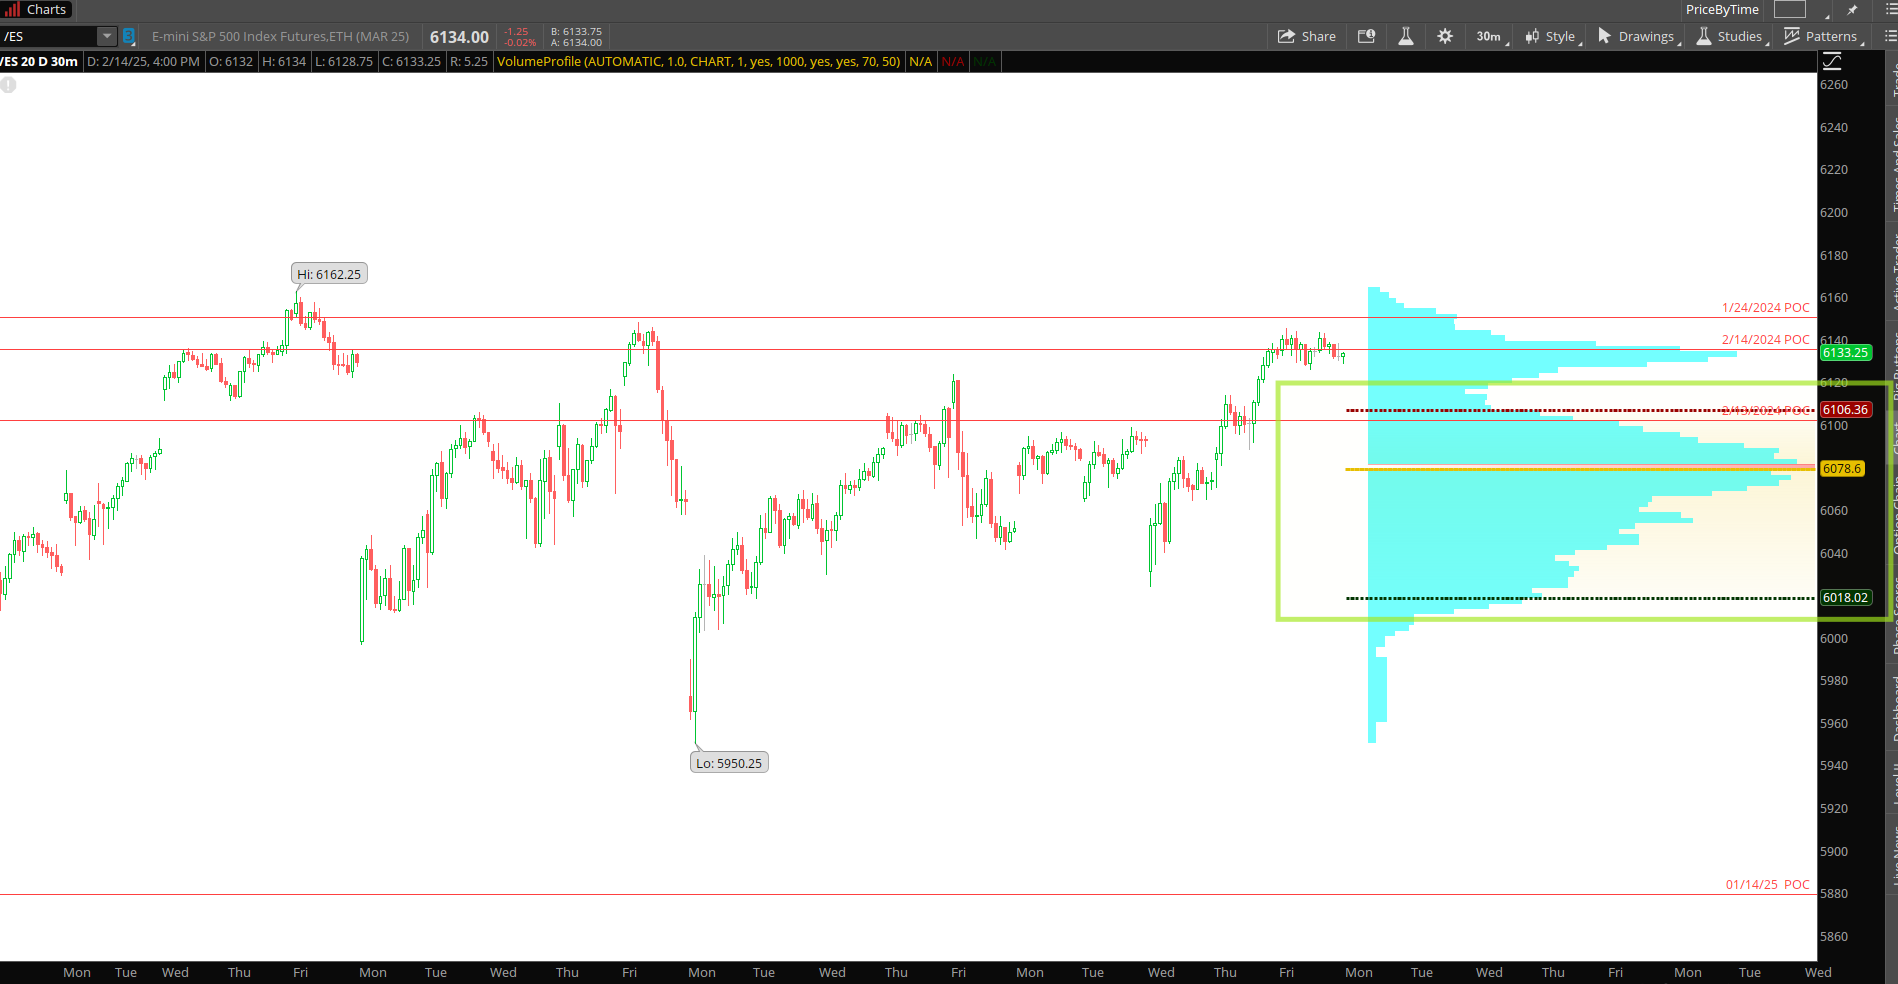
Based on the historical data, price has been rejected 27 times within 30 points of the 3-month high (6132.25 - 6162.25) in the past 90 days. This area has acted as a strong resistance.

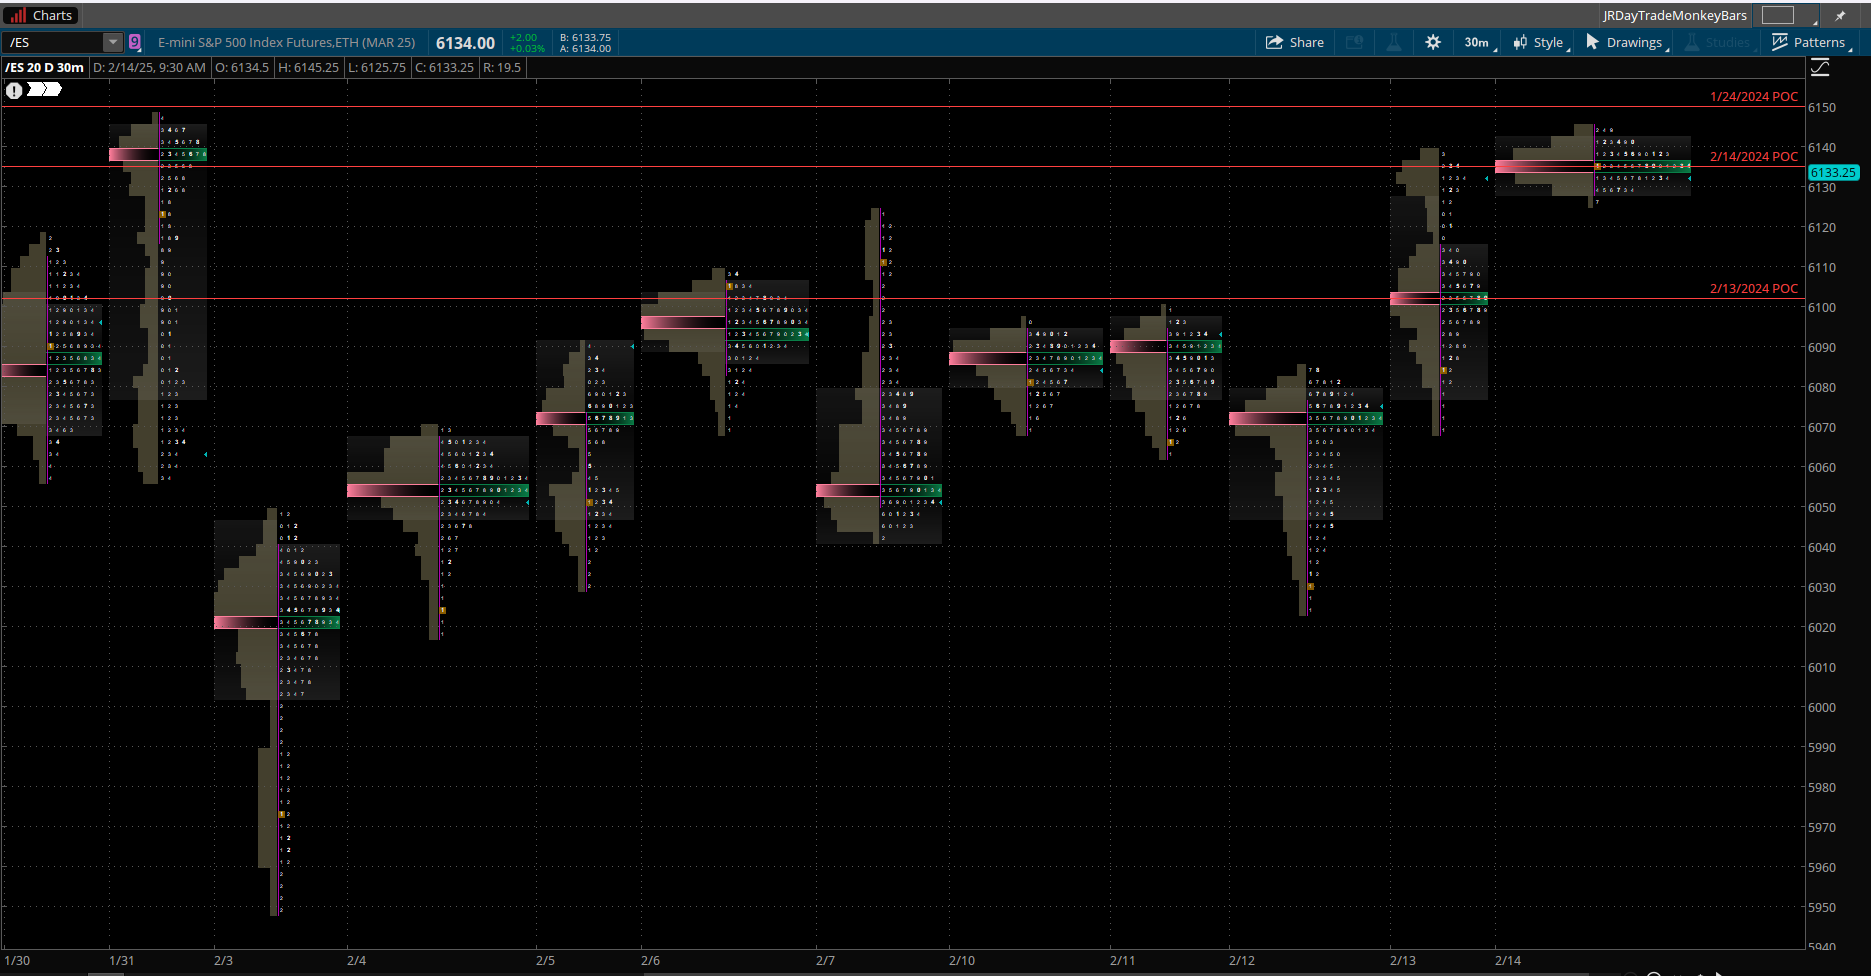
The Daily Profile chart
Key points to consider:
🔹 POC Shifts higher from previous day → Bullish Bias if Holding Above 6133
🔹 Watch 6150 as Major Resistance Level
🔹 Low-Volume Node (6120-6110) May Trigger a Quick Move
🔹 6095 Needs to Hold for Bulls to Maintain Momentum
Final Thoughts
🚀 Bullish above 6133 → Targeting 6150, then 6180.
📉 Bearish below 6120 → Targeting 6095, then 6075.
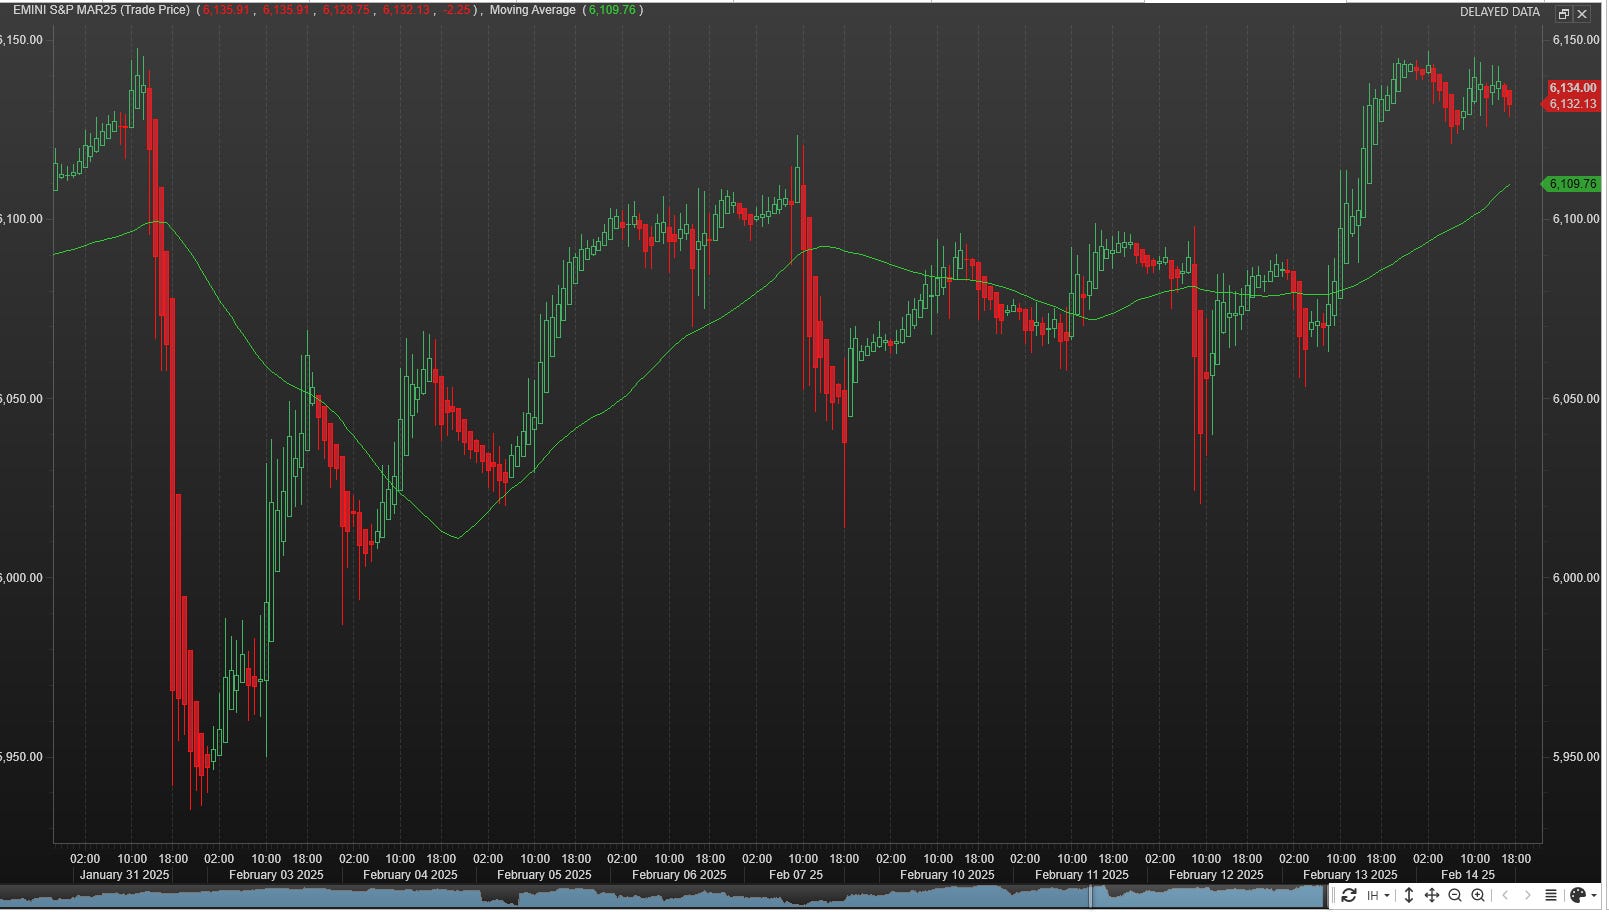
S&P 500 futures hourly chart
This chart shows the short term momentum over the last 15 days aggregated by hour. Price is trading above the 50 period simple moving average, indicating bullish momentum. There is a tendency for price to oscillate around this moving average. Expect a touch to the moving average early in the week.
The 6109 - 6100 price point is slightly above the value area high noted above. Bouncing off this level and moving higher is the most bullish scenario.
Management of last week’s plan
Last week I remained neutral the market. My thesis was selling call spreads above the all time high in the SPX and selling put spreads below the Sunday-Monday gap. This plan worked out.
Last week’s plan is here.
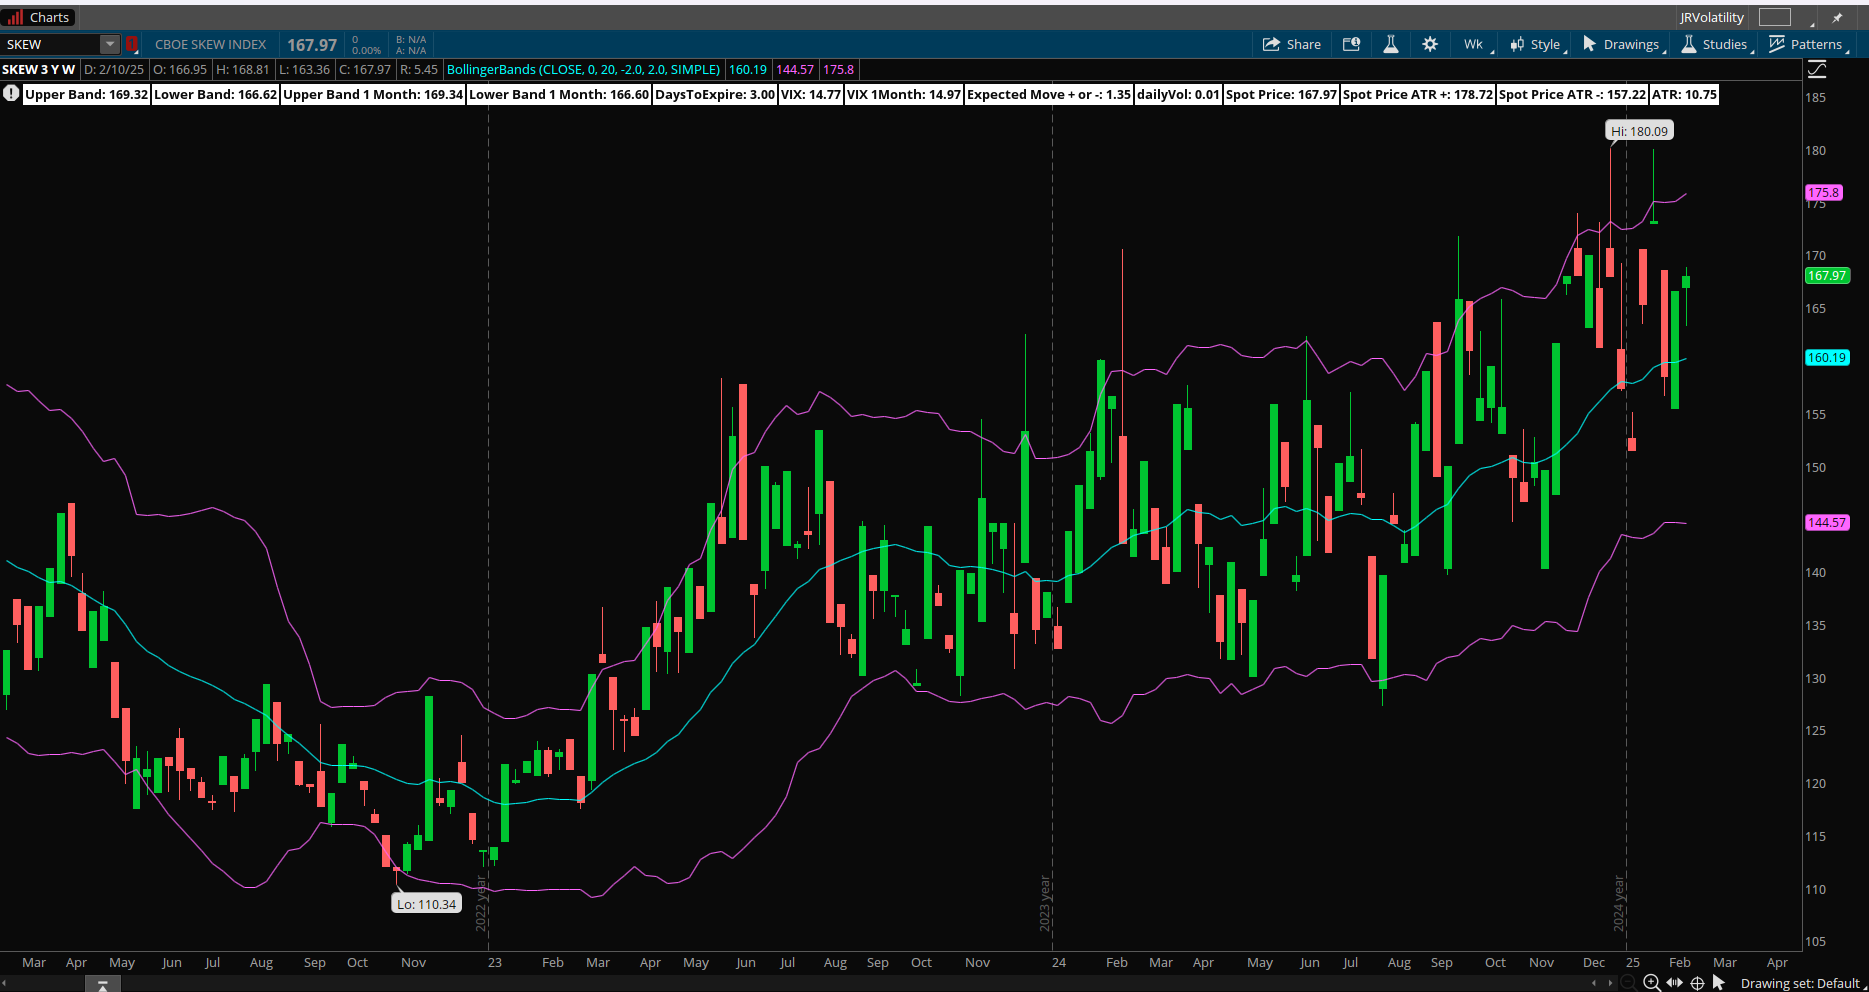
The CBOE SKEW index
The CBOE SKEW Index (SKEW: 168) measures the tail risk in the options market, specifically the probability of a black swan event (large downside move). Higher values indicate elevated demand for tail risk hedging, while lower values suggest a more neutral risk environment.
Trading Implications
SKEW Near 168 → Slightly Elevated Tail Risk (Cautionary, But Not Panic Mode)
1. Above 175 → Higher Tail Risk, Expect Volatility
2. Below 160 → Risk-On Sentiment, Bullish for Equities
The Nation's Index
This chart shows that market participants are hedged for both long tail and short tail risk.
From 2/13/2025
🔹 Decreasing Put Skew → Less downside hedging, implying lower fear.
🔹 Rising Call Skew → Higher demand for upside exposure, bullish momentum.
🔹 Watch for a potential reversal if skew becomes too one-sided toward calls.

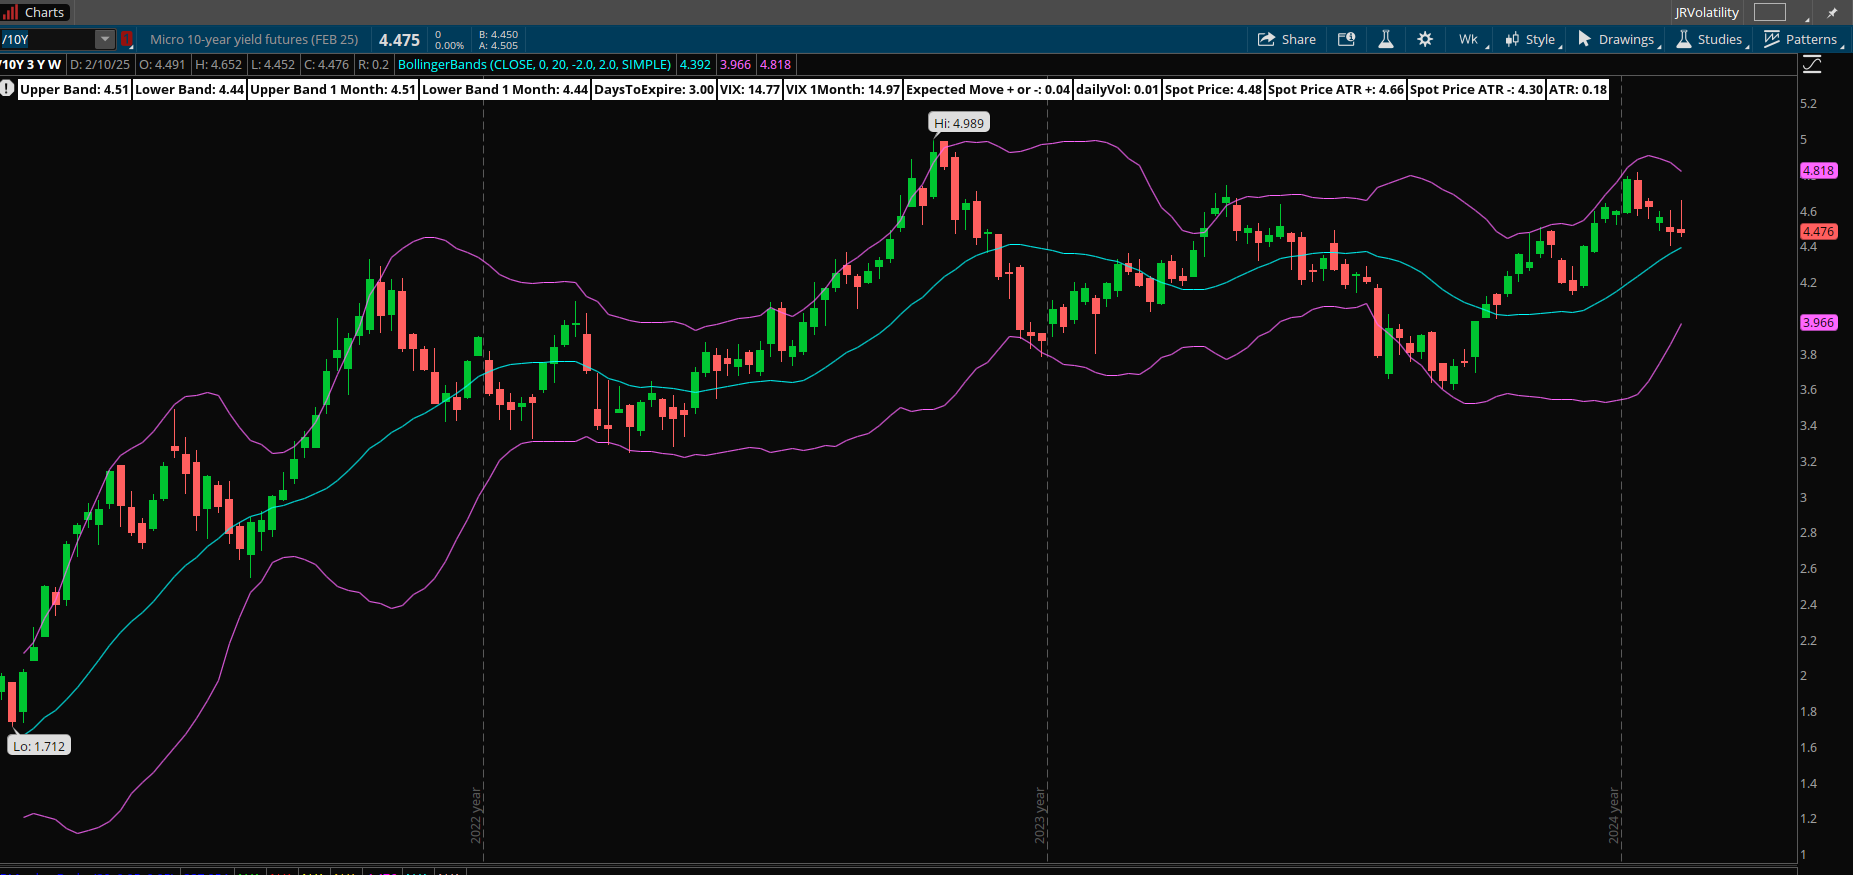
Long Term rates (10 year Treasury)
After the FOMC cut rates (December 2024 .25 basis point cut) there has been a steady increase in long term rates. Rates peaked in the first week of January 2025. Since this time they have declined to the midpoint of the range.
The bond market is forward-looking, and higher long-term yields can reflect worries about inflation remaining persistent, high government debt levels, or a shift toward stronger economic growth despite lower short-term interest rates.
A rise in long-term rates increases the discount rate used to value future earnings of companies. The higher the discount rate, the lower the present value of future cash flows, which generally depresses stock prices.
This is particularly impactful for growth stocks, where a significant portion of their value is derived from future earnings. Technology stocks ( the nazdaq 100 or 30 percent of the S&P 500), for example, may be more sensitive to rising rates.
Rising long-term rates may make bonds more attractive relative to equities, as the yield on government debt increases. As bond yields rise, investors may shift funds from the equity market (S&P 500) into bonds, causing selling pressure on stocks.
Trade Implications Based on Yields
Bullish for S&P 500 If:
Yields stay below 4.40% and decline toward 4.00%.
The Fed signals rate cuts or economic weakness reduces rate hike fears.
The bond market rallies, sending yields lower.
Bearish for S&P 500 If:
Yields push back above 4.50% and trend toward 4.80-5.00%.
Inflation data or Fed policy shifts favor higher rates.
Bond market weakness (selling) pushes yields higher.
The weekly 10 year treasury yield chart.
S&P 500 Term Structure
The chart below shows the S&P 500 term structure. It shows an upwardly sloping line over the next 5 - 20 days. The short-term IV spike suggests upcoming risk, so hedging might be appropriate.
I list the major events below.

S&P 500 Cash Gamma levels
For the next 15 days market participants are mostly positioned bullish. This is reflected in the VIX as it continued to trend lower. VIX is near the lower end of the 3 month range (current value 14.7).
Customer positioning moved higher from 6015 - 6130 over the past week. The market closed near the top of the range. Large players continue to push the market higher. This is highlighted by the call resistance level continuing to rise. The call resistance for next week is between 6100 - 6200.
SPX Moves Higher → Market Makers Buy More Futures
Market makers sell call options increasing their short delta.
To stay neutral Market makers then buy SPX futures to hedge, which reinforces slow, stable price movements.
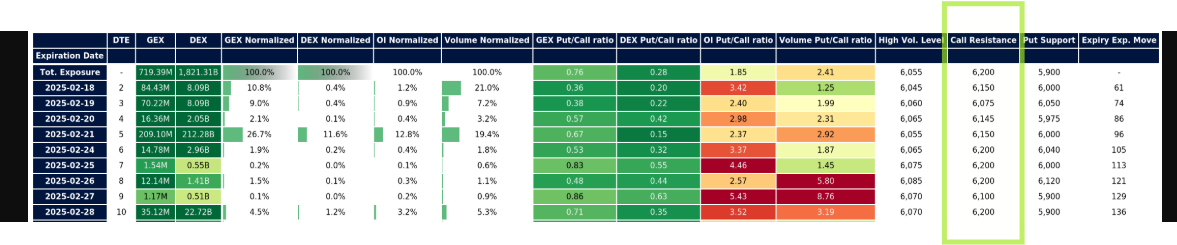
The Net Gex chart is showing that 6055 is a key level in the S&P 500 chart this week. This is the high volume level and is pointed to below.
Again, as noted previously the S&P 500 is in similar range as the previous week.

The market maker implied move for the S&P futures this week is +/- 72 points. Therefore the market maker expected range is between 6043 to 6187. This is a slightly smaller range as compared to the previous week.
US Market Moving Events for the current week
I have listed the events in the order of significance (highest to lowest).
Please note that U.S. financial markets will be closed on Monday, February 17, in observance of Presidents' Day.
Federal Reserve Meeting Minutes Release (Wednesday, February 19)
Details: The Federal Open Market Committee (FOMC) will release the minutes from its January meeting at 2:00 PM ET. Investors will scrutinize these minutes for insights into the Fed's decision to maintain interest rates and any indications regarding future monetary policy, especially in light of recent inflation data.
Earnings Reports from Major Corporations
Walmart (Thursday, February 20): As the world's largest retailer, Walmart's performance offers insights into consumer spending trends.
Alibaba and Baidu (Thursday, February 20): These Chinese tech giants' results will shed light on the health of China's e-commerce and technology sectors.
Other Notable Reports:
Tuesday, February 18: Arista Networks, Devon Energy, Medtronic, Occidental Petroleum
Wednesday, February 19: Analog Devices, Garmin
Thursday, February 20: Block, Booking Holdings, Newmont
Housing Market Data Releases
Building Permits and Housing Starts (Wednesday, February 19): January data will provide insights into the residential construction industry's momentum.
Existing Home Sales (Friday, February 21): This report will highlight the health of the secondary housing market and consumer purchasing behavior.
S&P Global PMI Data (Friday, February 21)
Details: Preliminary Purchasing Managers' Index (PMI) readings for February will be released, offering a gauge of the manufacturing and services sectors' performance. These indicators are vital for assessing economic health and potential growth trajectories.
Consumer Sentiment Index (Friday, February 21)
Details: The University of Michigan will release its Consumer Sentiment Index for February, providing insights into consumer confidence and spending propensity.
Regional Manufacturing Surveys
Empire State Manufacturing Index (Tuesday, February 18): Offers a snapshot of manufacturing activity in New York State.
Philadelphia Fed Manufacturing Index (Thursday, February 20): Provides insights into manufacturing conditions in the Philadelphia region.
These events collectively offer a comprehensive view of the current economic landscape, encompassing monetary policy, corporate performance, housing dynamics, and consumer behavior. Investors and analysts will closely monitor these developments to inform their strategies and forecasts.
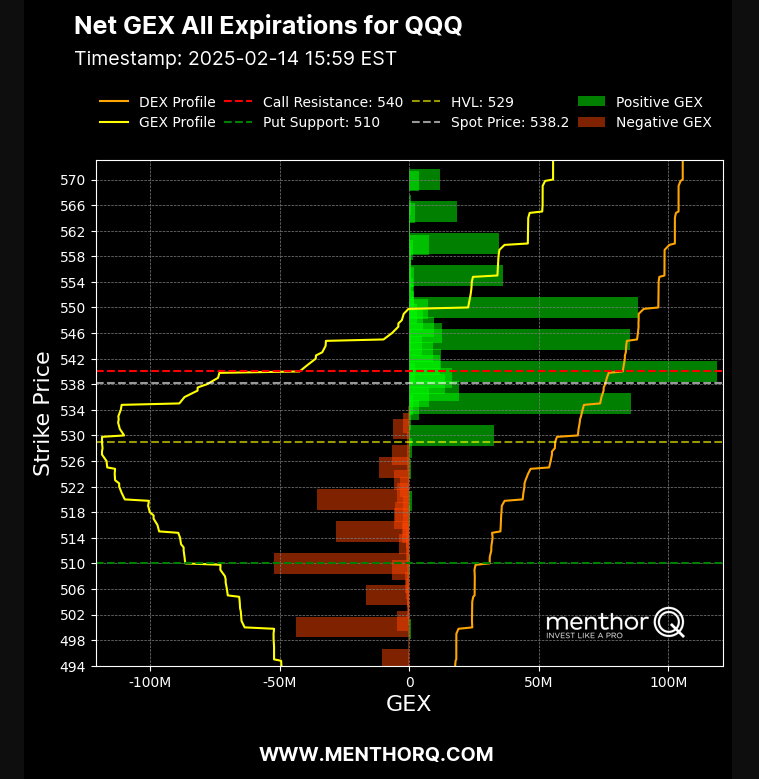
QQQ Weekly Chart
Looking at the QQQs or the Nasdaq100 futures are an important part of my trading plan. The XLK (technology ETF) represents a 33% component of the S&P500. Therefore I use this as an indicator to trade the S&P 500.
Trading Implications
Bullish Scenario (Breakout Above 542)
If price clears 542 and holds, expect continuation toward 550+.
Ideal entry would be on a pullback to 530-532 before breaking out.
Buy CALLS in the S&P 500 cash index and/or sell puts.
Bearish Scenario (Failure at 540-542)
If QQQ fails to break 540-542 and reverses, a retracement toward 520-512 (20-week SMA) is possible.
A deeper pullback could test the 500 psychological level, but this would still be a buy-the-dip opportunity.
Sell CALLS in the S&P 500 cash index and/or buy puts.

QQQ Gamma levels
The chart below shows the positioning information for QQQ. Price staying above 529 is viewed as bullish positioning. Currently price is 538.
The Weekly Plan and trading idea
Going into this week, I have a neutral view of SPX ( the S&P 500 cash index). The S&P index has been range bound.
Sample Trade idea:
Bullish Scenario:
I will look closely how SPX trades on Tuesday and potentially look for a place to go long. Based on the analysis done above. As long as price does not drop below the point of control (6080 S&P futures) or 6060 cash index, then i will look to sell puts ( less than 10 days out) below the most recent swing low.
Bearish Scenario:
If price is rejected in the 6130 - 6150 area ( 6150 - 6170 futures) I will sell call spreads above the all time high and potentially buy puts. If I am purchasing PUTS then i will look for a timeframe of at least 8 - 10 weeks to give the trade time to play out.
Note that the analysis was done with the S&P 500 futures. The current difference between the futures and the cash index is approximately 20 points.
S&P Cash Index Weekly Scenarios
Scenario 1
If price falls below 6080 cash index then I would target(s) 6060, 6020, 5950.
Each of those price areas, could be place where large players go long.
Scenario 2
If price moves above 6135 then I would target 6150 - 6190.
Have a successful trading week, by waiting for your trade setups to come to you. Always manage your risk and understand what you expect to lose prior to trade entry. By managing risk, you unlock profitability.
Gamma Level data (netgex data) and skew data (market sentiment) was provided by menthorQ.com
How I trade
I did a presentation of my trading process with menthorQ on how I trade the S&P 500. You can watch it here.
Disclaimer
Please don’t follow my idea(s) blindly. Do your own due dilligence before you attempt to trade. Again, always manage your risk.
Thank you for reading my weekly plan.
Joel