Weekly Plan for February 23
The S&P 500 moved lower for the week is near the lower end of the 3 month consolidation. I discuss my weekly plan below.

Summary
The market has remained in the same three month range. The range still is 5740 - 6140. The strategy still remains to sell the lower end of the range when price near the weekly low as well as sell above the weekly range. Thus creating the iron condor trade. I don’t trade both spreads at the same time. I look for an opportunistic approach to selling both sides of the range. For example, when the S&P is moving from the lower end of the range, I will sell the PUT spread a few days out below the previous weekly low. When the S&P is moving from the higher end of the range I will sell the CALL spread above the previous weekly high.
The only thing that is consisent in this strategy is keeping the width of the spread the same size. This allows the margin to remain constant while both sides of the credit spreads are active.
Although, we have seen some volatility, I don’t view it as extreme. Generally, any selling that has been going on in the index ( S&P 500 and Nasdaq 100) has been bought within a few days.
The Volume Profile View
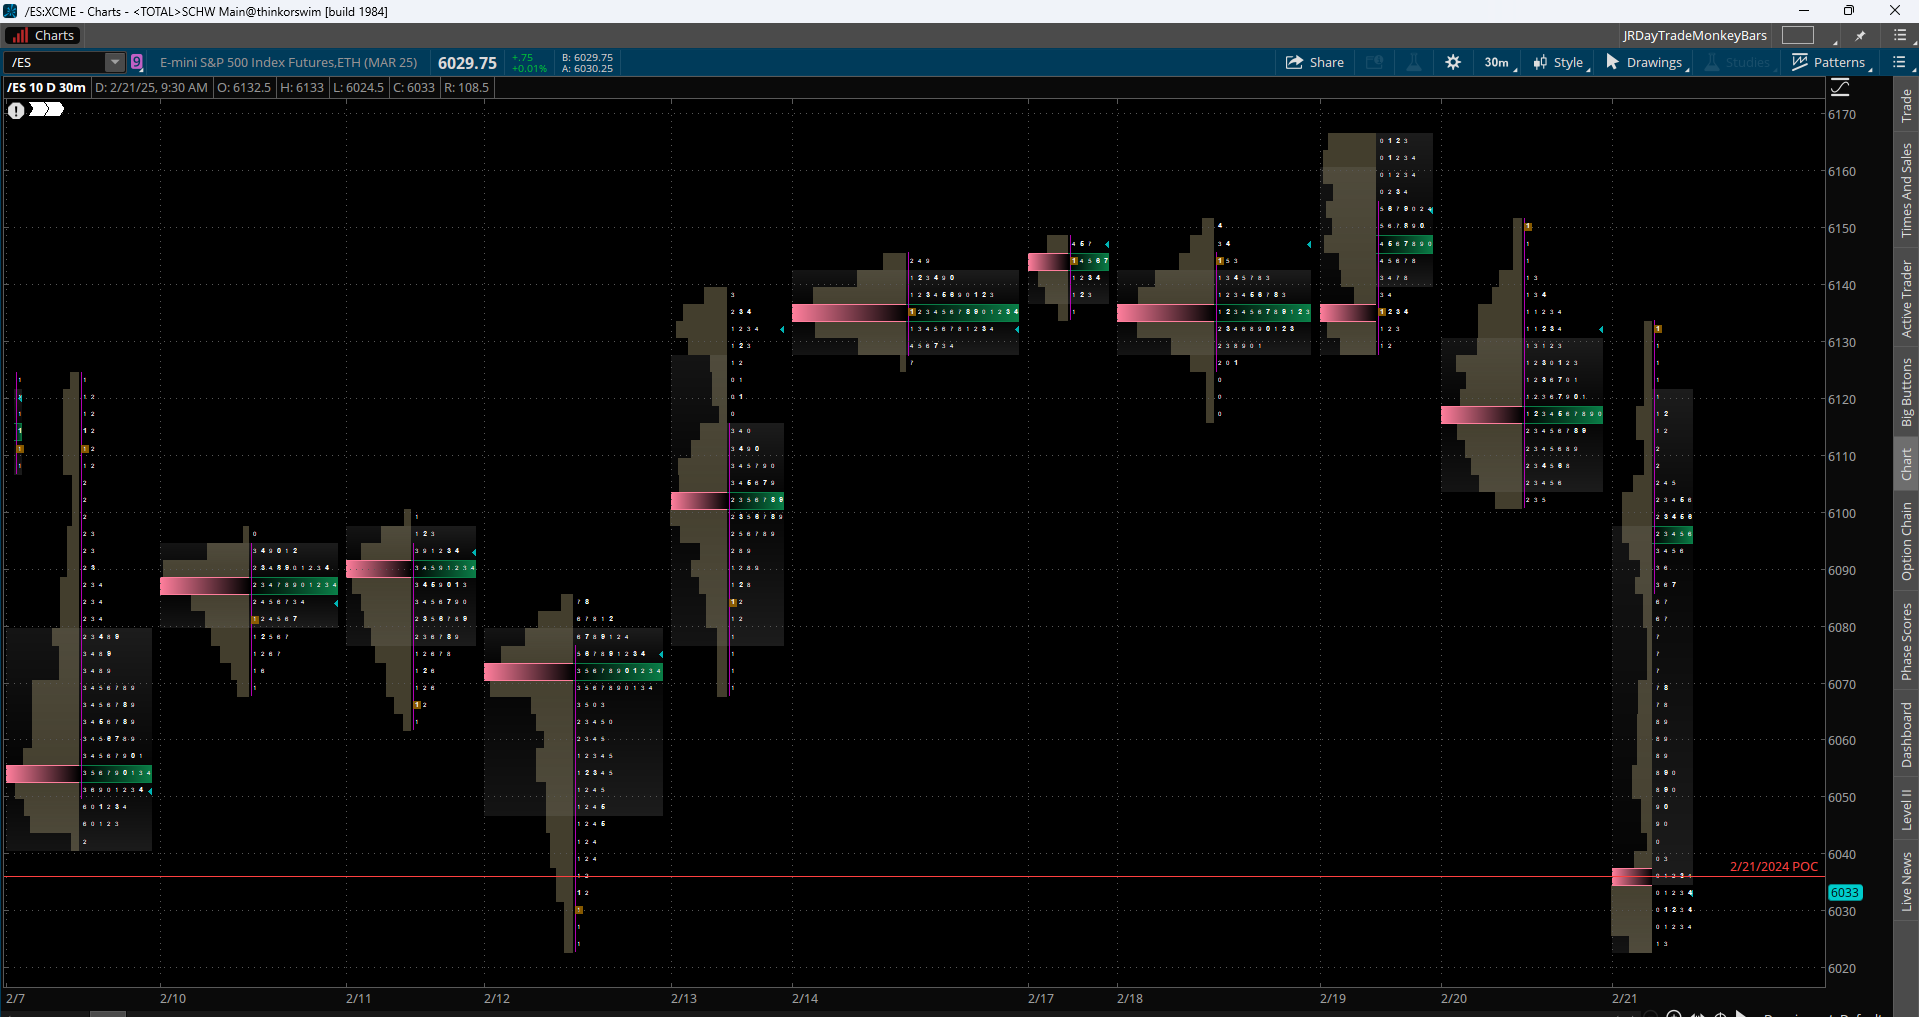
The chart below shows the S&P 500 futures volume profile for the last 20 days aggregated by 30 minute periods. I am showing the candlesticks on the left with the profile histogram on the right. The area boxed in on the right is the value area for the 20 days. As you may recall the value area contains 70 percent of the trading volume for the period.
The key levels are:
Value Area High: 6144
Point of Control: 6132
Value Area Low: 6068
The S&P futures made nearly a 2% negative move on Friday and closed below the previous week’s 10 day value area low. The context of this move is obviously bearish, however the migration of the point of control was actually higher from the previous week.

My expectation is mean reversion for this week as I expect the futures to move into the 10 day value area. Based on the context of how far price moves into value area if at all will determine the extent of bullish and or bearish context.
For each of the levels we can have the following scenarios:
Extremely bullish
Price traverses through the value area and breaks above the value area high of 6145.
Bullish
Price moves through the value area and breaks above the point of control however stays below the value area high of 6144.
Least Bullish
Price retraces through the value are and pauses at the point of control (6132)
Bearish
Price moves into the lower end of value (6132 - 6068 )
Extremely Bearish
Price hits the 6068 area and rejects lower.
Read about market profile and auction market theory here.

The Daily Profile chart
Key points to consider:
Support & Resistance Zones:
Support: 6030-6000 (POC & recent rejection areas)
Resistance: 6100-6130 (previous high-volume area)
A break below 6000 could lead to further downside toward 5950-5900.
Holding above 6033 POC may lead to an upside retest of 6100+.
Lower Range Tests (3-month context):
Price has not yet reached the 3-month low (~5809).
Watch if price approaches 5950-5900, as this could lead to a larger move.
Signs of Buyers Stepping In:
Some days show long tails at the bottom, meaning lower prices were rejected.
This suggests buyers defending key levels.
S&P 500 futures hourly chart
This chart shows the short term momentum over the last 15 days aggregated by four hour. Price is trading well below the 50 period simple moving average, indicating strong bearish momentum. Note the tendency for price revert to the moving average.
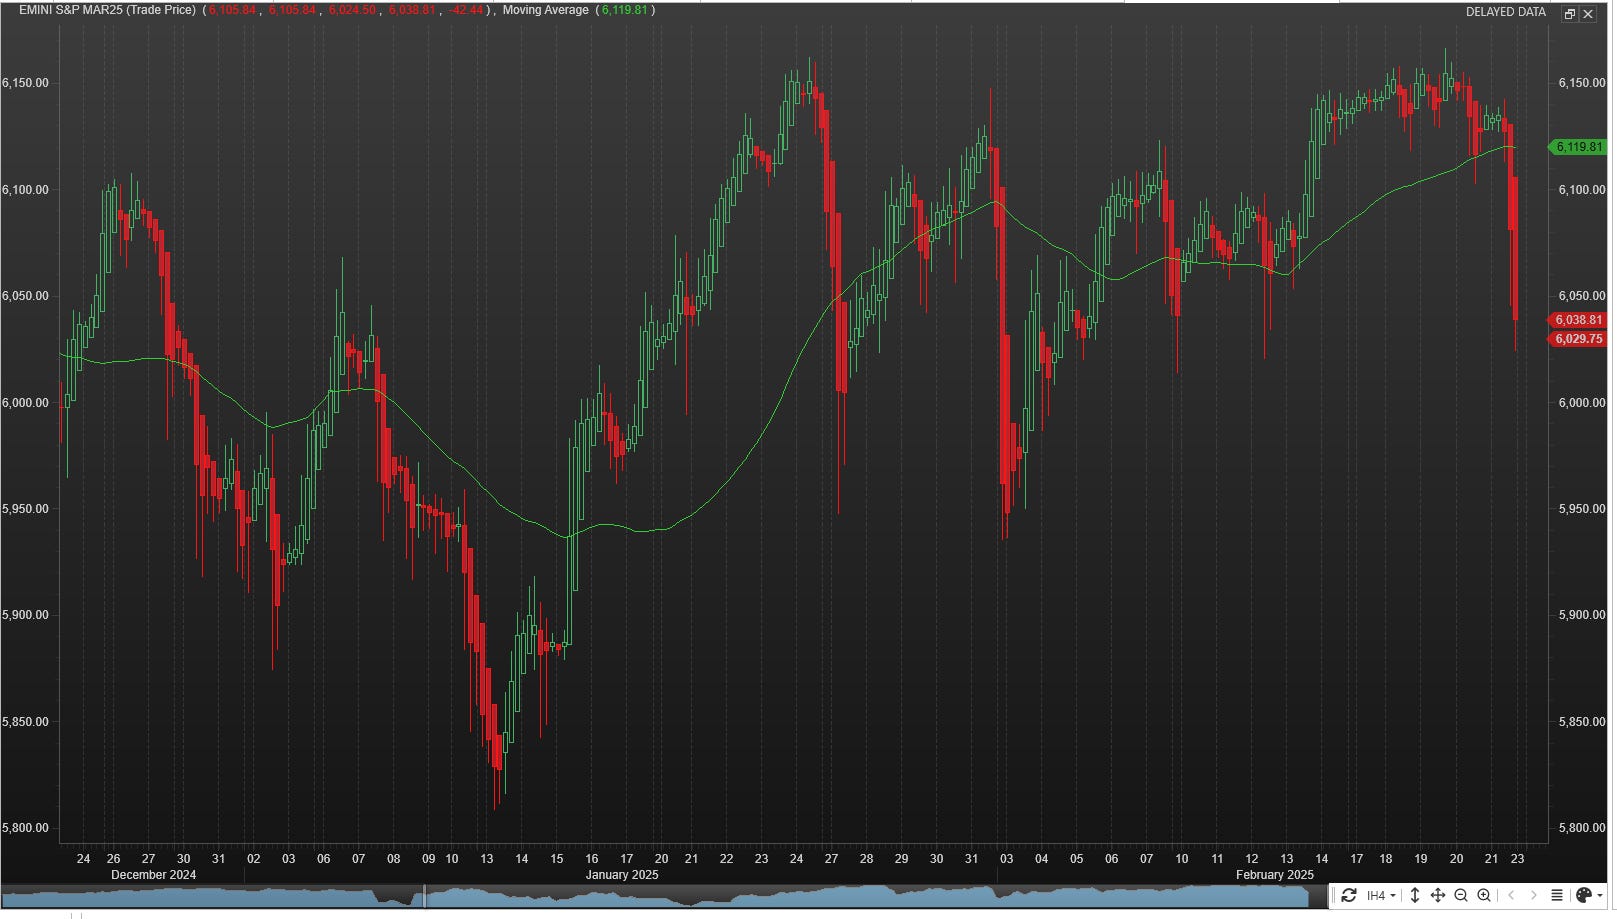
Key Support and Resistance Zones:

Management of last week’s plan
Last week I remained neutral the market. My thesis was selling call spreads above the all time high in the SPX and selling put spreads below the weekly range. This plan worked out.
Last week’s plan is here.
The MenthorQ SKEW index
The current skew is highly put-biased (87 percentile), signaling strong fear and hedging.
Recent SPX price action aligns with this, showing a pullback from recent highs.
If SKEW remains high and the market continues dropping, expect further downside movement.
However, if skew remains extreme but price stabilizes, contrarian traders might look for a bounce.
Volatility is likely to stay elevated – watch for economic events and potential catalysts driving market sentiment.

The Nation's Index
This chart shows that market participants are purchasing PUTS and selling CALLS.
From 2/21/2025

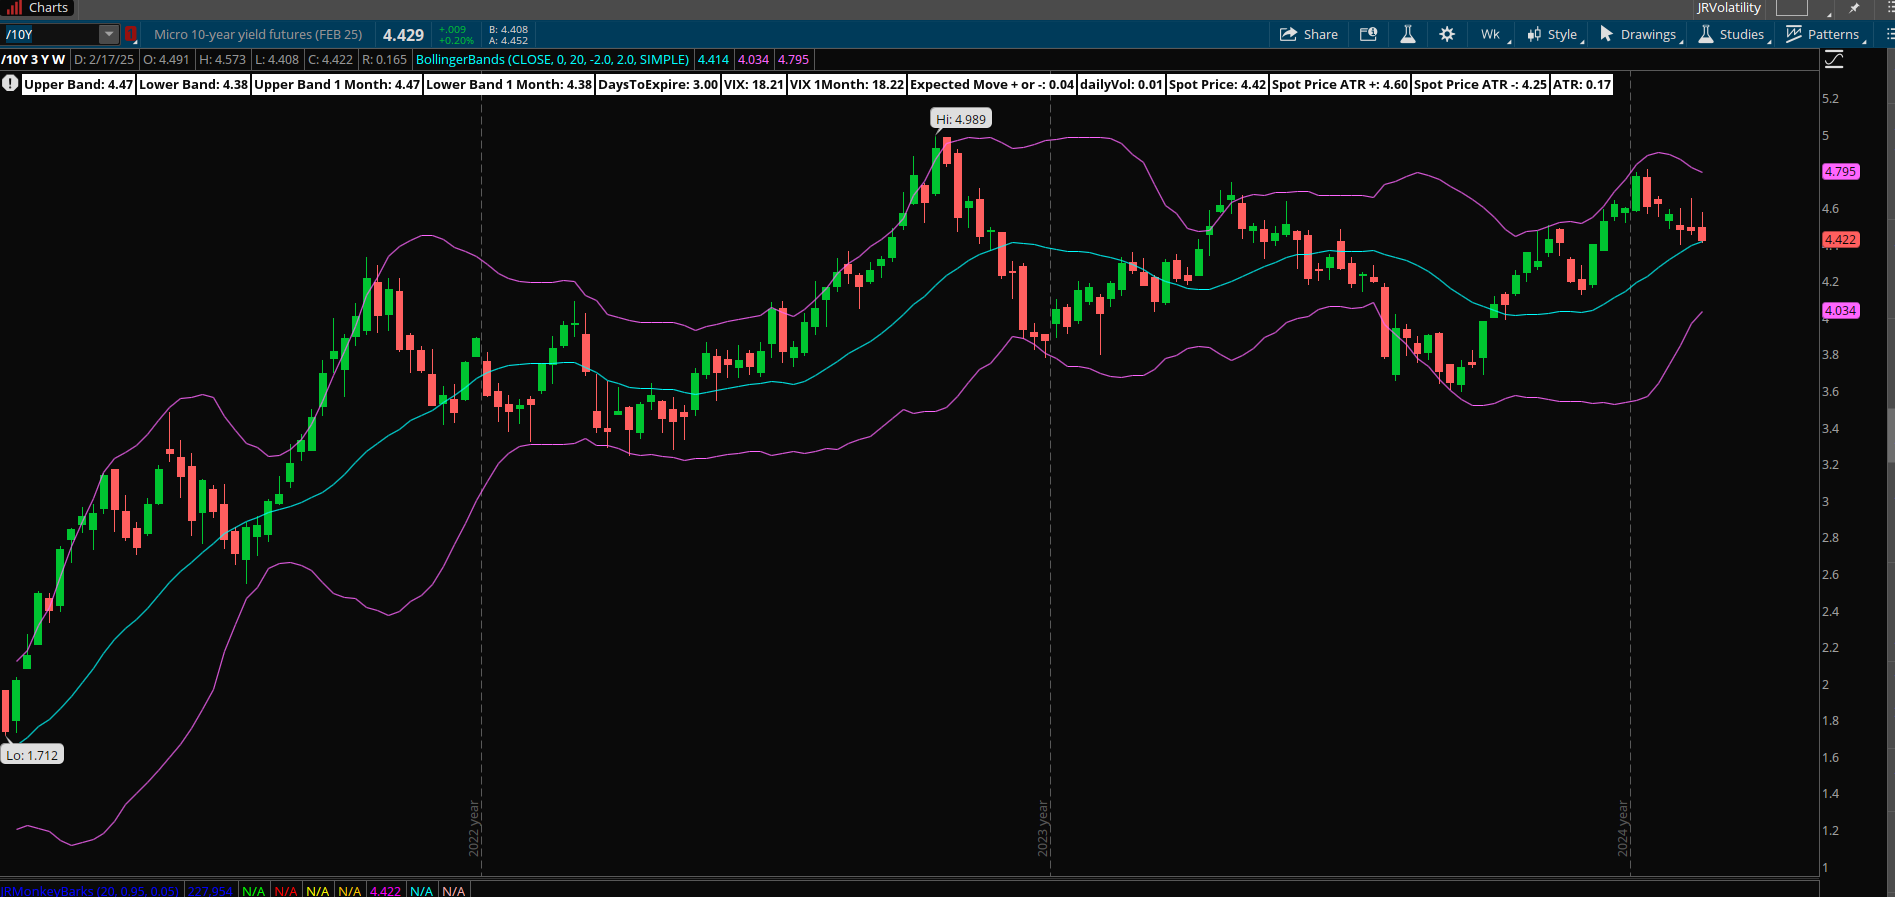
Long Term rates (10 year Treasury)
After the FOMC cut rates (December 2024 .25 basis point cut) there has been a steady increase in long term rates. Rates peaked in the first week of January 2025. Since this time they have declined to the midpoint of the range.
The bond market is forward-looking, and higher long-term yields can reflect worries about inflation remaining persistent, high government debt levels, or a shift toward stronger economic growth despite lower short-term interest rates.
A rise in long-term rates increases the discount rate used to value future earnings of companies. The higher the discount rate, the lower the present value of future cash flows, which generally depresses stock prices.
This is particularly impactful for growth stocks, where a significant portion of their value is derived from future earnings. Technology stocks ( the nazdaq 100 or 30 percent of the S&P 500), for example, may be more sensitive to rising rates.
Rising long-term rates may make bonds more attractive relative to equities, as the yield on government debt increases. As bond yields rise, investors may shift funds from the equity market (S&P 500) into bonds, causing selling pressure on stocks.
Trade Implications Based on Yields
Bullish for S&P 500 If:
Yields stay below 4.40% and decline toward 4.00%.
The Fed signals rate cuts or economic weakness reduces rate hike fears.
The bond market rallies, sending yields lower.
Bearish for S&P 500 If:
Yields push back above 4.50% and trend toward 4.80-5.00%.
Inflation data or Fed policy shifts favor higher rates.
Bond market weakness (selling) pushes yields higher.
The weekly 10 year treasury yield chart shows moved slightly lower to 4.40
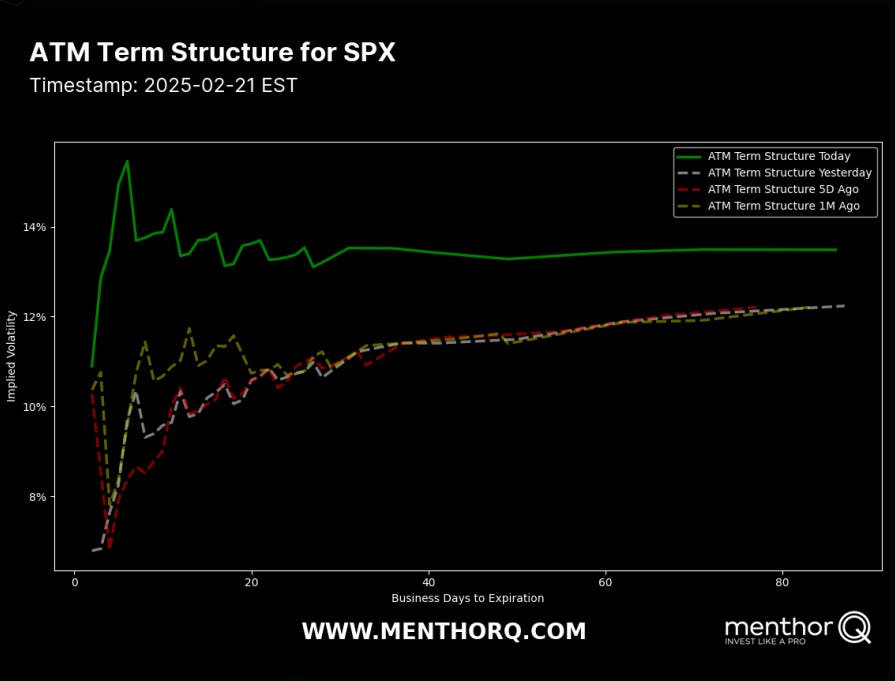
S&P 500 Term Structure
The chart below shows the S&P 500 term structure. The green shows today’s term structure. The short-term IV spike suggests upcoming risk, so hedging might be appropriate.
I list the major events below.
S&P 500 Cash Gamma levels
For the next 15 days market participants are mostly positioned bearish. This is reflected in the VIX spiking higher this week. VIX is in the middle of the 3 month range (current value 18.2).
Customer positioning moved lower from 5850 - 6050 over the past week.
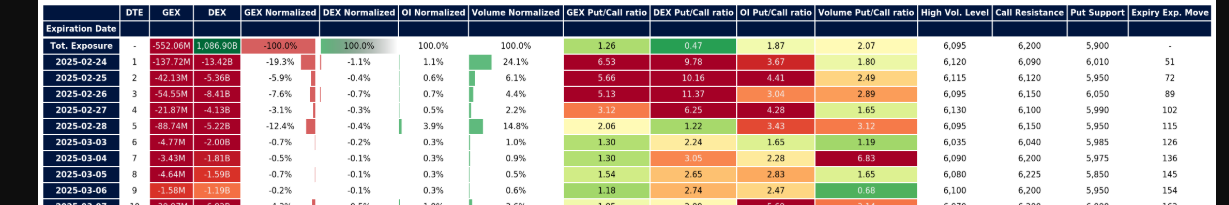
The Net Gex chart is showing that 6095 is a key level in the S&P 500 chart this week. Expect large price swings this week.
The high volume level is pointed to below.
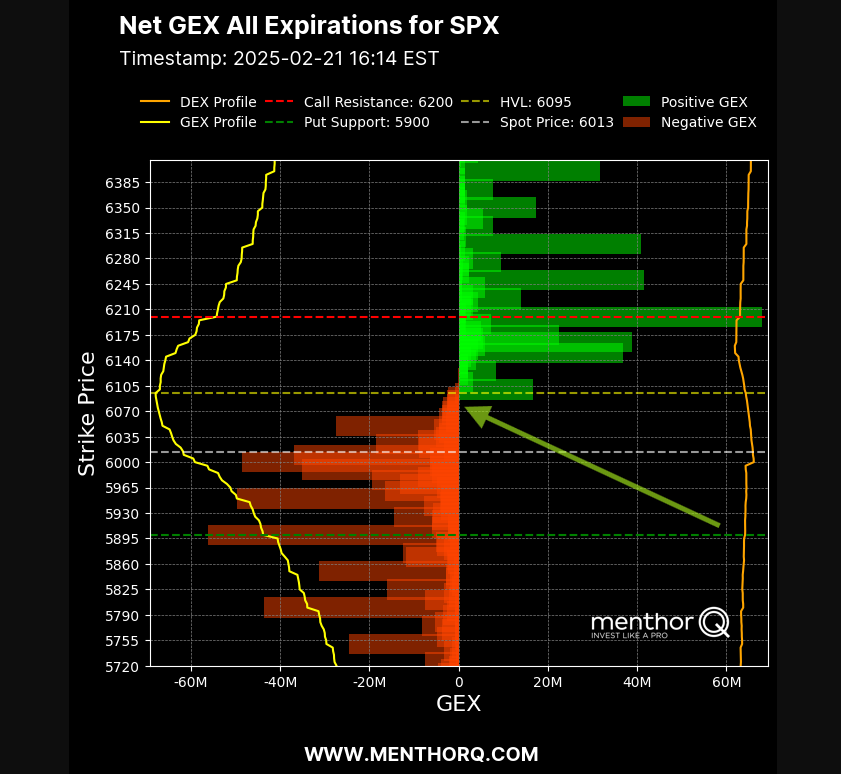
The market maker implied move for the S&P futures this week is +/- 112 points. Therefore the market maker expected range is between 6142 to 5918.
US Market Moving Events for the current week
I have listed the events in the order of significance (highest to lowest).
For the week of February 24 to February 28, 2025, several key economic events and notable earnings reports are scheduled in the United States.
Economic Events:
Monday, February 24:
No major economic releases are scheduled.
Tuesday, February 25:
S&P CoreLogic Case-Shiller Home Price Index (December): Provides insights into home price trends across major metropolitan areas.
Consumer Confidence Index (February): Measures consumer sentiment regarding economic conditions.
Wednesday, February 26:
New Home Sales (January): Reports on the sales of newly constructed single-family homes, indicating housing market strength.
Thursday, February 27:
Gross Domestic Product (Q4 Second Estimate): Offers a revised assessment of economic growth in the fourth quarter of 2024.
Durable Goods Orders (January): Reflects new orders placed with manufacturers for long-lasting goods, signaling manufacturing sector health.
Initial Jobless Claims (Week ending February 22): Provides data on the number of individuals filing for unemployment benefits, indicating labor market conditions.
Friday, February 28:
Personal Consumption Expenditures (PCE) Price Index (January): The Federal Reserve's preferred inflation measure, indicating changes in consumer prices.
Personal Income and Outlays (January): Reports on individual income levels and spending patterns, offering insights into consumer behavior.
Advance Economic Indicators Report (January): Includes data on international trade, retail, and wholesale inventories, providing a snapshot of economic activity.
Notable Earnings Reports:
Monday, February 24:
Zoom Communications are scheduled to report earnings.
Tuesday, February 25:
Home Depot and Intuit will release their quarterly results.
Wednesday, February 26:
Nvidia is set to announce its fourth-quarter earnings, marking the final report from the market-leading "Magnificent Seven" this earnings season.
Salesforce, Agilent Technologies, and Synopsys are also expected to report.
Thursday, February 27:
Autodesk, Royal Bank of Canada, and Dell Technologies will release earnings.
These events collectively offer a comprehensive view of the current economic landscape, encompassing monetary policy, corporate performance, housing dynamics, and consumer behavior. Investors and analysts will closely monitor these developments to inform their strategies and forecasts.
QQQ Weekly Chart
Looking at the QQQs or the Nasdaq100 futures are an important part of my trading plan. The XLK (technology ETF) represents a 33% component of the S&P500. Therefore I use this as an indicator to trade the S&P 500.
Notable levels in the QQQ:


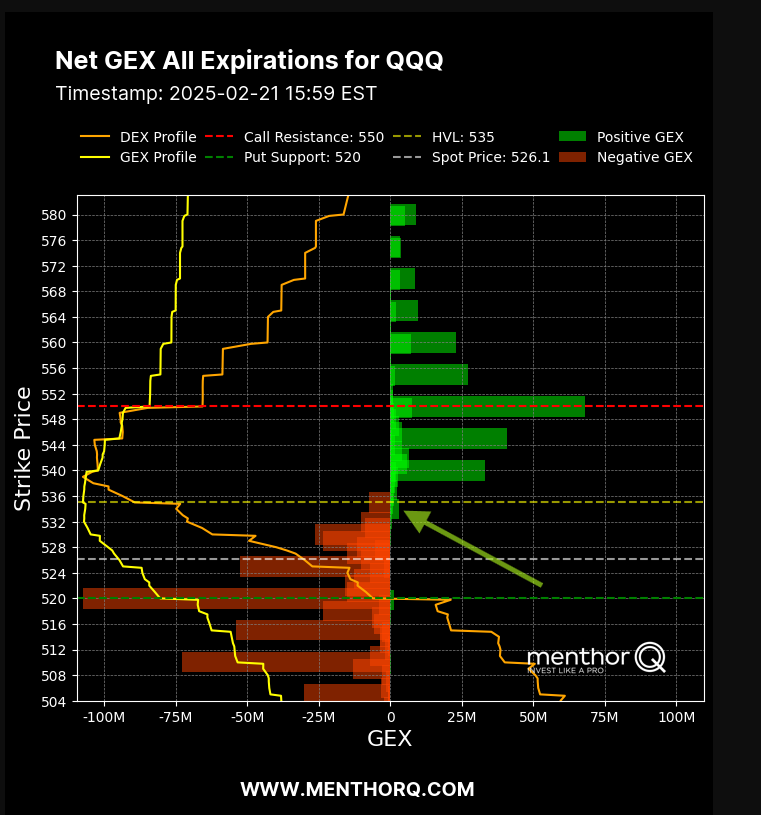
QQQ Gamma levels
The chart below shows the positioning information for QQQ. Current GEX profile is showing a negative gamma environment. Currently price is 526. The key inflection point is 535. Expect large price moves.
The Weekly Plan and trading idea
Going into this week, I am bullish with a expectation of mean reversion towards 6060 in the S&P futures or higher.
This is the minimum target.
I am long ES futures going into this week. Here are the Bullish/Bearish scenarios for the week. The moving average is based on the 4 hour chart.
Additionally I may sell SPX put spreads below last week’s low depending on the SPX and QQQ price action.
Have a successful trading week, by waiting for your trade setups to come to you. Always manage your risk and understand what you expect to lose prior to trade entry. By managing risk, you unlock profitability.
Gamma Level data (netgex data) and skew data (market sentiment) was provided by menthorQ.com
How I trade
I did a presentation of my trading process with menthorQ on how I trade the S&P 500. You can watch it here.
Disclaimer
Please don’t follow my idea(s) blindly. Do your own due dilligence before you attempt to trade. Again, always manage your risk.
Thank you for reading my weekly plan.
Joel