Weekly Plan for March 16
Weakness continued last week, with the S&P 500 moving higher Friday. Will Friday's bounce get sold this week or will it see consolidation before a move higher? I discuss my weekly plan below.

Summary
The S&P saw the fourth consecutive down week. It is down nearly 10% from the 6138 all time high. From reviewing the current market condition, I believe the S&P 500 is at a short term bottom. I expect price consolidation in the short term followed by a move higher.
Markets generally move between supply and demand areas. The chart below shows the S&P futures with key areas of supply and demand.
I have pointed to areas where price touched and bounced higher (demand). Recently during the March sell-off the S&P broke below this demand area (5800) and stopped near the September 2024 demand area (5500) low.
When distribution occurs, areas which were once demand zones become supply zones. Therefore a short term potential target becomes 5800 in the S&P futures.
Note, the analysis completed here is using ESH2025 contract and or the SPX cash index. The future’s contract expires the 3rd Friday of this month.
When converting equivalent pricing between ESH2025 and SPX that difference is approximately four points.
S&P futures Supply and Demand zones

S&P futures with Fibonacci Retracements
This chart points out the area where the S&P futures stopped falling. The area of demand which will was tested recently is in the 5500 price range. Notice the near perfect stop at September 2024 low.
I have placed Fibonacci retracements from the high 6138 to the 5500 area. Thursday formed a near term bottom at 5509. On Friday 3/14 high (PI day) price mean reverted to the 23.6% retracement level.
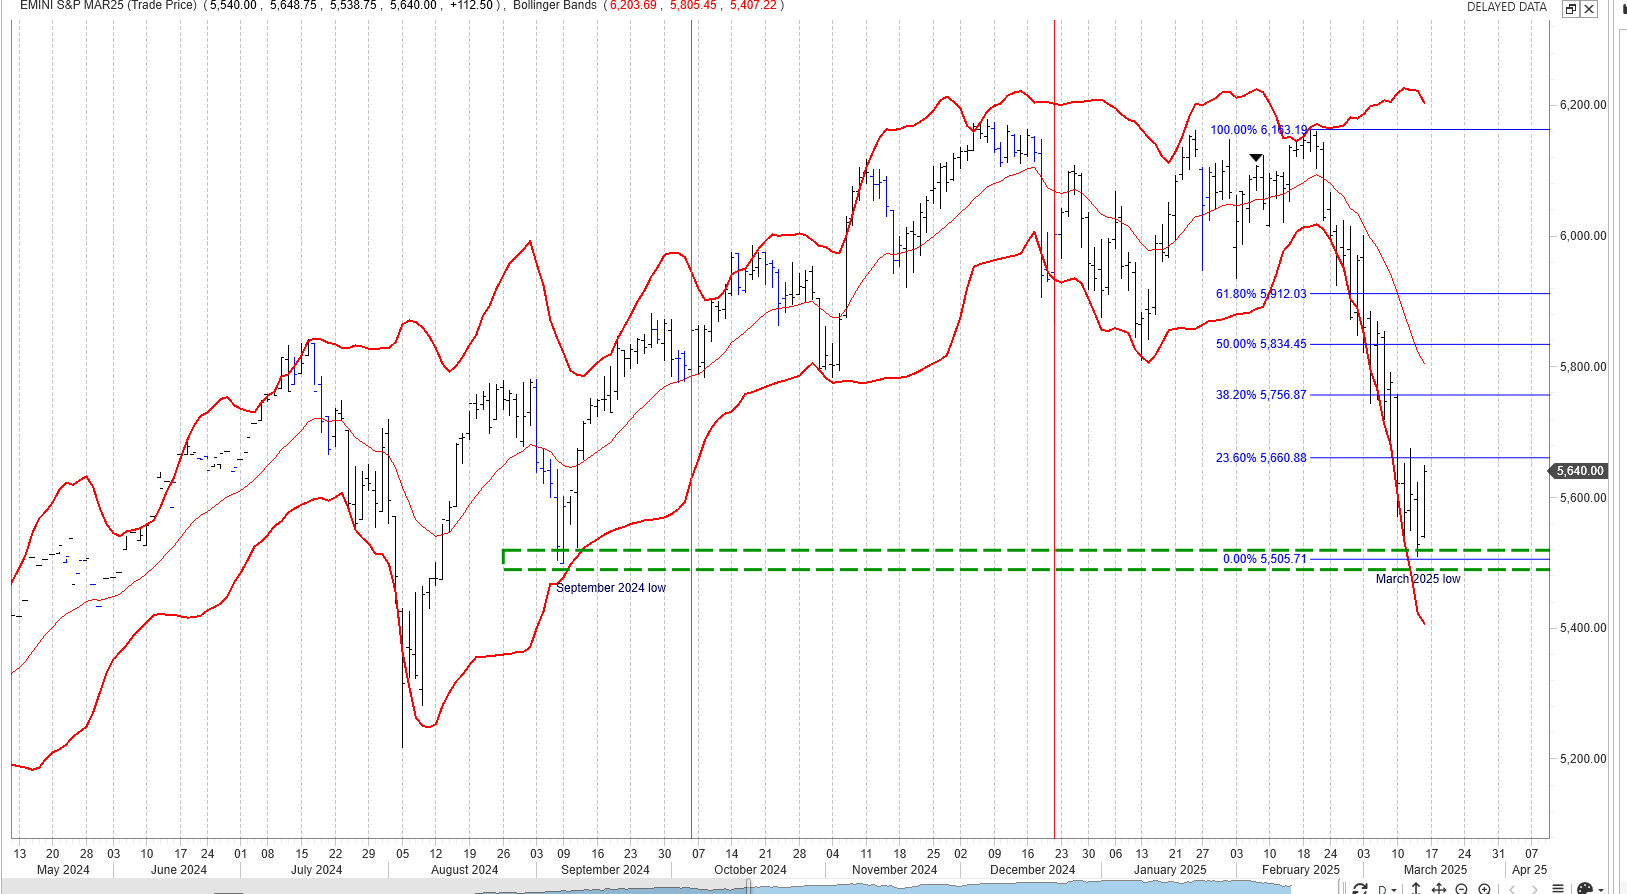
In my analysis below, I will review other factors which can provide clues as to whether this is a near term bottom.
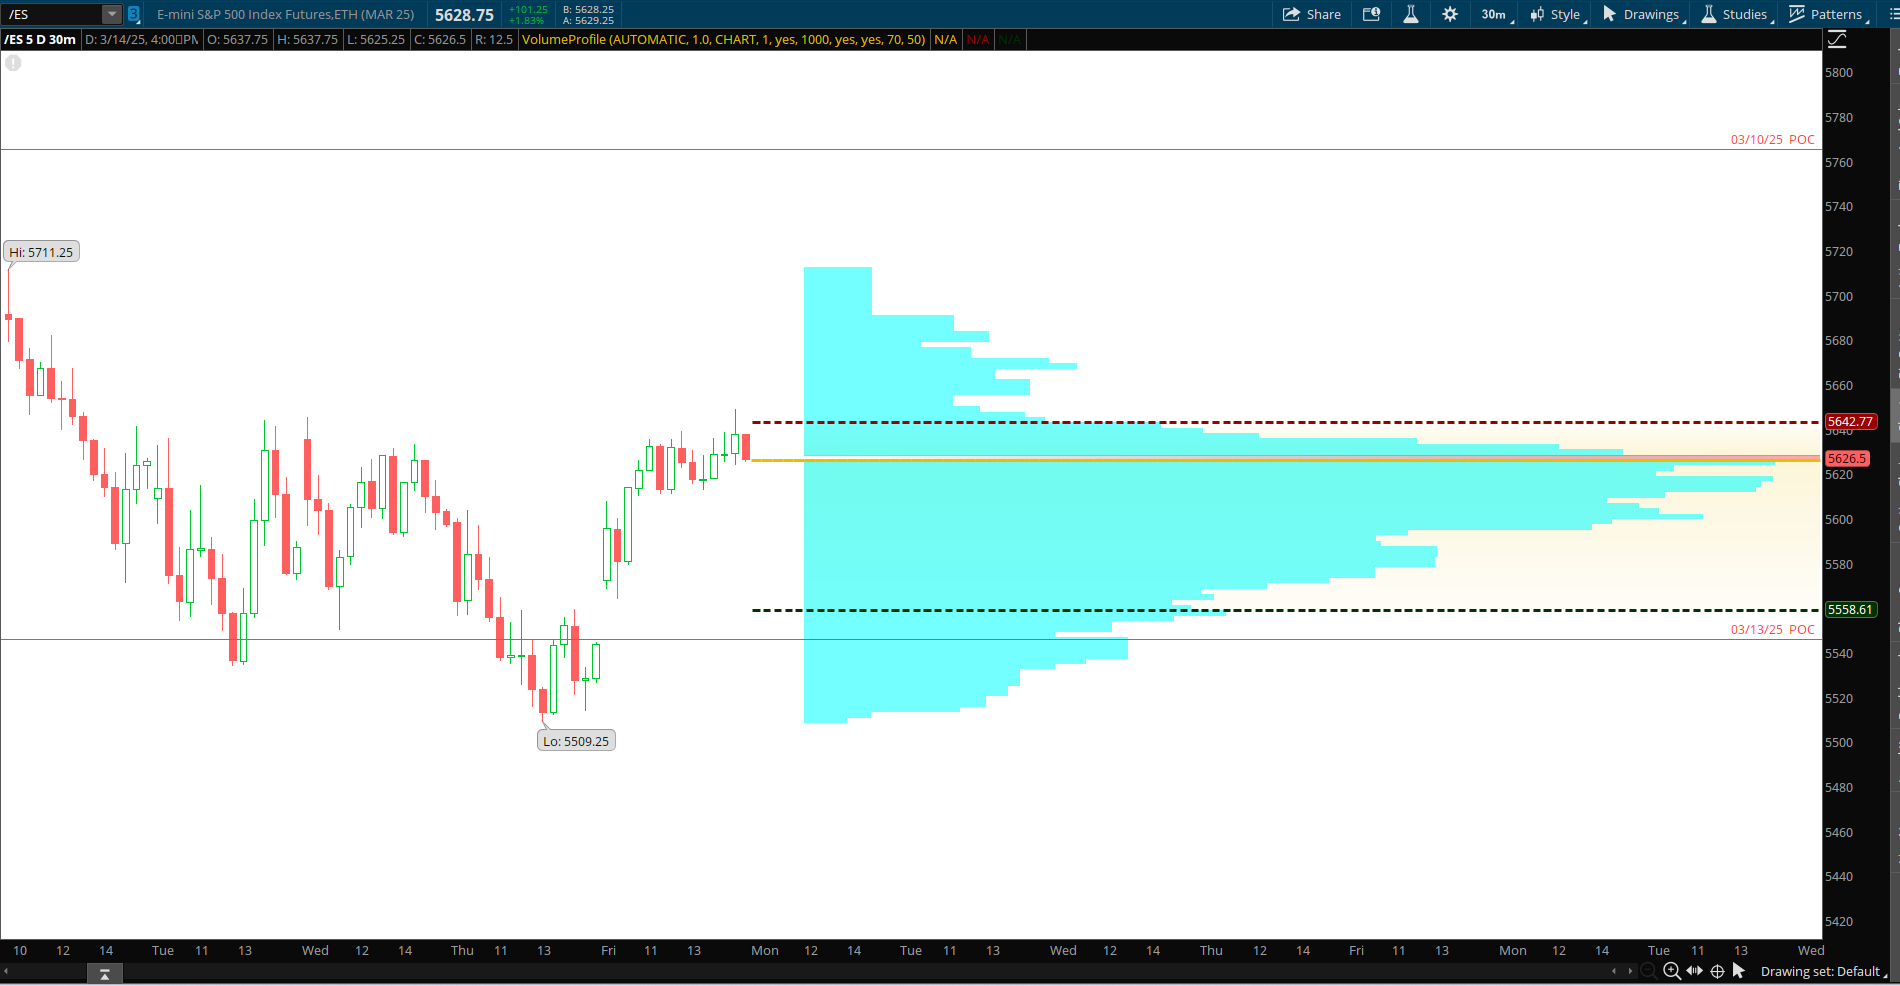
The Volume Profile View
The chart below shows the S&P futures (contract ES) 10 day daily volume profile chart. The data aggregation is done in 30 minute periods.
Short-Term Bias
On Friday, price formed an excess low. This implies that the down auction ended and can expect higher prices.
The point of control (highest volume area) migrated higher from the previous day and also did not touch the previous day’s point of control.
I have highlighted a potential upside target 5700 - 5750 if price mean-reverts higher.

Another way of looking at this is assuming that the last five days formed a balance area defined by the value area. This range is 5717 - 5505.
Value Area High: 5643
Point of Control: 5626
Value Area Low: 5558
If price moves above the value area high then target 5717 as the high of the 5 day range.
If price moves below the value area low then target 5509.
The Volume Profile View ( 20 days )
The chart below shows the S&P 500 futures volume profile for the last 20 days aggregated by 30 minute periods. I am showing the candlesticks on the left with the profile histogram on the right. The area boxed in on the right is the value area for the 20 days. As you may recall the value area contains 70 percent of the trading volume for the period.
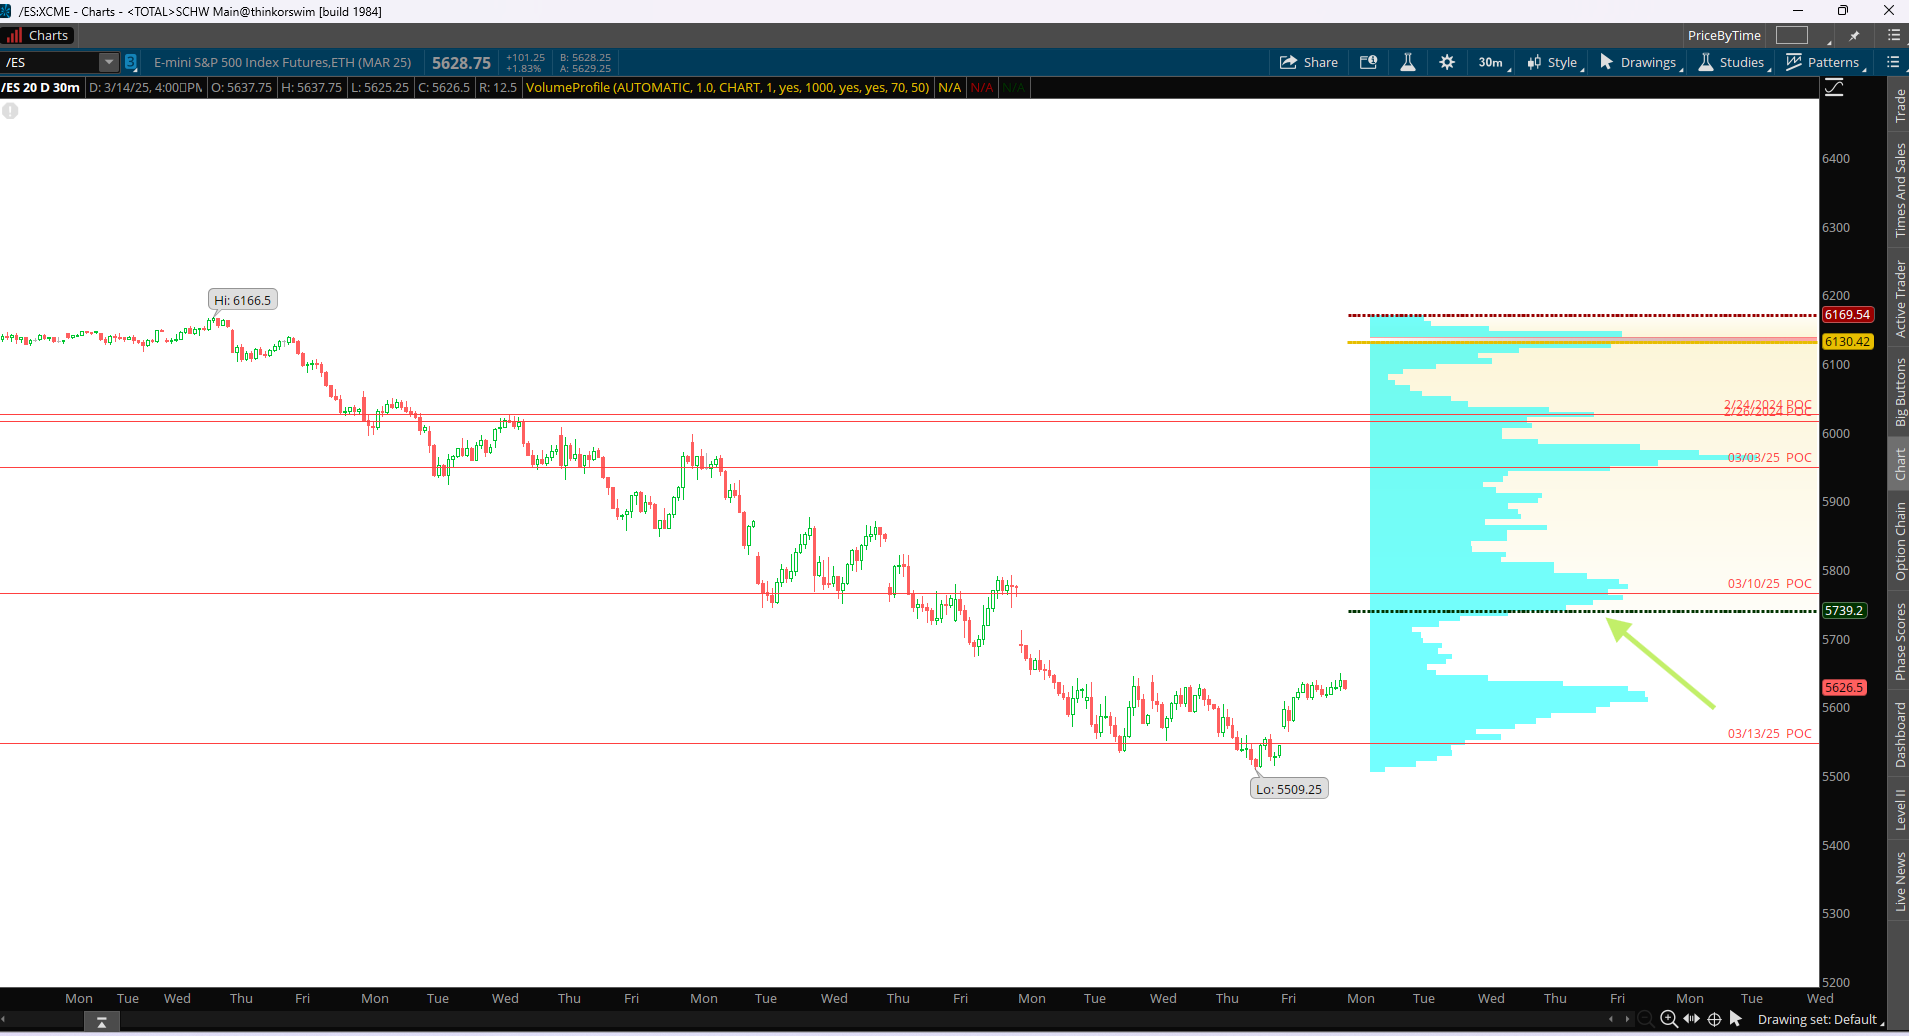
Note that the 20 day value area low is above the current price. Again showing an oversold market with a potential upside target.
The key levels are:
Value Area High: 6151
Point of Control: 6133
Value Area Low: 5739
Bullish Scenario
Continuation of the Bounce
If the market continues to hold above recent swing lows (near 5500–5550) and forms higher lows on the intraday charts, buyers could gain confidence. The first major test is likely the 5800–5825 high-volume area. This area coincides with a declining 20 day simple moving average (SMA).
Bearish Scenario
Failure to Sustain the Bounce
If the current rebound stalls beneath the 5800–5825 volume shelf and price quickly rejects that region, it signals continued selling pressure.
A move back below 5500 would reinforce the idea that the downtrend is resuming.
Breakdown Below Recent Lows (~5400–5450)
If sellers push price under 5400, it confirms a fresh leg down. The market may then seek the next lower high-volume node or untested support level.
A close below those swing lows on a daily chart would likely trigger stops and invite more bearish momentum.
Read about market profile and auction market theory here.
S&P 500 futures hourly chart
This chart shows 90 days of trading. The chart shows heikin candles using a 50 period simple moving average. Since mid February ( 17 - 19 ). Price would fail around this moving average. On Friday price closed above the moving average. Additionally observe that the slope of the moving average is approaching 0. This implies that the down move may have completed in the short term.
I will observe how price interacts with the moving average, noting whether it fails below it (5588). Staying above implies that the bullish scenario has a higher probability of success.

Bullish Scenario
Clear Break Above 65 SMA
A series of green Heikin-Ashi candles closing above the 65 SMA would suggest buyers are gaining control.
Watch for minimal lower wicks and expanding green bodies—these are typical signs of a budding uptrend in Heikin-Ashi.
Holding Above Prior Swing Resistance
If price can stay above the SMA on retests, it would confirm acceptance in higher territory.
Look for the market to reclaim intermediate resistance levels (e.g., any horizontal lines or POCs near 5600–5650, then higher at 5700–5800, etc.).
Upside Targets
First Target: The next significant high-volume node or horizontal resistance—possibly 5600–5650.
Second Target: A push toward 5700+, where a prior cluster of price action might act as resistance again.
Stretch Target: If momentum accelerates, price could retest the major breakdown zone around 5800 or higher.
Bearish Scenario
Rejection at 65 SMA
If the bounce fails and Heikin-Ashi candles remain red (with small upper wicks) near or below the SMA, it signals continued seller dominance.
A quick rejection and a return below recent pivot lows (~5500) would be a strong bearish sign.
Failure to Form Higher Lows
In Heikin-Ashi terms, if new candles keep printing lower highs and lower lows, the downtrend remains intact.
Look for red bodies with little to no lower wick, indicating momentum is still to the downside.
Downside Targets
Immediate Retest: The recent swing low around 5500.
Deeper Move: If 5500 is lost decisively, the next lower-volume area could accelerate price toward 5400 or any other major support identified on higher timeframes.
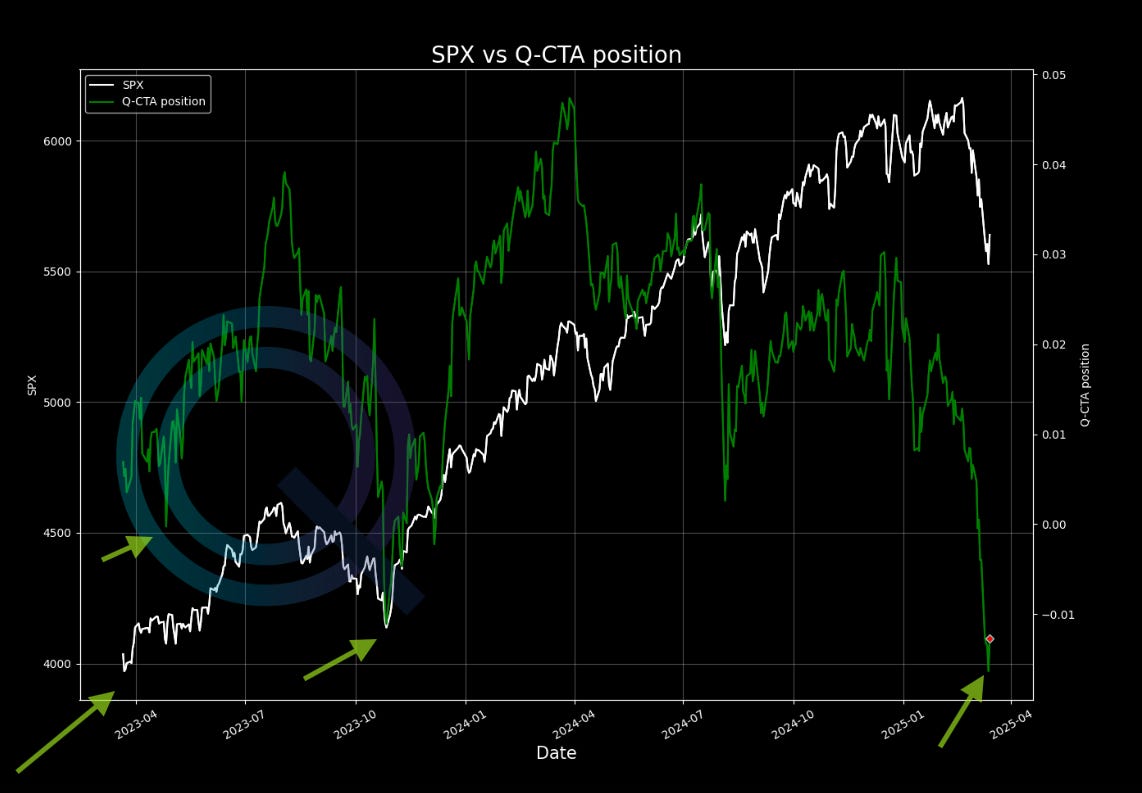
CTA Positioning
The chart shows the CTA positioning (Commodity Trading Advisor). I have added key levels in the CTA positioning near a SPX price bottom. This adds to the bullish case, if the market begins to move higher.
Management of last week’s plan
Last week I was looking for a mean-reversion trade in the market. Short calls via a broken wing butterfly above resistance were closed for a win. They were closed early in the week.
Last week’s plan is here.
The MenthorQ SKEW index
The MenthorQ skew index chart of S&P 500 cash index. The model shows 25 day risk reversal skew.
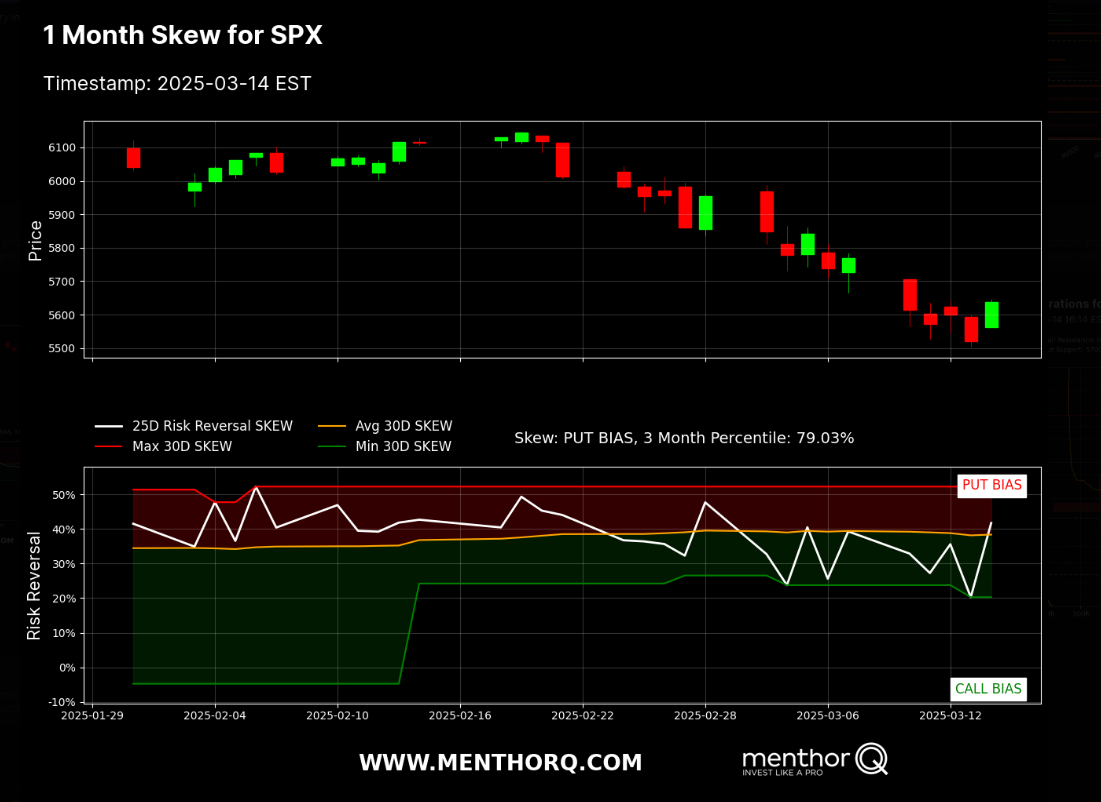
Observations:
The SPX 1-Month Skew is firmly in put territory and near the 79th percentile of its recent range, indicating elevated demand for downside protection. This aligns with the broader downtrend in the market and underscores a cautious or bearish sentiment environment. Whether this proves to be an overextended “fear” signal (potential contrarian buy) or a warning of continued selling pressure will hinge on how price and skew evolve in the coming days.
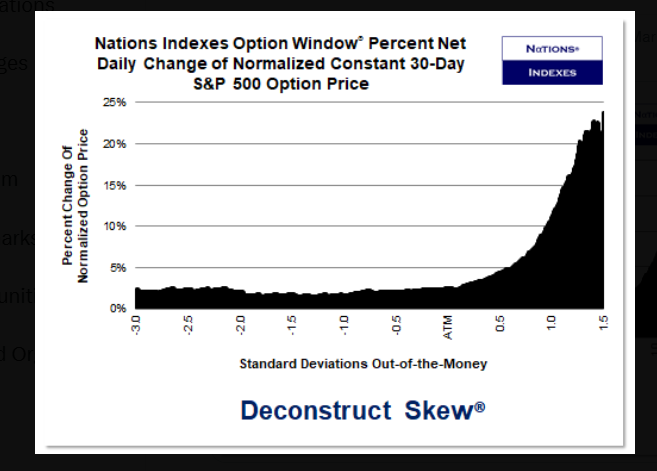
The Nation's Index
From 3/14/2025
Observations
Call Side Spike: The chart’s biggest change is on the right side (OTM calls), suggesting a notable one-day jump in call premiums.
Possible Sentiment Shift: A rapid rise in call prices can indicate traders are bracing for upside or unwinding shorts.
Long Term rates (10 year Treasury)
After the FOMC cut rates (December 2024 .25 basis point cut) there has been a steady increase in long term rates. Rates peaked in the first week of January 2025. Since this time they have declined. The yield is currently at 4.32
Between 4.5% and 5.0% on the 10-year yield is often viewed as a critical zone that could trigger a more pronounced sell-off in growth-oriented stocks.
A break above 4.5% would be the next major warning sign. If yields push toward 5%, many analysts expect a significant headwind for equity valuations, especially in tech.
S&P 500 Term Structure
The chart below shows the S&P 500 term structure. The green line shows today’s term structure. The term structure is lower compared to the previous day.
The short-term IV spike over the next few days suggests upcoming risk this week.
I list the major events below.

Smile Curve

As compared to five days ago, I observe the following:
Higher OTM Call IV Today: The far out‐of‐the‐money call premiums are higher today suggests that traders are paying more for upside protection or are positioning for a potential sharp rally.
Lower OTM Put IV Today: Lower OTM put IV suggests that the demand for downside protection has eased, indicating that market participants now perceive less risk of a significant decline.
This reduction in hedging demand for OTM puts is a positive sign of improving sentiment. With OTM calls increasing IV, It may also suggest that investors/traders are concerned about right tail risk.
S&P 500 Cash Gamma levels
Market participants are mostly positioned bearish. Price is still well below the high volume level (5940). This chart also confirms the outlook in the smile curve as we can observe increased gamma for OTM calls (right tail risk). The market is currently in a negative gamma environment.
With the price well below the high volume level, we expect market makers to trade in the direction of price. Expect large price swings this week.
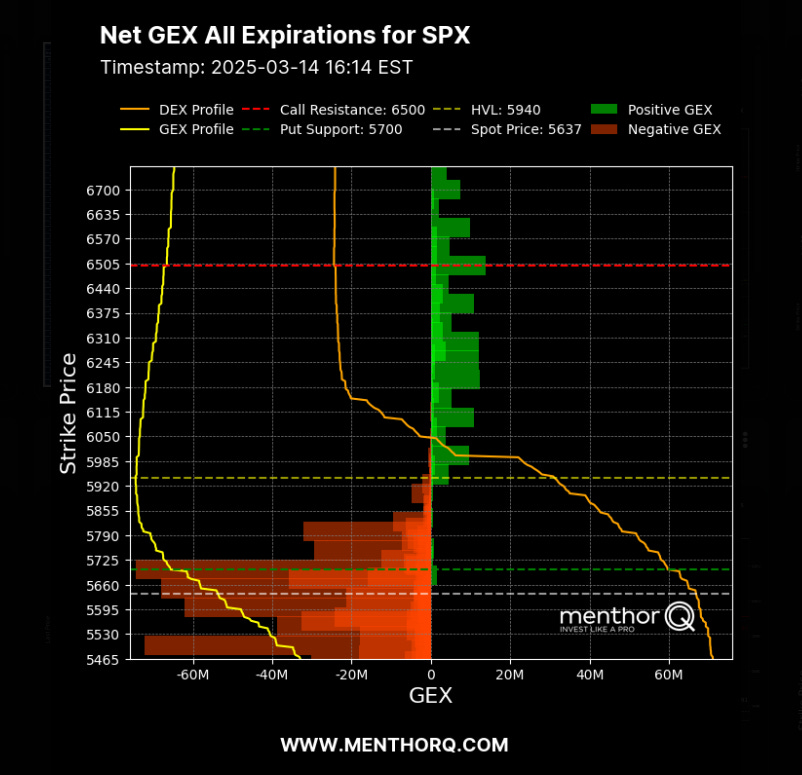
The market maker implied move for the S&P futures this week is +/- 140 points. Therefore the market maker expected range is between 5780 to 5500.
US Market Moving Events for the current week
I have listed the events in the order of significance (highest to lowest).
For the week of March 17 to March 21, 2025, several key economic events and notable earnings reports are scheduled in the United States.
US Nonfarm Payrolls / Employment Report (Friday, March 21, 2025)
Why It Matters:
The employment report is one of the most critical gauges of economic health. A surprise in job gains, wage growth, or unemployment figures can rapidly shift Fed policy expectations and investor sentiment, leading to increased market volatility.
US Consumer Price Index (CPI) Release (Wednesday, March 19, 2025)
Why It Matters:
As a key measure of inflation, the CPI report is vital in the current high-yield environment. A higher-than-expected reading could reinforce concerns about persistent inflation, potentially leading to further rate hikes and impacting growth valuations.
Federal Reserve Policy Signals / Meeting Minutes (Possible Release on Wednesday or Thursday)
Why It Matters:
If the Fed releases meeting minutes or additional policy commentary this week, it will provide insight into their outlook on inflation and economic growth. Such guidance can sway market expectations about future rate moves and risk appetite.
ISM Manufacturing Index (Monday, March 17, 2025)
Why It Matters:
This index offers an early snapshot of business conditions in the manufacturing sector. Since manufacturing is closely tied to economic growth, a weaker-than-expected reading can weigh on market sentiment early in the week.
University of Michigan Consumer Sentiment Index (Tuesday, March 18, 2025)
Why It Matters:
Consumer confidence is a leading indicator of spending and economic activity. Changes in sentiment can provide clues about future consumer spending trends and overall economic momentum.
These events collectively offer a comprehensive view of the current economic landscape, encompassing monetary policy, corporate performance, housing dynamics, and consumer behavior. Investors and analysts will closely monitor these developments to inform their strategies and forecasts.
QQQ Weekly Chart
Looking at the QQQs or the Nasdaq100 futures are an important part of my trading plan. The XLK (technology ETF) represents a 33% component of the S&P500. Therefore I use this as an indicator to trade the S&P 500.
QQQs closed at a key area 479. If this area fails to hold the next lower target is 453.

QQQ Gamma levels
The chart below shows the positioning information for QQQ. Current GEX profile is showing a negative gamma environment. Currently price is 480. The key inflection point is 495. Expect large price moves.

The Weekly Plan and trading idea
I am currently holding broken wing butterflies for mid-week. These spreads were placed for credit with a large wing span of 35 points. They were put placed on Friday when the market experienced a 100 point short squeeze.
Key Levels for the week
5519: Critical support within the last 10 days. A break below implies sellers are in control, possibly leading to a sharper decline.
5792 : Key resistance within the last 10 days. A breakout above indicates buyers are willing to pay higher prices, potentially fueling an upside move.
Within 5519–5792: Expect range-bound or rotational price action unless a significant catalyst shifts the market’s perception of fair value.
From a number of technical indicators, S&P 500 is showing oversold levels. It is important for price to break above key levels to go from a bearish to bullish environment.
Although the market is experiencing higher volatility with large swings in both directions; I believe from a risk to reward viewpoint that there is a greater probability of the market moving higher over the next few weeks.
Have a successful trading week, by waiting for your trade setups to come to you. Always manage your risk and understand what you expect to lose prior to trade entry. By managing risk, you unlock profitability.
Gamma Level data (netgex data) and skew data (market sentiment) was provided by menthorQ.com
How I trade
I did a number of presentations of my trading process with menthorQ. You can find them here. This is under the highlights section of my “x” account found here.
Disclaimer
Please don’t follow my idea(s) blindly. Do your own due dilligence before you attempt to trade. Again, always manage your risk.
Thank you for reading my weekly plan.
Joel