


Weekly Plan for March 2
Another volatile week for the S&P 500. The index was lower 1% for the week. What caused the volatility this past week and what I am seeing for the week ahead. I discuss my weekly plan below.

Summary
The S&P was down aproximately 60 points for the week, however from high to low it moved more than 180 points. For most of the week, I was bullish expecting a bullish reversion move to the mean. On Friday, that move happened.
The previous week Friday 2/21, I put on a small LONG futures trade. This trade ended up being a loss. For the week, I sold out of the money SPX PUTS as I expected a mean reversion trade to occur. I did not sell out of the money SPX CALLS. On Friday, SPX mean reverted 81 points. Now what do we do?
The Volume Profile View
The chart below shows the S&P futures (contract ES) 10 day daily volume profile chart. The data aggregation is done in 30 minute periods.
There are number of nuances that I will point out below:
On Thursday, the market made a poor low, whiich are multiple periods ending at the exact same level. I have drawn an arrow.
On Friday, the market dropped below Thursday’s low and created excess. This is a minimum of at least 2 periods forming a tail. I have pointed an arrow to the tail area. This potentially means that the down auction is over.
Friday formed 2 distributions. This is formed by a area of single prints. I have circled this area. Single prints are emotional trades, and most likely short covering is occuring. This area is circled in Friday’s distribution. The single prints occured during the last two hours of Friday’s trading session.
Price moved into the previous 3 day balance area. We can see that the point of control is in the same area for Tuesday through Thursday. This implies that bears are running of steam and are failing to push prices much lower.

Additional Observations:
Point of Control (POC) Levels:
02/28/25 POC: Around 5900 – Most traded price for the session.
02/26/24 & 02/24/24 POC: Near 6020, indicating a past high-volume area that may act as resistance.
Current Price Action:
The price rebounded from 5848, showing buying interest near the lower boundary.
Price is testing the 5950–5960 zone, where there is a volume bulge (green circle).
If buyers fail to sustain above this area, a rejection could lead to a move back toward 5900 and below.
High & Low Volume Nodes:
High-Volume Node (HVN) at 5950–5960: Price is consolidating here, and acceptance above this could push towards 6020–6050.
Low-Volume Node (LVN) around 5920: If price drops below this, it could quickly revisit 5900 and possibly 5848.
Potential Scenarios:
Bullish Case:
Holding above 5950–5960 → Targets 6020–6050.
Breakout above 6050 → Strong move towards 6133.
Bearish Case:
Rejection from 5950–5960 → Target 5900, then 5848.
Failure below 5848 → Possible further downside.
The Volume Profile View ( 20 days )
The chart below shows the S&P 500 futures volume profile for the last 20 days aggregated by 30 minute periods. I am showing the candlesticks on the left with the profile histogram on the right. The area boxed in on the right is the value area for the 20 days. As you may recall the value area contains 70 percent of the trading volume for the period.

I have listed the value area over the last few weeks. Note, that the value area low migrated lower, however the point of control remained at the same level as the previous week.
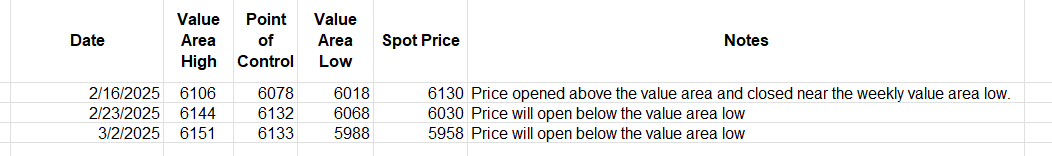
The key levels are:
Value Area High: 6151
Point of Control: 6133
Value Area Low: 5988
Observations:
Volume Profile Analysis:
The Point of Control (POC) levels:
02/28/25 POC: 5950 (current volume concentration).
02/24/2024 & 02/26/2024 POC: near 5975, indicating strong past trading activity.
High-Volume Node (HVN): Around 6000–6050 (Green box) – Indicates resistance where past heavy trading occurred.
Low-Volume Node (LVN): Below 5900, suggesting potential for rapid price movement.
Current Price Action:
Price is currently near 5958, rebounding from the low of 5848.
Approaching the high-volume resistance zone (5988–6050).
A strong move above 6050 could trigger a rally towards 6133–6152.
Key Trade Levels:
Bearish Scenario:
Rejection at 6000–6050 → Short entry targeting 5950 and 5848.
Break below 5950 (POC) → Possible move towards 5900 & 5848.
Bullish Scenario:
Acceptance above 6000 → Price likely to revisit 6133 & 6152.
Breakout above 6050 → Strong continuation possible towards higher resistance.
Read about market profile and auction market theory here.
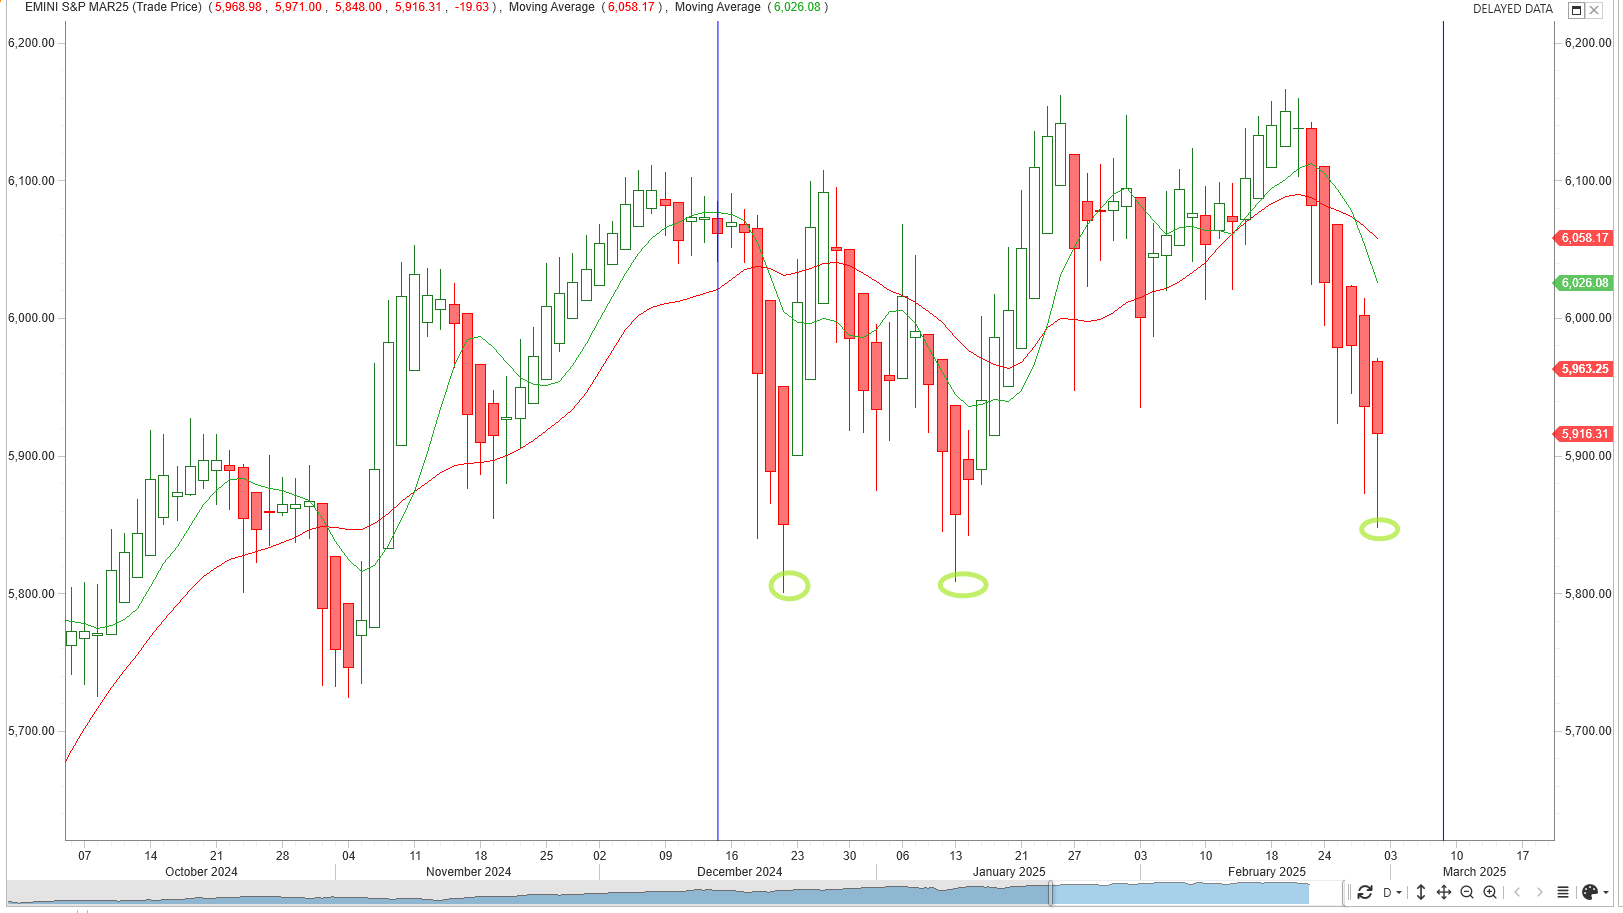
S&P 500 futures hourly chart
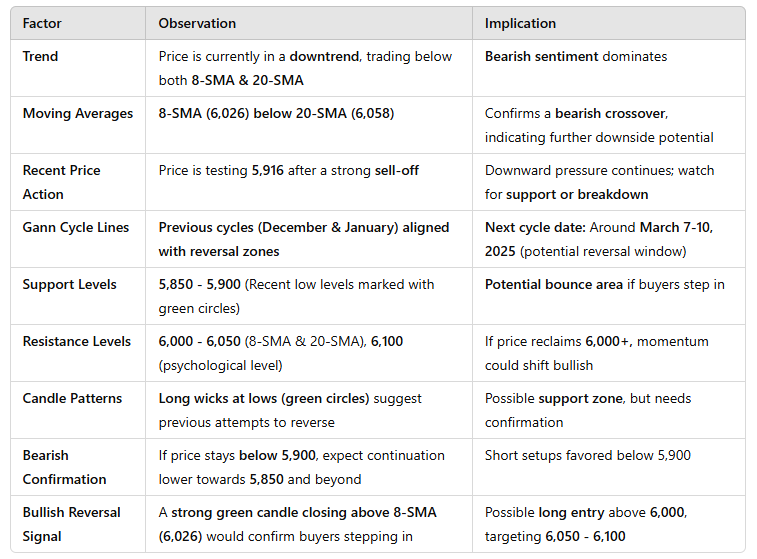
This chart shows 90 days of trading. The chart shows heikin candles with both an 8 day simple moving average and 20 day simple moving average attached. I have added GANN cycle which can show potential time frames for a trend reversal. The circled areas are placed where support was found and price bounced higher.
Observations
Management of last week’s plan
Last week I was looking for a mean-reversion trade in the market. My thesis was selling put spreads below the support level in the SPX (this worked!).
Additionally, I attempted to go long small amount MES ( micro-es futures). This was stopped out for a loss.
I did not sell any call spreads. Overall this plan worked out as short puts were monetized.
Last week’s plan is here.
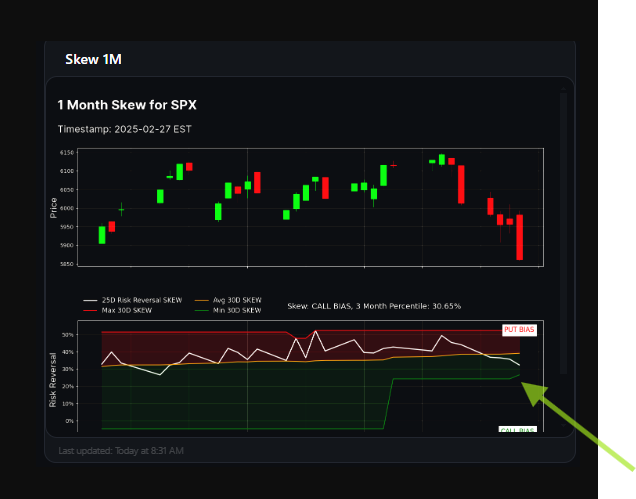
The MenthorQ SKEW index
The MenthorQ skew index chart of S&P 500 cash index. The model shows 25 day risk reversal skew. This chart was generated Thursday evening showing a potential bearish to bullish reversal.
Observations:
SPX Price Action (Top Chart):
The candlestick chart shows SPX in a downtrend with multiple consecutive red candles.
Recent price weakness suggests increased bearish sentiment.
Risk Reversal Skew (Bottom Chart):
The white line represents the 25D Risk Reversal SKEW (difference between implied volatility of calls vs. puts).
The green zone indicates call bias, while the red zone represents put bias.
The skew has just moved into the call bias zone after being in the put bias zone for an extended period.
Put vs. Call Bias Shift:
The chart shows a recent shift from Put Bias to Call Bias (green arrow).
Historically, this could indicate that the market is starting to price in upside potential.
Current Skew Metrics:
Skew Call Bias: 3-month percentile at 30.65%.
This means the skew is in the lower third of its range, suggesting a potential reversal in sentiment.
The Nation's Index
From 2/28/2025
The S&P cash index made extreme movements over the last 120 minutes of trading on Friday. It rallied from 5850 to 5960.
Puts are at an extreme low in value, meaning downside protection is very cheap.
If the market remains stable, put prices may stay suppressed.
If fear returns, expect a rapid repricing of put options, causing higher implied volatility and a steeper skew.

Long Term rates (10 year Treasury)
After the FOMC cut rates (December 2024 .25 basis point cut) there has been a steady increase in long term rates. Rates peaked in the first week of January 2025. Since this time they have declined to the midpoint of the range.
The bond market is forward-looking, and higher long-term yields can reflect worries about inflation remaining persistent, high government debt levels, or a shift toward stronger economic growth despite lower short-term interest rates.
A rise in long-term rates increases the discount rate used to value future earnings of companies. The higher the discount rate, the lower the present value of future cash flows, which generally depresses stock prices.
This is particularly impactful for growth stocks, where a significant portion of their value is derived from future earnings. Technology stocks ( the nasdaq 100 or 30 percent of the S&P 500), for example, may be more sensitive to rising rates.
Rising long-term rates may make bonds more attractive relative to equities, as the yield on government debt increases. As bond yields rise, investors may shift funds from the equity market (S&P 500) into bonds, causing selling pressure on stocks.
Trade Implications Based on Yields
A close below 4.19% signals continuation lower to 4.06%.
If yields drop further, watch for rate-sensitive assets like tech & gold to rally.
If economic data surprises strong, yields could bounce back above 4.28%.
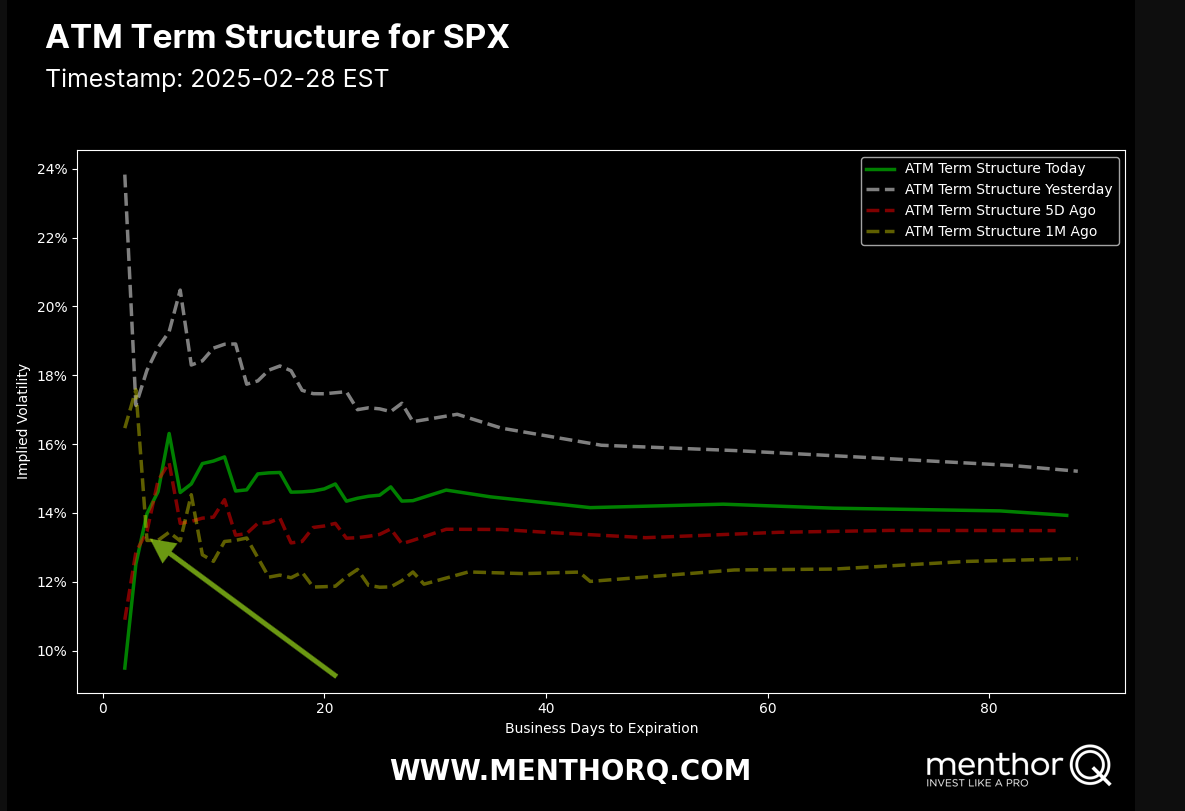
S&P 500 Term Structure
The chart below shows the S&P 500 term structure. The green shows today’s term structure. The short-term IV spike suggests upcoming risk, so hedging might be appropriate.
I list the major events below.
S&P 500 Cash Gamma levels
Market participants are mostly positioned bearish. This is reflected in the VIX moving higher this week. The VIX 19.63 remains in backwardation (VIX slightly higher than VIX futures currently 18.93). The VIX moving lower is generally bullish for stocks.
Customer positioning is in the 5850 - 6050 last week.
The Net Gex chart is showing that 6035 (high volume level, arrow below) is a key level in the S&P 500 cash chart this week. Expect large price swings this week.

The market maker implied move for the S&P futures this week is +/- 122 points. Therefore the market maker expected range is between 6080 to 5836.
US Market Moving Events for the current week
I have listed the events in the order of significance (highest to lowest).
For the week of March 2 to March 8, 2025, several key economic events and notable earnings reports are scheduled in the United States.
1. U.S. Economic Indicators
February Employment Report (March 7): The Bureau of Labor Statistics will release employment data, including nonfarm payrolls and the unemployment rate. This report will provide insights into the labor market's health and potential implications for Federal Reserve policy. investopedia.com
ISM Services PMI (March 5): The Institute for Supply Management will publish its Services Purchasing Managers' Index, offering a gauge of the service sector's economic activity.
2. Corporate Earnings Reports
Several major companies are scheduled to release earnings reports, which could impact market sentiment:
March 4:
Target Corporation (TGT): The retail giant's performance will offer insights into consumer spending trends.
March 6:
Broadcom Inc. (AVGO): As a significant player in the semiconductor industry, its results will be indicative of tech sector health. investors.com
Costco Wholesale Corporation (COST): The retailer's earnings will shed light on wholesale and consumer demand.
3. Geopolitical Developments
U.S. Tariffs Implementation (March 3): President Trump's tariffs on imports from Mexico, Canada, and China are set to take effect, potentially influencing global trade dynamics and market reactions. investopedia.com+3reuters.com+3investors.com+3
These events collectively offer a comprehensive view of the current economic landscape, encompassing monetary policy, corporate performance, housing dynamics, and consumer behavior. Investors and analysts will closely monitor these developments to inform their strategies and forecasts.
QQQ Weekly Chart
Looking at the QQQs or the Nasdaq100 futures are an important part of my trading plan. The XLK (technology ETF) represents a 33% component of the S&P500. Therefore I use this as an indicator to trade the S&P 500. The QQQ moved lower by 3% last week. This acted as a drag on the S&P 500.

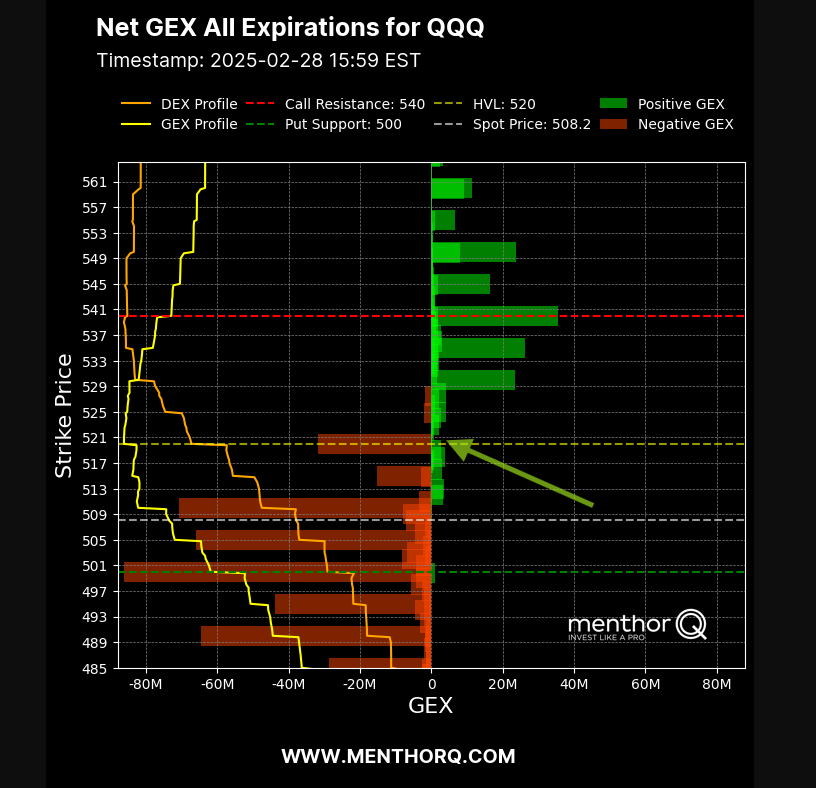
QQQ Gamma levels
The chart below shows the positioning information for QQQ. Current GEX profile is showing a negative gamma environment. Currently price is 508. The key inflection point is 520. Expect large price moves.
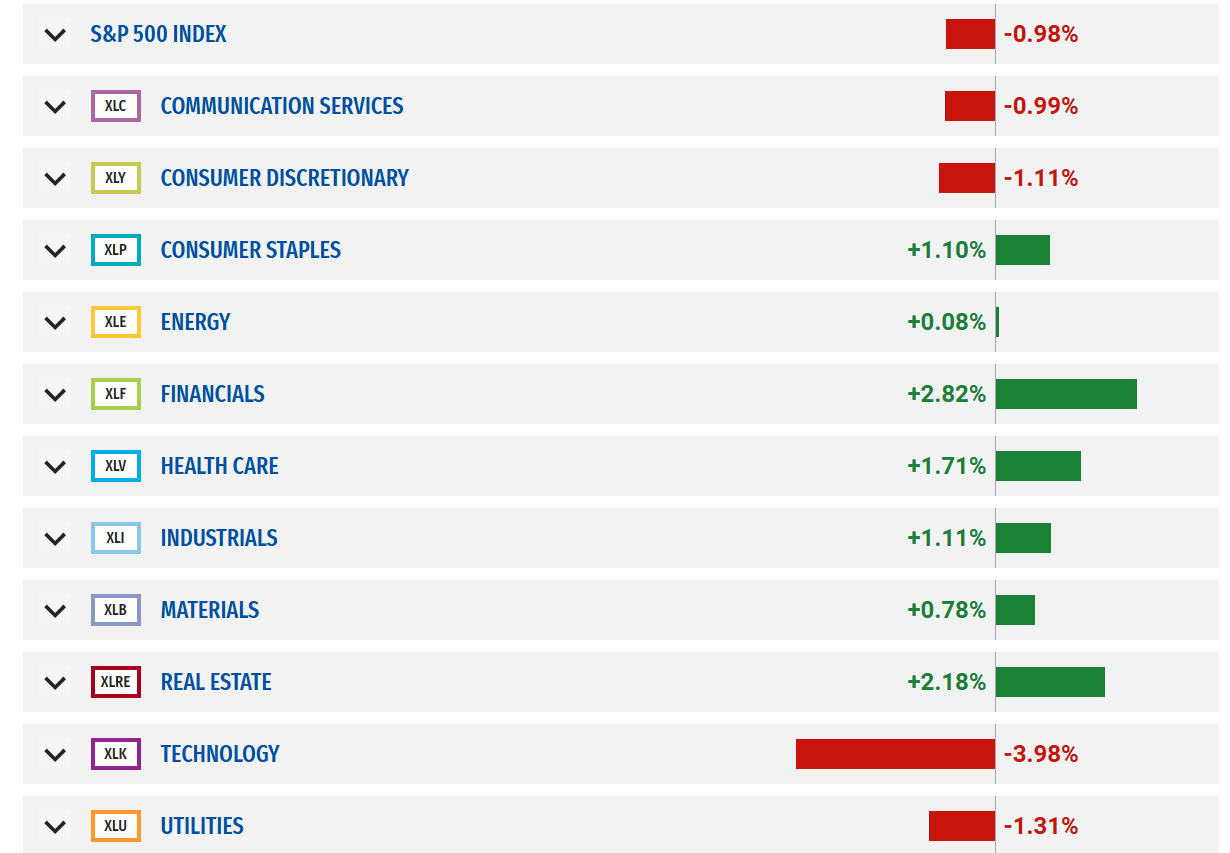
SPX Sector Performance
The market has gone through rotation as growth was sold and value purchased. Note that XLK ( 4% down) for the week. Financials, energy, health care were higher.
The Weekly Plan and trading idea
Going into this week, I am bullish holding short SPX put spreads below the 5750 area. This trade was put on Thursday and Friday. As noted above, the market had moved into a support area. It will get managed taking 80 percent of the credit received.
Key Levels for the week
🔴 Major Resistance 6,133 – 6,152 Volume Profile High (HVN)
- Heavy resistance where sellers have previously stepped in.
- Near March 7 NFP Report impact zone.Short bias if rejected.
Look for put spreads or short futures if SPX fails at this level.
🟡 Intermediate Resistance 6,000 – 6,050 Point of Control (POC) zone from prior sessions.
- Key level where institutional volume concentrated.
- Psychological round number.If SPX holds above, bullish breakout possible.
Go long above 6,050 targeting 6,100+.
⚪ Pivot Zone (Key Inflection Point) 5,950 – 5,975 Current price consolidation zone.
- Neutral zone where bulls & bears are fighting for control.Watch for breakout/breakdown.
Go long if SPX holds above 5,975.
Short below 5,950 targeting 5,900.
🟢 Major Support Zone 5,850 – 5,900 Volume Shelf from past sessions.
- March 7 Gann Cycle potential reversal zone.
- Previous bounce point from last pullback.Long bias if SPX holds above.
Consider buying calls or selling puts around 5,850.
🟣 Breakdown Risk Zone 5,800 – 5,850 Low-Volume Node (LVN)
– Risk of acceleration downward.
- Break of this zone can trigger volatility spike.If broken, expect sharp move down.
Short below 5,850 targeting 5,750.
🚨 Extreme Downside Risk 5,750 – 5,700 Bearish target in case of strong sell-off.
- SPX Put Skew reversion zone (cheap puts may spike in value).Hedge with long puts if SPX trends toward this zone.
Have a successful trading week, by waiting for your trade setups to come to you. Always manage your risk and understand what you expect to lose prior to trade entry. By managing risk, you unlock profitability.
Gamma Level data (netgex data) and skew data (market sentiment) was provided by menthorQ.com
How I trade
I did a presentation of my trading process with menthorQ on how I trade the S&P 500. You can watch it here.
Disclaimer
Please don’t follow my idea(s) blindly. Do your own due dilligence before you attempt to trade. Again, always manage your risk.
Thank you for reading my weekly plan.
Joel

Excellent analysis and detail Joel !