


Weekly Plan for March 23
After four down weeks, the S&P 500 moved higher for the week. There is potential for the S&P 500 to continue mean reverting higher. I discuss my weekly plan below.

Summary
Finally an up week! The S&P moved higher last week by .5%. With volatility declining, I see continued movement higher this week. Potentially backtesting areas on the chart which should act as supply. In the analysis below, I point out various areas of potential supply where sellers may engage and bring the price lower.
Markets generally move between supply and demand areas. The chart below shows the S&P futures with key areas of supply and demand.
Note, the analysis completed here is using the ESM2025 contract and or the SPX cash index. The future’s contract expires the 3rd Friday of June 2025.
When converting equivalent pricing between ESM2025 and SPX (S&P 500 cash index) that difference is approximately 52 points. This price spread declines as it gets closer to contract expiration.
S&P futures Supply and Demand zones
One ultimate target is the 5837 zone. This area acted as support numerous times throughout 2024. This could be a potential target where price consolidates and moves higher or is rejected and falls below. For this week, it could act as a potential target.
Numerouse times this as acted as support, as price is back-testing from below, I would expect an initial bounce lower once tested.
With the S&P futures closing at 5715 last week, price would need to move higher by approximately 125 points to reach this target.

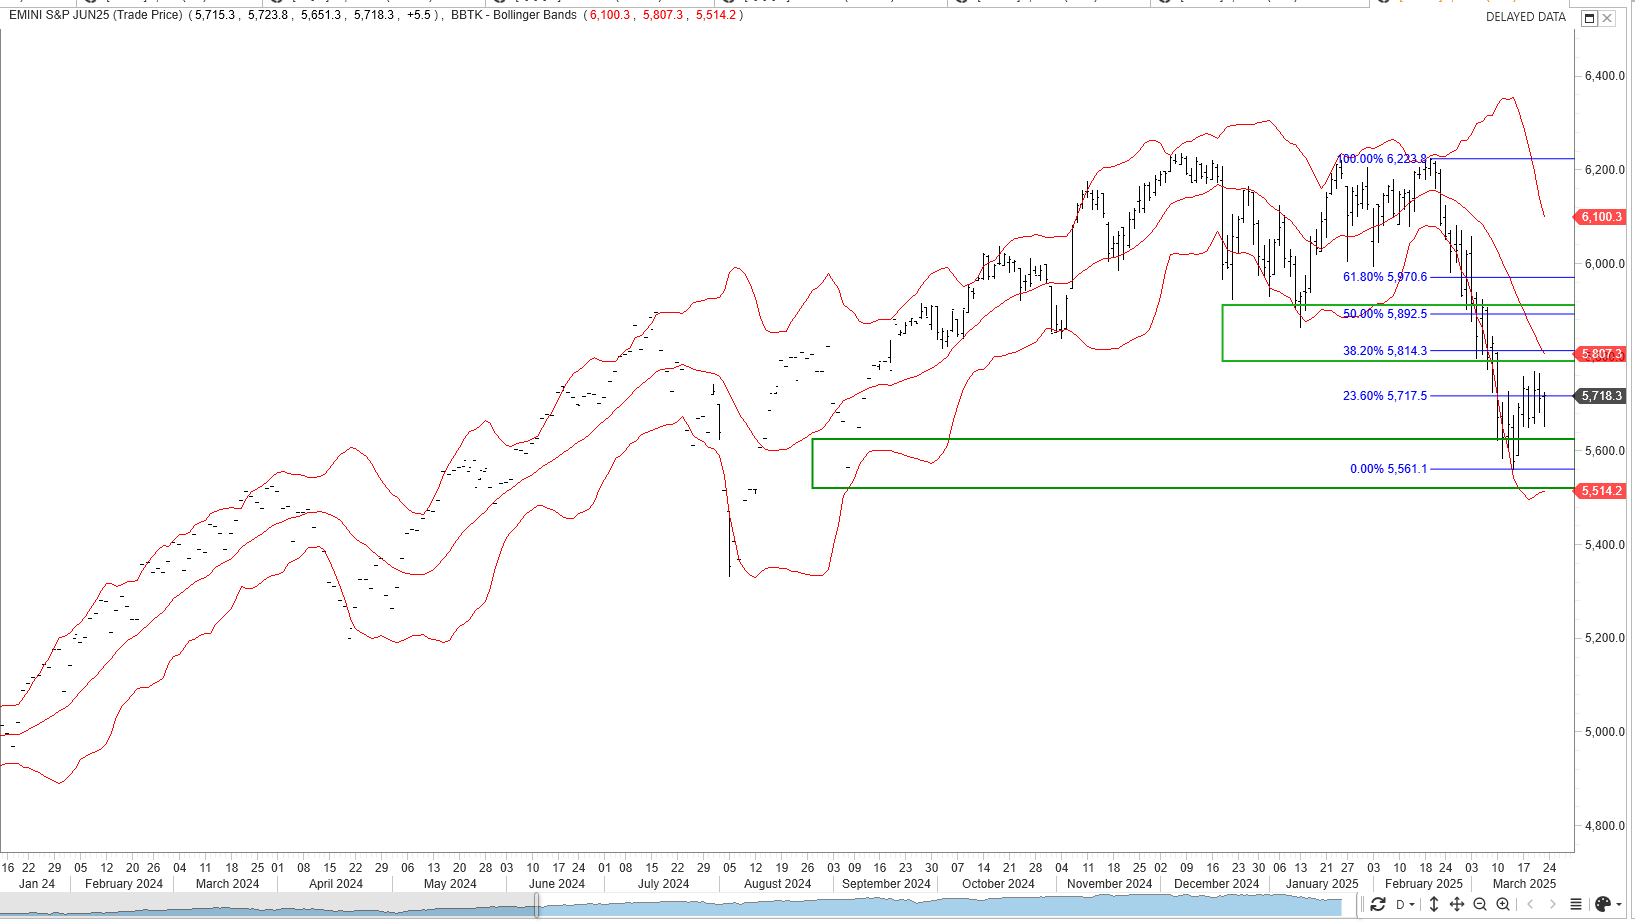
S&P futures with Fibonacci Retracements
This chart points out the area where the S&P futures stopped falling. The area of demand which will was tested recently is in the 5560 price range. Notice the near perfect stop at September 2024 low.
I have placed Fibonacci retracements from the high 6223 to the 5561 area. Last week price topped out at the 23.6% Fibonacci level. This is approximately 5717.
Additionally, I have highlighted a potential price zone target too. This area coincides with a 20 period simple moving average (5814), the 38.2 Fibonacci through the 50% Fibonacci level (5892). Therefore a potential price zone to target is between 5814 - 5892 as an area where sellers may engage.
In my analysis below, I will review other factors which can provide additional clues as to whether this is a near term bottom and price will move higher.
The Volume Profile View
The chart below shows the S&P futures (contract ES) 10 day daily volume profile chart. The data aggregation is done in 30 minute periods.
Short-Term Bias
The market is in a 10 day balance defined by the rectangle of 5560 - 5770.

The five day balance area is defined by the range 5681 - 5755.
Value Area High: 5755
Point of Control: 5707
Value Area Low: 5681

The Volume Profile View ( 20 days )
The chart below shows the S&P 500 futures volume profile for the last 20 days aggregated by 30 minute periods. I am showing the candlesticks on the left with the profile histogram on the right. The area boxed in on the right is the value area for the 20 days. As you may recall the value area contains 70 percent of the trading volume for the period.

Note that the 20 day value area low is above the current price. Again showing an oversold market with a potential upside target.
The key levels are:
Value Area High: 6035
Point of Control: 5963
Value Area Low: 5675
Bullish Scenario
Continuation of the Bounce
Next Upside Targets (~5700, ~5750)
5700: Minor resistance; if the market can close decisively above 5700, it may open the door to a run at the next volume node.
5750: This looks more significant—both from the volume profile (a higher-volume region above) and from any gamma/resistance levels you’ve identified. A break above 5750 would further confirm bullish momentum.
Potential Breakout Toward 5800+
If price pushes past 5750 and holds, watch the next major volume node or resistance line (perhaps near 5800–5830).
Bearish Scenario
Failure at or Below 5700/5750
If the index can’t sustain moves above 5700—or quickly reverses near 5750—sellers might regain control.
A rejection at these levels often prompts a retest of the volume shelf near 5650.
Loss of Key Support (~5650)
This region appears to be a POC/high-volume node. A decisive break below 5650 would indicate sellers are overpowering buyers in the most recent value area.
Once below that shelf, price may accelerate to the downside, especially if there’s a low-volume gap in the profile.
Read about market profile and auction market theory here.
S&P 500 futures hourly chart
This chart shows 90 days of trading. The chart shows heikin candles using a 50 period simple moving average. Since mid February ( 17 - 19 ). Price would fail around this moving average. Since Thursday March 20, price closed above the moving average. Additionally observe that the slope of the moving average is becoming positive. This implies that the down move may have completed in the short term.
I will observe how price interacts with the moving average, noting whether it fails below it (5725). Staying above implies that the bullish scenario has a higher probability of success.

CTA Positioning
The chart shows the CTA positioning (Commodity Trading Advisor). CTA positioning shows a short term bottom in the S&P 500. This adds to the bullish case, if the market begins to move higher.

Management of last week’s plan
Last week I was looking for a mean-reversion trade in the market. Short calls via a broken wing butterfly above resistance were closed for a win.
Last week’s plan is here.
The MenthorQ SKEW index
The MenthorQ skew index chart of S&P 500 cash index. The model shows 25 day risk reversal skew.

Observations:
The chart shows SPX trying to stabilize after a decline, and the 1‐Month Skew remains negative (puts more expensive than calls), but not at an extreme.
The ~19% 3-Month Percentile reading suggests current skew is in the lower (less fearful) range of its recent history.
The Nation's Index
From 3/21/2025
Observations
Call Side Spike: The chart’s biggest change is on the right side (OTM calls), suggesting a notable one-day jump in call premiums.
Possible Sentiment Shift: A rapid rise in call prices can indicate traders are bracing for upside or unwinding shorts.
Put Side Spike: Deep out of the money put buying showing left tail risk.

Long Term rates (10 year Treasury)
After the FOMC cut rates (December 2024 .25 basis point cut) there has been a steady increase in long term rates. Rates peaked in the first week of January 2025. Since this time they have declined. The yield is currently at 4.28.
Last week the FOMC met and left rates unchanged. The fed-fund watch tool shows that there is a 85% probability that short term rates will get lowered by 25 basis points at the next meeting in May.
Short-Term Bearish Bias: The chart remains under the middle Bollinger Band, reflecting a prevailing downtrend.
Potential Bullish Reversal: A sustained close above the 20-day MA (center band) would be the first sign of buyers regaining momentum.
Volatility Contraction: Bollinger Band narrowing suggests a bigger directional move could be on the horizon. Watch closely for a decisive breakout above the upper band or a renewed sell-off below the lower band.
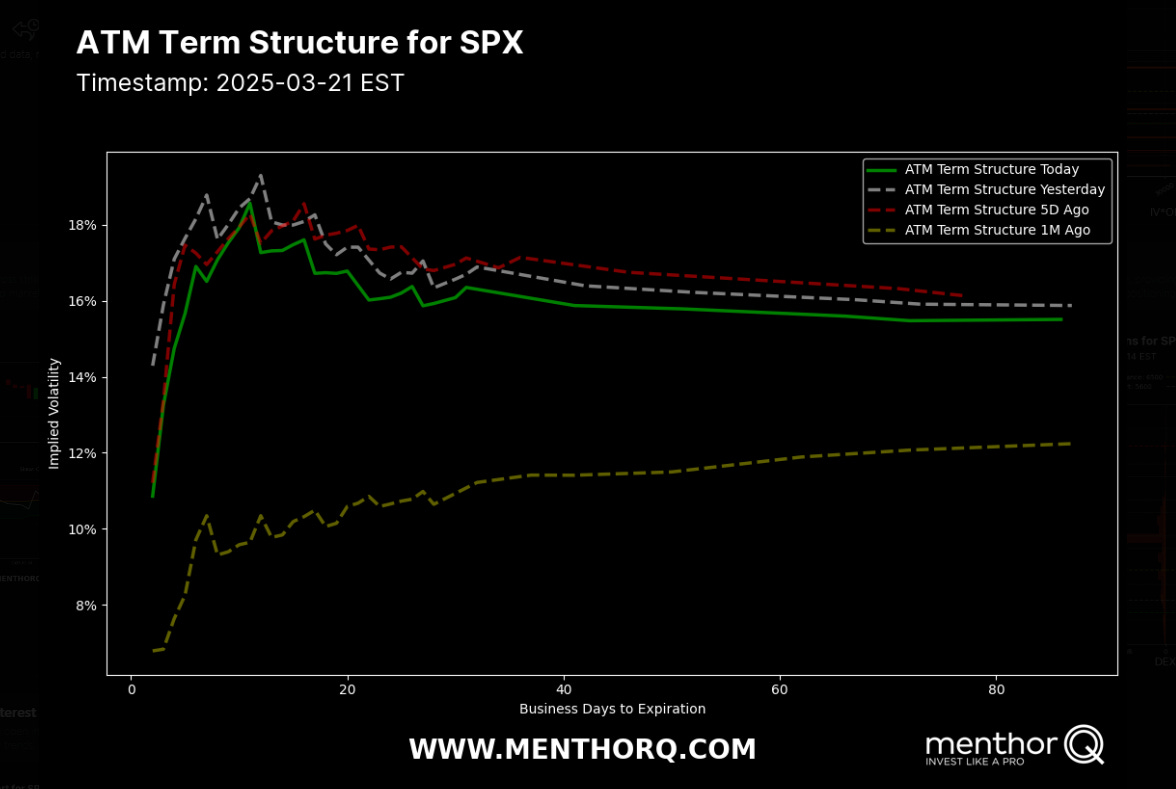
S&P 500 Term Structure
The chart below shows the S&P 500 term structure. The green line shows today’s term structure. The term structure is lower compared to the previous day.
The short-term IV spike over the next few days suggests upcoming risk this week.
I list the major events below.
Smile Curve

Higher IV on the Far Left (Low Strikes)
This is the typical put skew: out-of-the-money (OTM) puts command higher implied volatility due to hedging demand and fear of downside moves.
The left side is significantly higher than the center, reflecting strong demand for protective puts.
Slight Uptick on the Far Right (High Strikes)
The far right (OTM calls) may tick upward but usually less dramatically than the left side.
If there is a noticeable “right tail,” it can signal some demand for upside calls (e.g., if traders are hedging or speculating on a sharp rally), but SPX typically has a pronounced put skew compared to the call side.
S&P 500 Cash Gamma levels
Market participants are mostly positioned bearish. Price is still well below the high volume level (5830). This chart also confirms the outlook in the smile curve as we can observe increased gamma for OTM calls (right tail risk). The market is currently in a negative gamma environment.
With the price well below the high volume level, we expect market makers to trade in the direction of price. Expect large price swings this week.

The market maker implied move for the S&P futures this week is +/- 100 points. Therefore the market maker expected range is between 5768 to 5568.
US Market Moving Events for the current week
I have listed the events in the order of significance (highest to lowest).
For the week of March 24 to March 28, 2025, several key economic events and notable earnings reports are scheduled in the United States.
Chicago Fed National Activity Index
Often released around the third or fourth Monday of each month.
Gauges overall economic activity and related inflationary pressure.
New Home Sales (February data)
Typically published by the U.S. Census Bureau around the 25th–26th of each month.
A key indicator for the housing market’s health.
Durable Goods Orders (February data)
Usually released by the U.S. Census Bureau around the 24th–27th of the month.
Provides insight into manufacturing demand and business investment.
Conference Board Consumer Confidence (March reading)
Often released on the last Tuesday of the month (around March 25 in 2025).
Measures consumers’ optimism about the economy.
Weekly Jobless Claims
Published every Thursday by the Department of Labor.
A high-frequency measure of labor market conditions.
Third (Final) Estimate of Q4 2024 GDP
The “final” estimate for the previous quarter’s GDP is typically released near the end of March (often the last Thursday).
In 2025, that could fall on March 27 (assuming no schedule changes).
Personal Income and Outlays (February data)
Commonly released on the last Friday of the month (potentially March 28, 2025).
Includes the PCE Price Index (the Fed’s preferred inflation gauge), which can move markets if there’s a surprise.
These events collectively offer a comprehensive view of the current economic landscape, encompassing monetary policy, corporate performance, housing dynamics, and consumer behavior. Investors and analysts will closely monitor these developments to inform their strategies and forecasts.
QQQ Weekly Chart
Looking at the QQQs or the Nasdaq100 futures are an important part of my trading plan. The XLK (technology ETF) represents a 33% component of the S&P500. Therefore I use this as an indicator to trade the S&P 500.
QQQs closed at a key area 481. A potential target for this week is 490 the 20 day simple moving average.

QQQ Gamma levels
The chart below shows the positioning information for QQQ. Current GEX profile is showing a slight negative gamma environment. Currently price is 480. The key inflection point is 481. Expect large price moves.

The Weekly Plan and trading idea
I am currently sitting in cash as all SPX trades were closed by the end of last week. I will look to be a net selling of calls via a broken wing butterfly structure. A potential target area is near 5800 - 5850.
Key Levels for the week
5750
Mentioned frequently in your prior analyses (including the broken wing butterfly setup).
Gamma “Pin” Potential: If the market grinds up toward 5750, it could either stall or temporarily “pin” around that strike—especially if large open interest resides there.
5800–5830 (HVL / Gamma Reference)
Your Net GEX data referenced 5830 as an HVL (High Volume Level) or a key gamma zone.
If SPX pushes through 5750, the next challenge is whether it can break above this HVL area. This zone often acts as a magnet or short-term pivot.
Minor Resistances Between 5850–6000
Based on volume profile or open interest is distributed, you could see minor friction points within this range.
I will keep an eye on psychological round numbers (e.g., 5900, 6000), where traders often cluster stops and options positions.
Immediate Downside Support:
5600 (Major put interest, negative gamma support)
5650–5660 (Volume shelf / POC region)
Although the market is experiencing higher volatility with large swings in both directions; I believe from a risk to reward viewpoint that there is a greater probability of the market moving higher over the next few weeks.
Have a successful trading week, by waiting for your trade setups to come to you. Always manage your risk and understand what you expect to lose prior to trade entry. By managing risk, you unlock profitability.
Gamma Level data (netgex data) and skew data (market sentiment) was provided by menthorQ.com
How I trade
I did a number of presentations of my trading process with menthorQ. You can find them here. This is under the highlights section of my “x” account found here.
Follow me on X formerly twitter . I post my market view during the week.
Disclaimer
Please don’t follow my idea(s) blindly. Do your own due dilligence before you attempt to trade. Again, always manage your risk.
Thank you for reading my weekly plan.
Joel
