Weekly Plan for March 9
Another volatile week for the S&P 500. The index was lower 3% for the week. Will we get a bounce this week? I discuss my weekly plan below.

Summary
The S&P saw the largest down week since the last bear market. There were non-stop tariff headlines and other geo-political news. This past week was the most volatile week since April 2024. Each day last week saw 100+ point swings. Correlation for the S&P 500 sectors approached 100 percent meaning that everything moved in the same direction. All was sold during the week.
This is the 5 day performance of the sectors which make up the S&P 500. In the past, 100 percent correlation have corresponded to a short term low, however there is no guarantee that is the case.

In my analysis below, I will review other factors which can provide clues as to whether this is a near term bottom. Let’s review.
The Volume Profile View
The chart below shows the S&P futures (contract ES) 10 day daily volume profile chart. The data aggregation is done in 30 minute periods.
There are number of nuances that I will point out below:
Short-Term Bias
With lower POCs and value areas, the short-term bias remains bearish until proven otherwise.
Intraday & Swing Opportunities
Retests of prior daily POCs often provide trade setups. In a downtrend, price may rally intraday toward an old POC or VAH, then stall and rotate back down.
Potential Support/Resistance
Each day’s VAL (value area low) can act as short-term support during that session; once broken, it can become resistance in a continuing downtrend.
Old daily POCs above current price can act as overhead resistance on bounces.

Bullish Scenario
5781–5782 Area
Looks like a prior day’s VAH or POC region.
If price can reclaim and hold above 5781, it signals buyers gaining traction.
5792–5795 Zone
Another potential overhead resistance from a previous session’s high-volume node or VAH.
A sustained break above 5792–5795 can attract momentum buyers.
5805+
This higher region (5805 or slightly above) might align with a multi-day POC or a swing high.
If the market closes above 5805, it suggests a more pronounced bullish reversal.
Bearish Scenario
5766–5758 Zone
There are a cluster of POC/Value Area references from recent sessions.
If price breaks below this band and fails to re-enter, it could open the door to deeper downside.
5753–5745 Zone
Another area with visible TPO/volume congestion on the profiles.
A break below 5758 may lead to a test of 5753 first, then 5745 if sellers maintain control.
5707–5710 Region
Farther down, there’s a thin or low-volume area near 5707 (visible on the far left profiles).
If the market accelerates lower, this could be a “fast-move” zone where price drops quickly to test prior swing lows or a composite VAL around 5707–5710.
The Volume Profile View ( 20 days )
The chart below shows the S&P 500 futures volume profile for the last 20 days aggregated by 30 minute periods. I am showing the candlesticks on the left with the profile histogram on the right. The area boxed in on the right is the value area for the 20 days. As you may recall the value area contains 70 percent of the trading volume for the period.

I have listed the value area over the last few weeks. Note, that the value area low migrated lower, however the point of control remained at the same level as the previous week.

The key levels are:
Value Area High: 6151
Point of Control: 6133
Value Area Low: 5954
Bullish Path Summary
Hold Above 5710–5745 → Reclaim 5790–5800 → Break 5840–5850 (Composite POC) → Next resistance near 5890–5905 → Potential extension higher if momentum continues.
Bearish Summary
Fall Below 5745 → Retest/Breach 5710 swing low → Possible quick drop through LVNs to ~5675–5680 → If momentum persists, next support around 5650–5660 or lower.
Read about market profile and auction market theory here.
S&P 500 futures hourly chart
This chart shows 90 days of trading. The chart shows heikin candles using a 50 period simple moving average. Since mid February ( 17 - 19 ). Price would fail around this moving average. In order to have a more bullish bias, I would need to see price move above this moving average for more than an hour or two. Notice also that the slope of moving average is negative.

Bullish Path Summary
Step 1: Price forms a stable low near 5700 and prints multiple green Heikin-Ashi bars.
Step 2: Reclaims 50 SMA; watch the slope flatten/turn upward.
Step 3: Breaks prior lower high (e.g., near 6000+ ).
Step 4: Sustains higher levels, indicating a potential new uptrend.
Bearish Path Summary
Step 1: Price can’t hold any bounce above the 50 SMA; fails near overhead resistance.
Step 2: Red Heikin-Ashi bars dominate, confirming sellers’ strength.
Step 3: Break below 5700 support; potential for increased selling pressure as stops get triggered.
Management of last week’s plan
Last week I was looking for a mean-reversion trade in the market. Short puts were closed for a small loss.
I did sell call spreads above prior support areas. This worked out and short calls were monetized.
Last week’s plan is here.
The MenthorQ SKEW index
The MenthorQ skew index chart of S&P 500 cash index. The model shows 25 day risk reversal skew.

Observations:
Current 1-Month Skew: Leaning toward a call bias (relatively more expensive calls than puts).
Interpretation: This can signal that short-term downside fear has abated and/or there is fresh demand for upside exposure.
Caution: Skew alone is not a directional guarantee. Cross-reference spot price trends, macro events, and overall volatility levels to confirm whether the market truly expects a bullish move or if this is a short-lived skew imbalance.
The Nation's Index
From 3/9/2025
Observations
Shifting Skew Dynamics
Typically, the S&P 500 exhibits put skew—downside puts are more expensive due to hedging demand.
Seeing puts lose value (red) while far OTM calls jump (large green/black bar on the right) can signal a flattening or reduction in put skew, and a relative increase in call skew.
Reduced Downside Fear
If traders are unwinding put hedges or if implied volatility on puts is falling, the market may be pricing in less tail-risk to the downside.
Alternatively, it might reflect a short-term bounce or a view that recent sell-offs have already priced in negative catalysts.
Increased Demand for Upside
A notable surge in OTM call prices often points to speculative upside buying or a repositioning for a rebound.
This can happen if traders expect a short squeeze or a near-term rally—sometimes triggered by macro news, technical oversold conditions, or event-driven catalysts.

Long Term rates (10 year Treasury)
After the FOMC cut rates (December 2024 .25 basis point cut) there has been a steady increase in long term rates. Rates peaked in the first week of January 2025. Since this time they have declined. The yield is currently at 4.26
The bond market is forward-looking, and higher long-term yields can reflect worries about inflation remaining persistent, high government debt levels, or a shift toward stronger economic growth despite lower short-term interest rates.
A rise in long-term rates increases the discount rate used to value future earnings of companies. The higher the discount rate, the lower the present value of future cash flows, which generally depresses stock prices.
This is particularly impactful for growth stocks, where a significant portion of their value is derived from future earnings. Technology stocks ( the nasdaq 100 or 30 percent of the S&P 500), for example, may be more sensitive to rising rates.
Rising long-term rates may make bonds more attractive relative to equities, as the yield on government debt increases. As bond yields rise, investors may shift funds from the equity market (S&P 500) into bonds, causing selling pressure on stocks.
Trade Implications Based on Yields
If yields drop further, watch for rate-sensitive assets like tech & gold to rally.
If economic data surprises strong, yields could bounce back above 4.28%.
S&P 500 Term Structure
The chart below shows the S&P 500 term structure. The green line shows today’s term structure. The term structure is lower compared to the previous day.
The short-term IV spike suggests upcoming risk this week, so hedging might be appropriate.
I list the major events below.
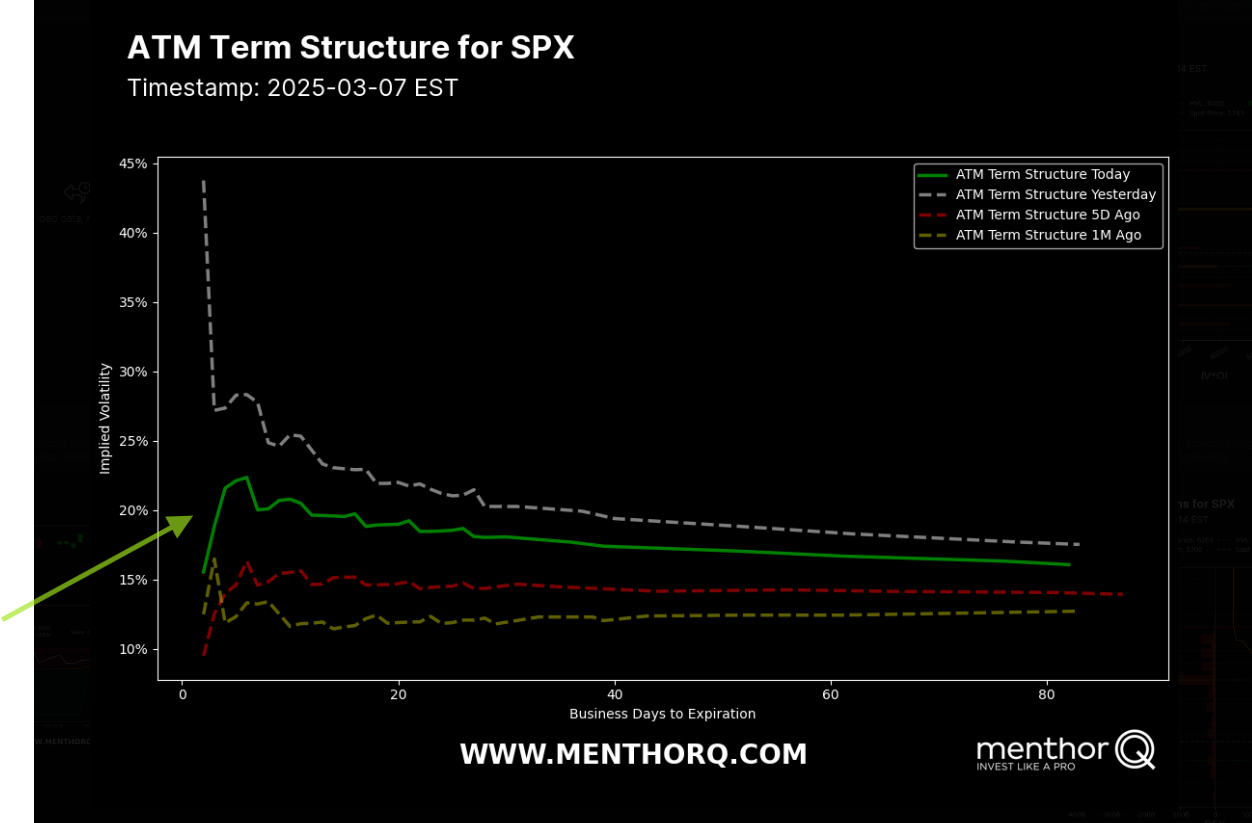
Smile Curve

Put Skew vs. Call Skew Changes
In SPX, typically the left tail (puts) is significantly higher than the right tail (calls). If you see the left tail come down or the right tail move up, it can signal a shift toward a flatter skew—often implying less downside fear or increased upside hedging.
Shift from Yesterday to Today
Look at how the green line (today) compares to the red line (yesterday).
A uniform shift up or down across all strikes suggests a broader change in implied volatility levels (often driven by macro events, volatility spikes, or risk-off/risk-on moves).
A selective shift that’s larger in the puts or calls region suggests changes in skew rather than overall IV.
Medium-Term Trends (5 Days Ago vs. Today)
If the difference between the lines from 5 days ago and today is significant, it might indicate a developing trend—e.g., rising put protection or increasing call speculation.
If they’re relatively close, the market might be stable in terms of implied volatility, with no major skew changes over that time.
S&P 500 Cash Gamma levels
Market participants are mostly positioned bearish. There has been no change in the current outlook from the previous week. The market continues to be put dominated.
The Net Gex chart is showing that 6000 (high volume level area, arrow below) is a key level in the S&P 500 cash chart this week. Expect large price swings this week.
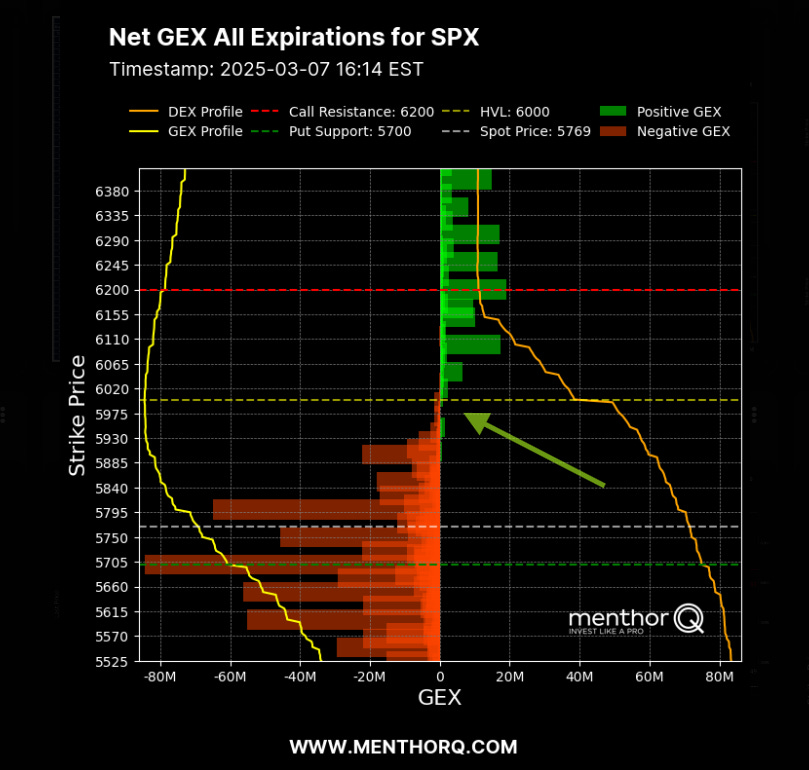
The market maker implied move for the S&P futures this week is +/- 155 points. Therefore the market maker expected range is between 5620 to 5920.
US Market Moving Events for the current week
I have listed the events in the order of significance (highest to lowest).
For the week of March 10 to March 14, 2025, several key economic events and notable earnings reports are scheduled in the United States.
1. Central Bank Policy Decisions & Communications
Interest Rate Decisions (Federal Reserve, European Central Bank, Bank of England, etc.)
Rate hikes or cuts, along with forward guidance, can dramatically shift currency, bond, and equity markets.
Markets closely watch the tone of policy statements and press conferences for clues about future moves.
Central Bank Minutes / Meeting Transcripts
Offer detailed insight into policymakers’ discussions and potential biases.
Can confirm or challenge market expectations formed after the official rate decision.
Key Speeches by Central Bank Officials
Remarks by the Fed Chair, ECB President, or other influential policymakers can significantly move markets if they hint at shifts in monetary policy.
2. Labor Market Reports
U.S. Nonfarm Payrolls (NFP)
Released monthly, it’s a top-tier indicator of economic health in the world’s largest economy.
Strong or weak job growth can affect interest rate expectations and overall risk sentiment.
Unemployment Rate / Jobless Claims
Offer additional insight into labor market conditions.
Can reinforce or contradict the message from NFP data.
3. Inflation Data
Consumer Price Index (CPI)
Measures inflation at the consumer level. High inflation can prompt central banks to tighten monetary policy, while low inflation can lead to easing.
Core CPI (excluding food and energy) is often watched more closely for underlying inflation trends.
Producer Price Index (PPI)
Measures wholesale inflation, which can foreshadow future consumer inflation trends.
4. Gross Domestic Product (GDP)
Quarterly GDP Growth
The broadest measure of economic activity.
Revisions to previous GDP readings can also cause market volatility if they significantly deviate from expectations.
Other Growth Indicators (e.g., GDI, GVA)
Gross Domestic Income (GDI) or Gross Value Added (GVA) can complement or contradict GDP signals, but they typically have less market impact.
5. Business & Manufacturing Activity
Purchasing Managers’ Index (PMI) / ISM Surveys
Provide timely insight into manufacturing and service sector conditions.
Strong PMI/ISM data often signals economic expansion, while weak data can signal contraction.
Industrial Production / Factory Orders
Indicate the pace of industrial sector activity.
Large deviations can influence equity and commodity prices.
6. Consumer-Related Data
Retail Sales
A direct measure of consumer spending, which is crucial for GDP in consumer-driven economies.
Surprises can shift sentiment about overall economic momentum.
Consumer Confidence / Sentiment Indexes
Gauge households’ outlook on the economy.
Can be an early signal of shifts in spending behavior.
7. Trade Data & Other Indicators
Trade Balance
Important for economies heavily influenced by exports or imports.
Large imbalances or unexpected changes can affect currency valuations.
Durable Goods Orders
Reflect business and consumer spending on big-ticket items.
Volatile month-to-month, but can be an indicator of manufacturing health.
Housing Data (Housing Starts, Building Permits, Existing Home Sales)
Particularly influential in economies where real estate is a major driver of wealth and investment sentiment.
These events collectively offer a comprehensive view of the current economic landscape, encompassing monetary policy, corporate performance, housing dynamics, and consumer behavior. Investors and analysts will closely monitor these developments to inform their strategies and forecasts.
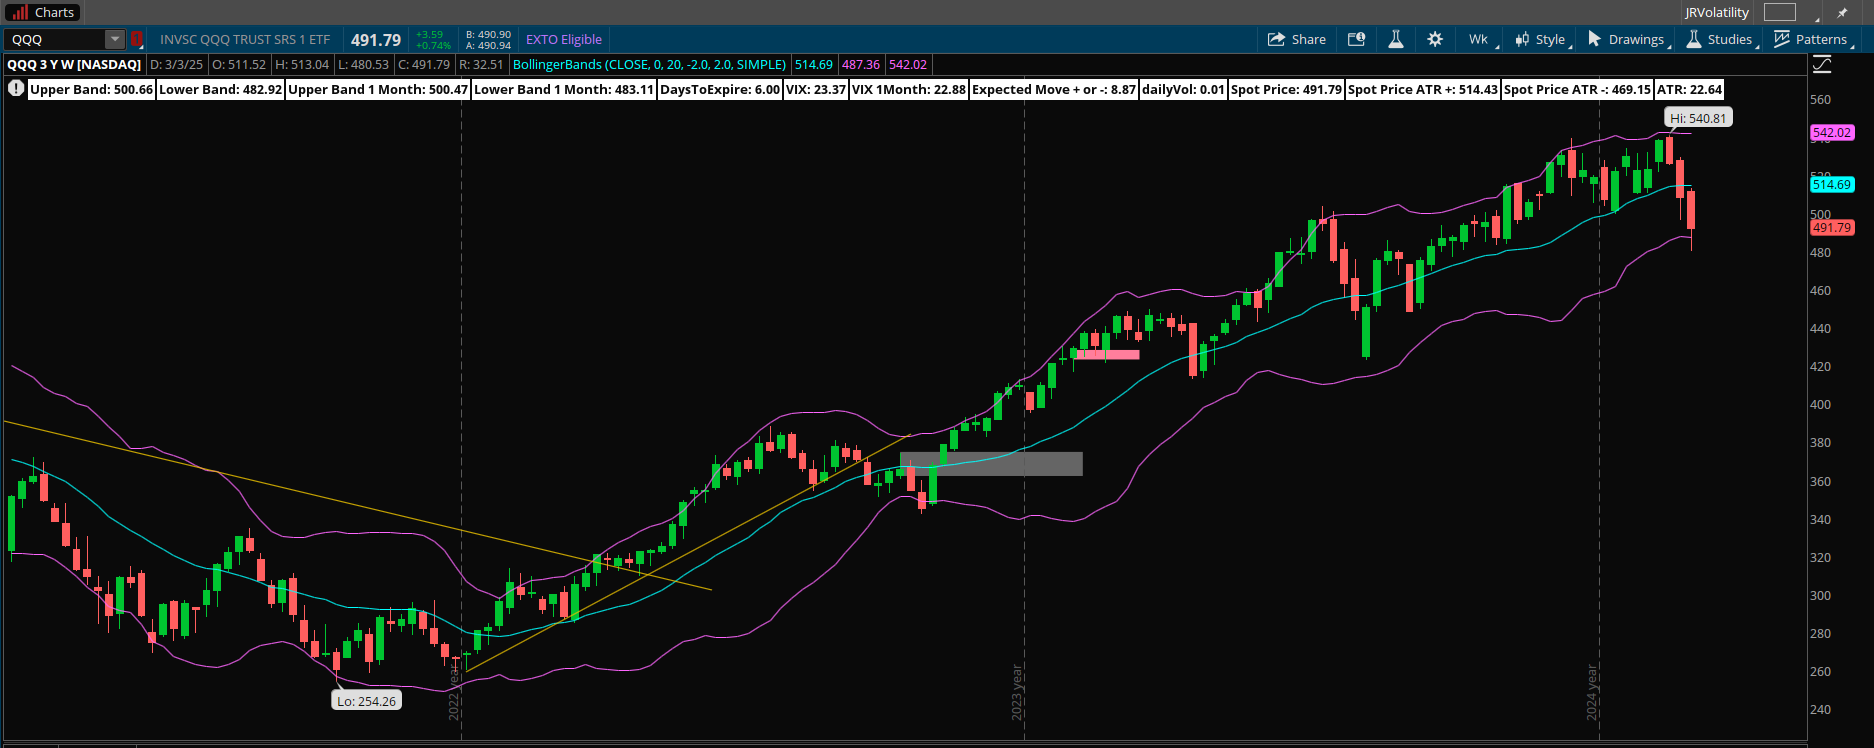
QQQ Weekly Chart
Looking at the QQQs or the Nasdaq100 futures are an important part of my trading plan. The XLK (technology ETF) represents a 33% component of the S&P500. Therefore I use this as an indicator to trade the S&P 500. The QQQ moved lower by 4% last week. This acted as a drag on the S&P 500.
As noted above, all the the sectors were down for the week.
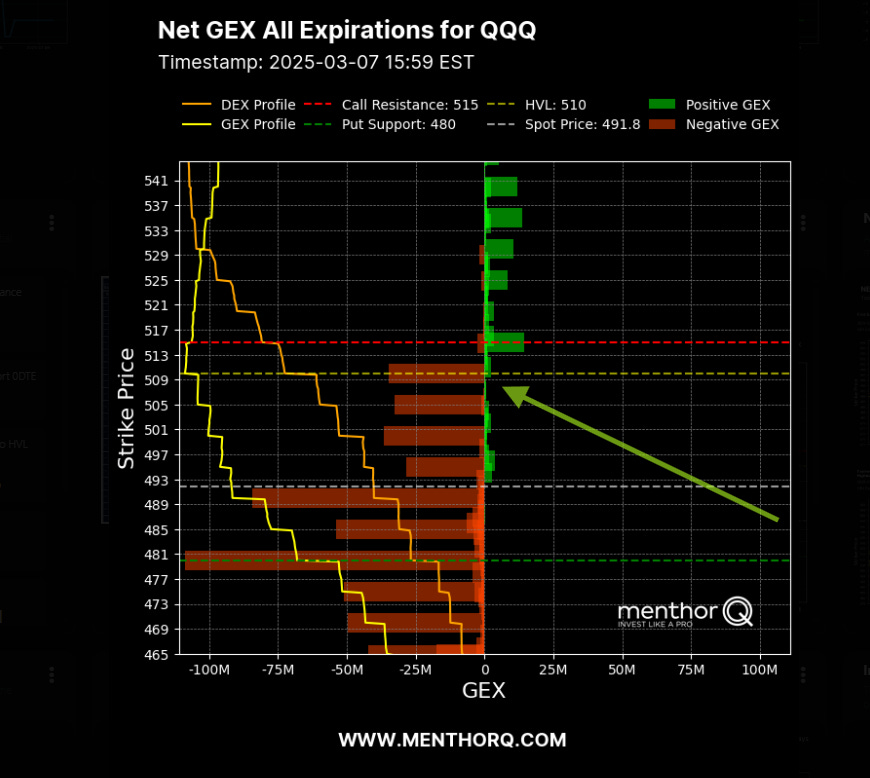
QQQ Gamma levels
The chart below shows the positioning information for QQQ. Current GEX profile is showing a negative gamma environment. Currently price is 492. The key inflection point is 510. Expect large price moves.
The Weekly Plan and trading idea
I am currently holding short call spreads for the end of the week 3/14. Those spreads are near the 5950 level in the SPX.
Key Levels for the week
1. Major Support Zones
5710–5745 Region
Recent Swing Low (≈5710): A critical pivot where buyers have previously stepped in.
5745: A nearby inflection point; losing this area increases downside pressure.
5675–5680
If 5710 fails decisively, watch this thin/low-volume pocket. Price can move quickly through it if selling intensifies.
5650–5660
A deeper support cluster from prior profiles/swing lows. A break below suggests a more pronounced downtrend.
2. Major Resistance Zones
5790–5800
A key overhead barrier. Reclaiming and holding above 5800 indicates buyers are regaining control short-term.
5840–5850
Often cited as a composite POC / high-volume node in recent profiles. Clearing this region would be a stronger bullish signal.
5890–5905
Another likely supply area or upper target if momentum accelerates. A close above 5905 could trigger further upside follow-through.
Bullish Path
Hold Above 5710–5745
Buyers defend the swing low and push price above 5745.Break & Consolidate Above 5800
Confirms short-term strength.Challenge 5840–5850
Success here can spark a run toward the 5890–5905 zone.
Bearish Path
Fail at or Below 5745
A breakdown from current levels signals sellers remain in control.Lose 5710 Swing Low
Opens the door to a quick move into 5675–5680.Extend Toward 5650–5660
Breaking this deeper support could trigger a more pronounced sell-off.
From a number of technical indicators, S&P 500 is showing oversold levels. It is important for price to break above key levels to go from a bearish to bullish environment.
Have a successful trading week, by waiting for your trade setups to come to you. Always manage your risk and understand what you expect to lose prior to trade entry. By managing risk, you unlock profitability.
Gamma Level data (netgex data) and skew data (market sentiment) was provided by menthorQ.com
How I trade
I did a presentation of my trading process with menthorQ on how I trade the S&P 500. You can watch it here.
Disclaimer
Please don’t follow my idea(s) blindly. Do your own due dilligence before you attempt to trade. Again, always manage your risk.
Thank you for reading my weekly plan.
Joel