Weekly Plan for October 27
S&P 500 had it's first down week in the last seven weeks. Is there more downside expected for this week? I discuss my weekly plan for trading the market with an actionable idea.

Summary
The S&P 500 dropped last week by 1%. In last week’s post I felt that there were high odds that a decline would occur. You can read it here.
For this week, I see potential S&P prices continue its move downward. On Friday the S&P 500 showed bearish price action. Price gapped up, moved up further, and ended the day for a decline. I have highlighted the price action of the S&P futures on Friday.
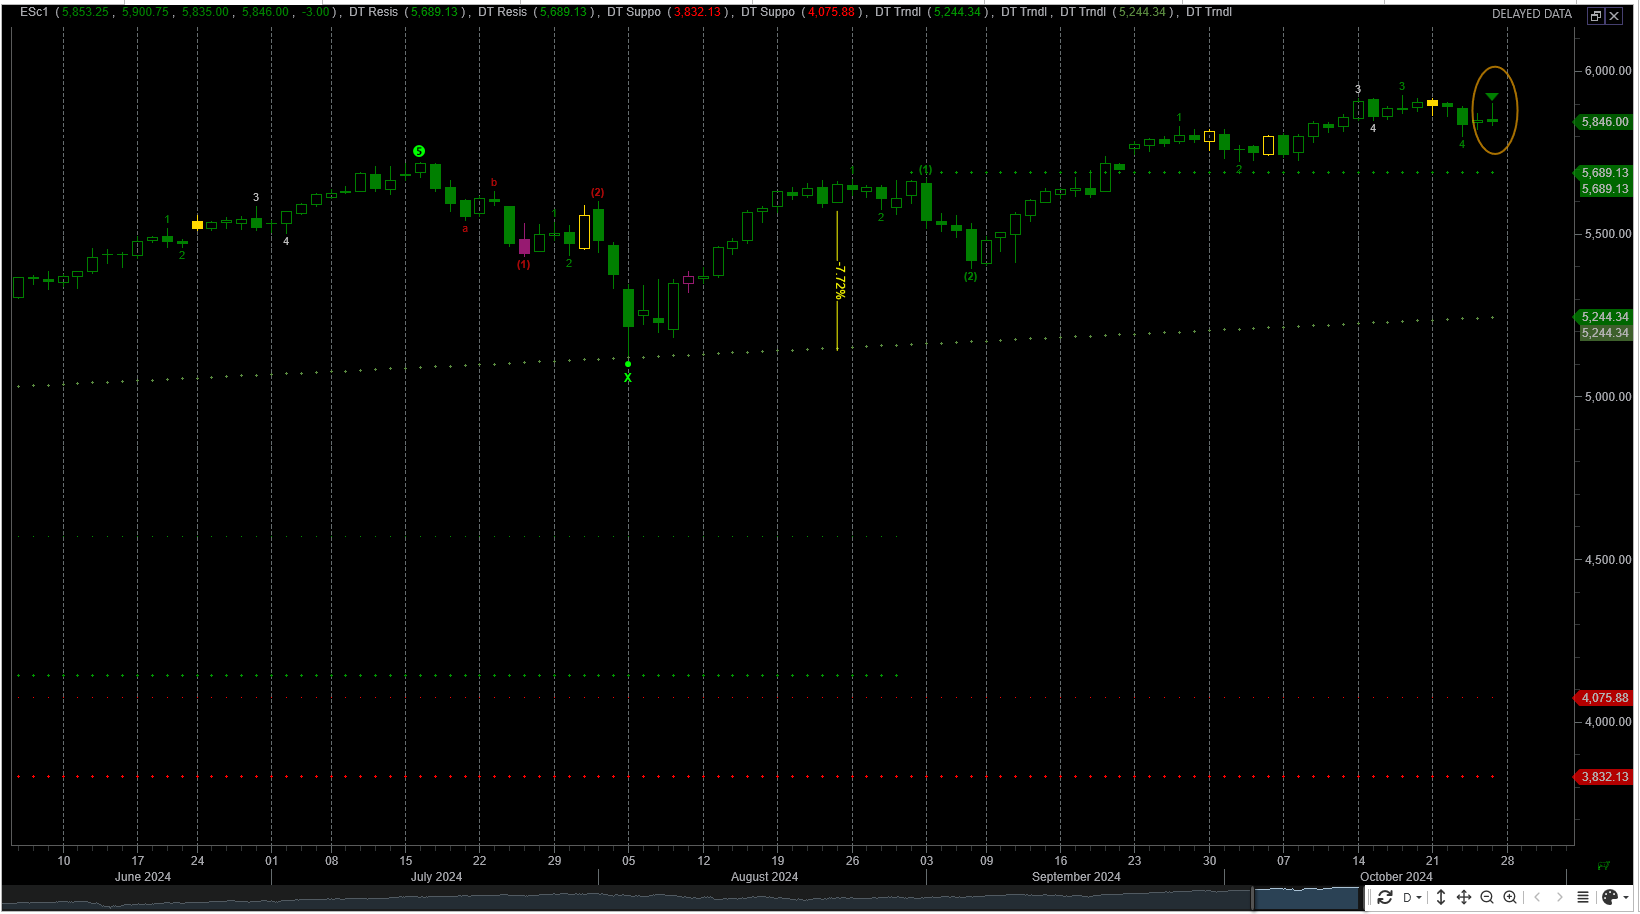
The chart below shows the S&P futures volume profile over the last ten days. Volume profile shows price volume by time.
The highlighted pink line is the point of control and represents where the largest volume was traded over the day. I have divided the chart into the two previous weeks. Each week is squared off. Two weeks ago I observe that the point of control was in a small range over the week. For last week I observed that the point of control moved to a lower range.
I believe it is likely that the market falls lower.

For this week, 5825 is a key inflection level for the S&P 500 cash index. Below 5825, it will make lower prices as market participants are net long PUTS. Above 5825, market participants are net long CALLS on the index. Currently price lies between the 8 day simple moving average and 20 day simple moving average.
If the index falls below 5825, then key profit targets are 5790 and 5680. The 5790 level represents 20 day simple moving average and 5680 level represents the 50 day simple moving average. These levels are anotated on the chart below.
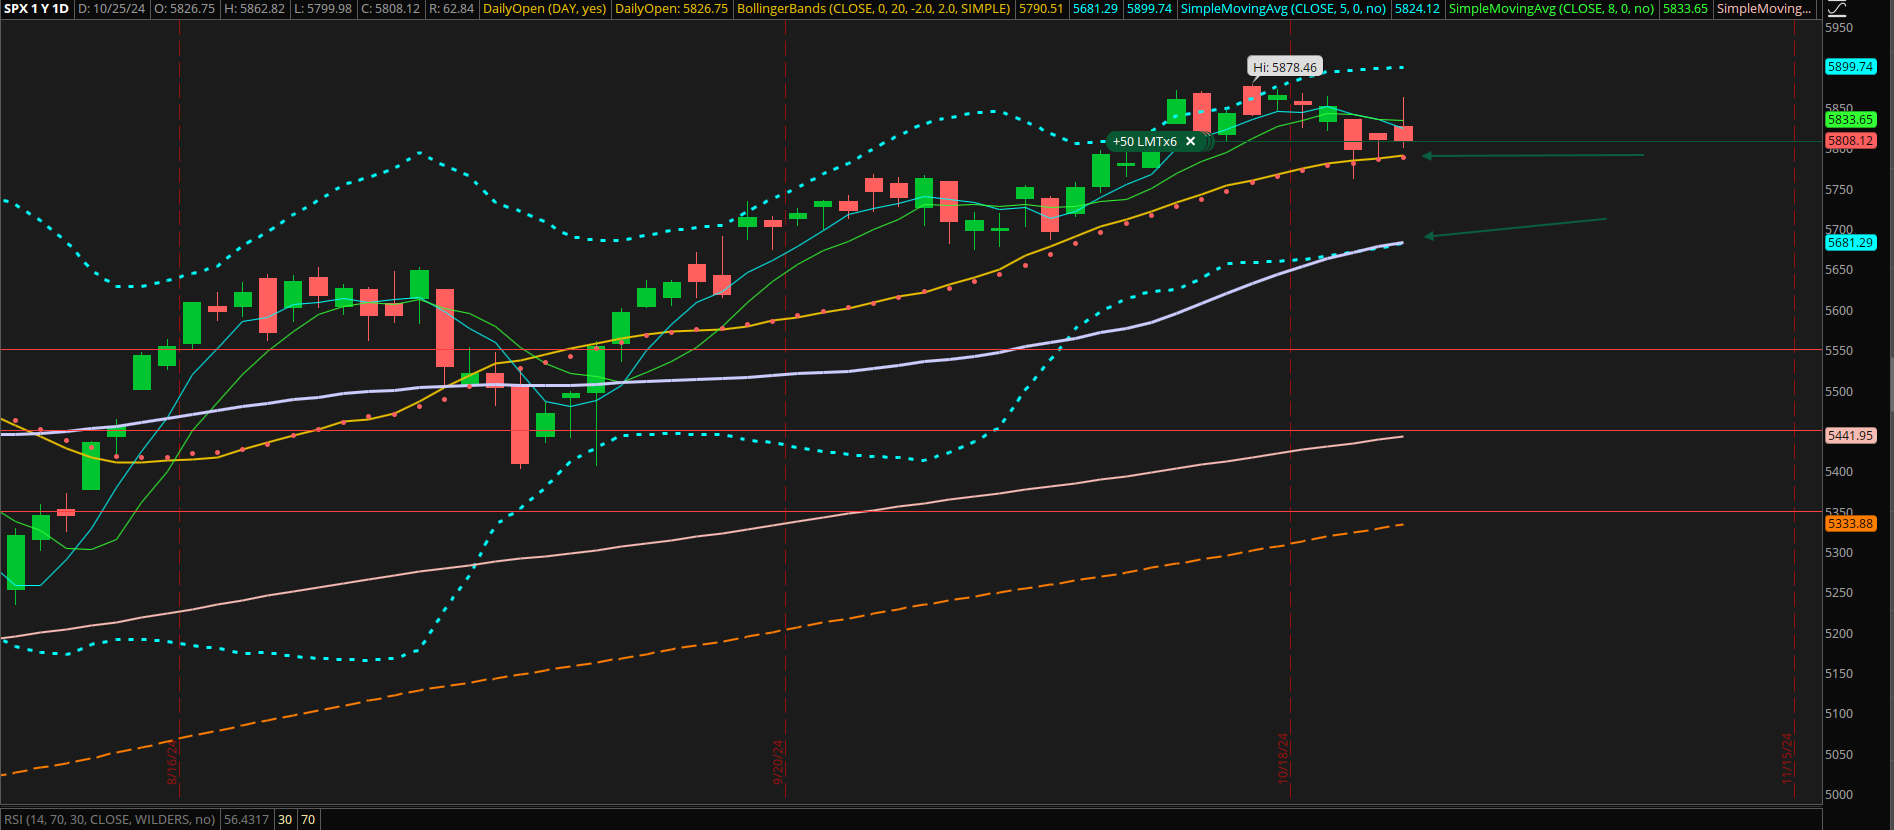
Ultimately, if these levels are hit, I would view them as good levels to buy the market.
The U.S. market has a number of catalysts this week, therefore there is a lot of opportunity for volatility.
Market sentiment is fairly bullish, however it did move lower from extreme greed to greed based on the CNN Fear & Greed Index in the last week.
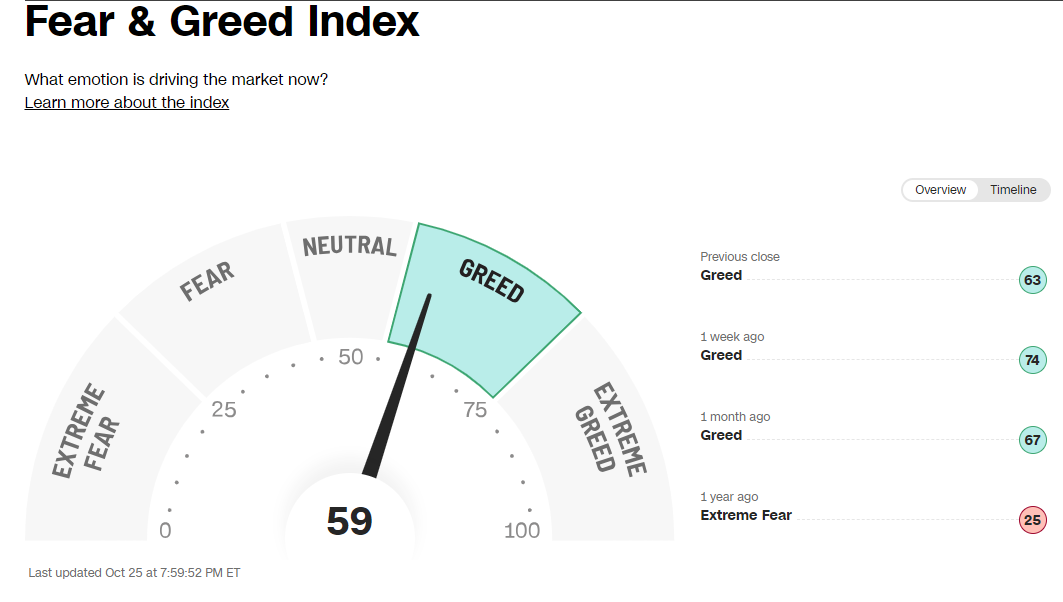
I am not calling for the end of the bull market, however a pause or a 4% to 5% decline is highly plausable.
US Market Moving Events
For the week of October 27, 2024, several significant events could impact the U.S. stock market:
Federal Reserve Speeches: Any comments from Federal Reserve officials could influence market sentiment, especially regarding future interest rate decisions.
Economic Data Releases: Key reports such as the Consumer Confidence Index, GDP Growth Rate, and Employment Data could provide insights into the health of the US economy.
Geopolitical Events: Developments in international relations, such as trade negotiations or conflicts, could have ripple effects on the markets.
Upcoming Elections: With the US elections approaching, any new developments or polls could impact market volatility.
Corporate Earnings Reports: Several major companies are scheduled to report their quarterly earnings, which could affect stock prices and investor sentiment.
Here are some of the major earnings events for the week of October 27 that could have a significant impact on the S&P 500:
Apple Inc. (AAPL) - October 28
Amazon (AMZN) - October 29
Microsoft Corp. (MSFT) - October 30
Alphabet Inc. (GOOGL) - October 31
Berkshire Hathaway Inc. (BRK.B) - November 1
S&P futures Contract Chart
Daily Chart of S&P Futures
I have highlighted multiple touches of the 20 day simple moving average on the S&P futures chart and a potential target price.

The market maker implied move for the week is +/- 93 points.
S&P futures Daily chart
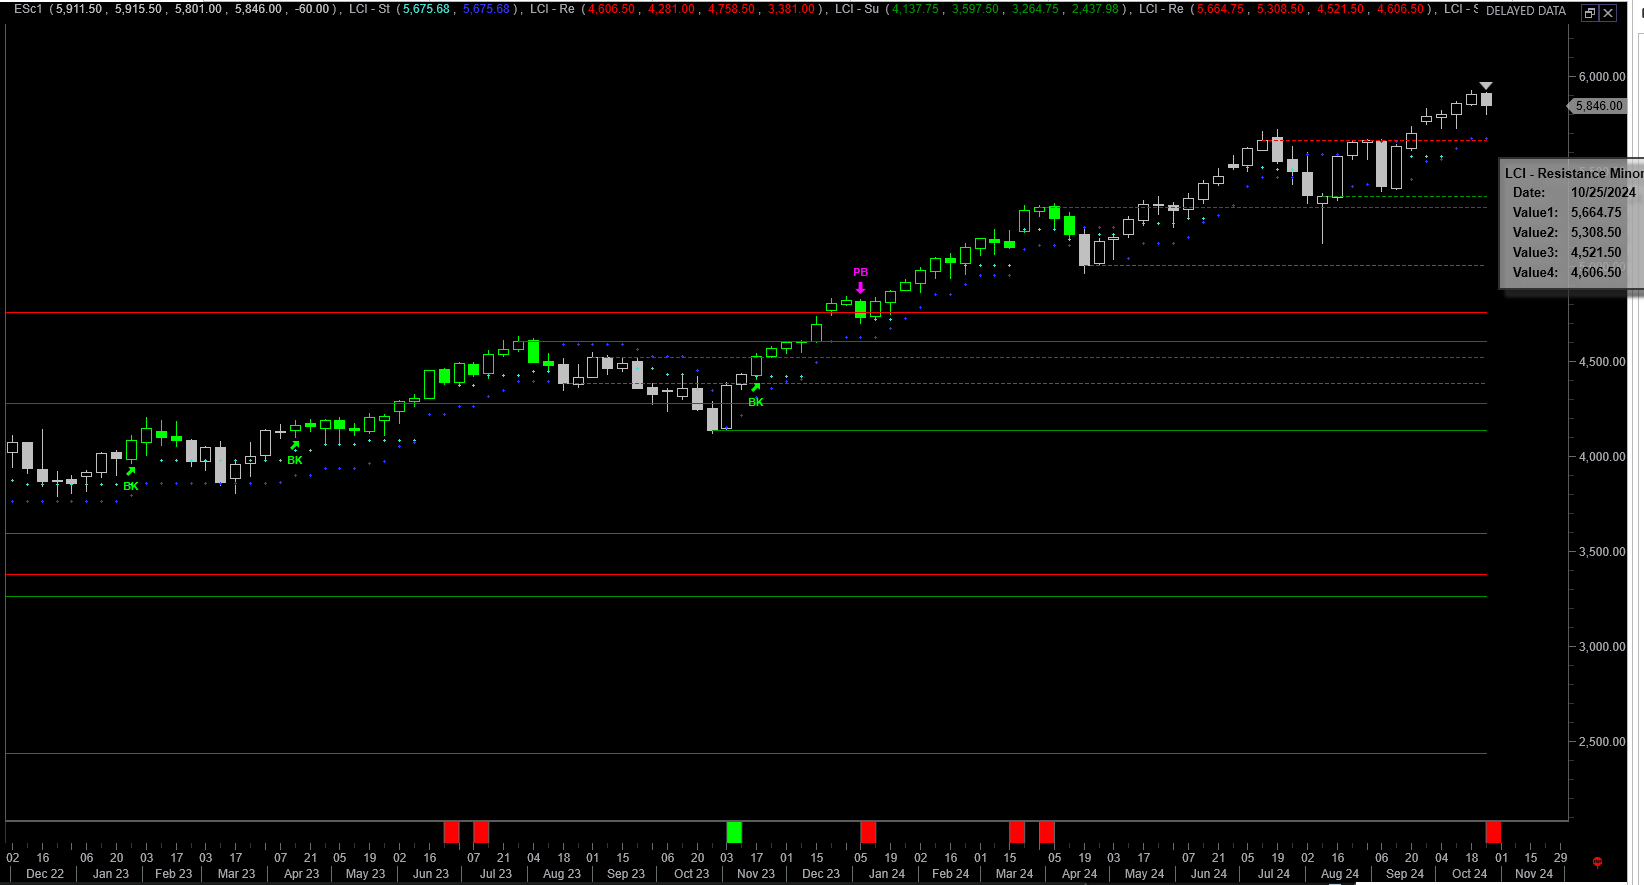
I have highlighted key support resistance levels on the chart below:

S&P futures Weekly chart
I have highlighted potential targets on the weekly S&P chart.
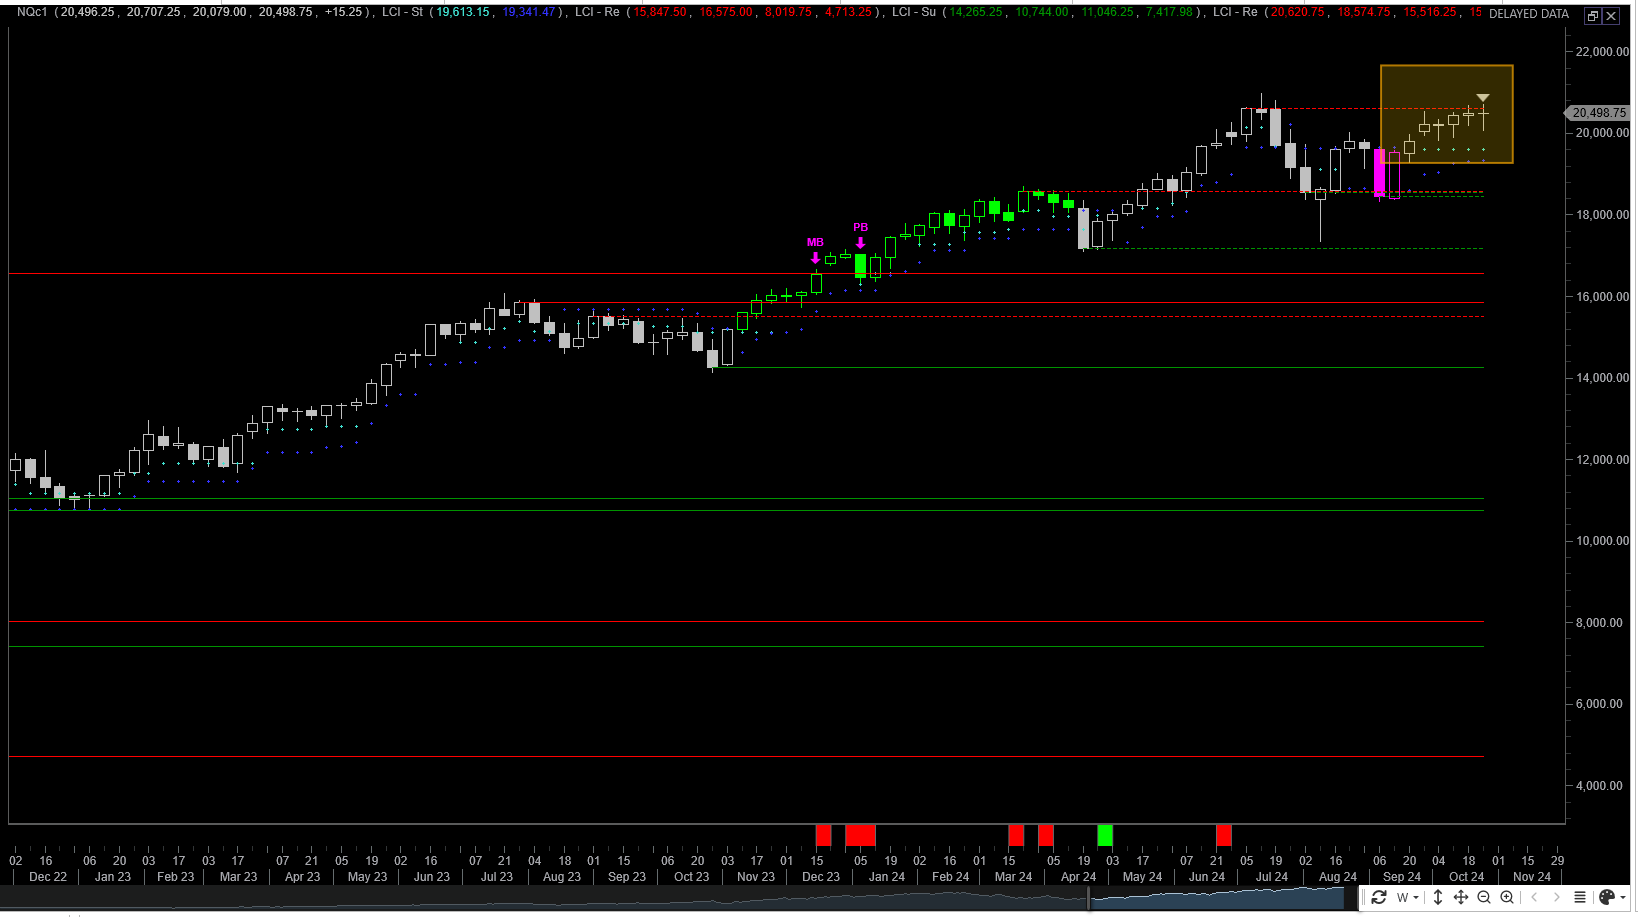
NQ futures Chart
The NQ futures are close to a previous high made in July 2024. Currently the price is approximately 400 points below this high.
NQ futures Daily chart
The nazdaq 100 futures continue weaken as demonstrated by the weekly trend strength. The trend strength is 15. There has been no change in the last couple of weeks. Generally a market is considered trending when the ADX is above 20.

The Average Directional Index (ADX) is a tool used in technical analysis to measure the strength of a trend in the stock market, regardless of its direction. Here’s a simplified explanation:
What it does: ADX doesn’t tell you whether the market is going up or down, but it helps determine how strong the current trend is. A high ADX value indicates a strong trend, while a low value suggests the market is moving sideways or without a clear direction.
How it works: The ADX typically moves between 0 and 100:
Below 20: The market is not trending (sideways or weak trend).
Above 25: A trend is starting to develop.
Above 50: The trend is very strong, whether it’s up or down.
The chart below represents the TRIX. This is a momentum indicator. We can observe that the momentum has started increasing to the upside. It is noteworthy that the momentum is making lower highs. A trendline is drawn showing this point. The last peak was in July 2024. This also was the peak for the nazdaq futures.
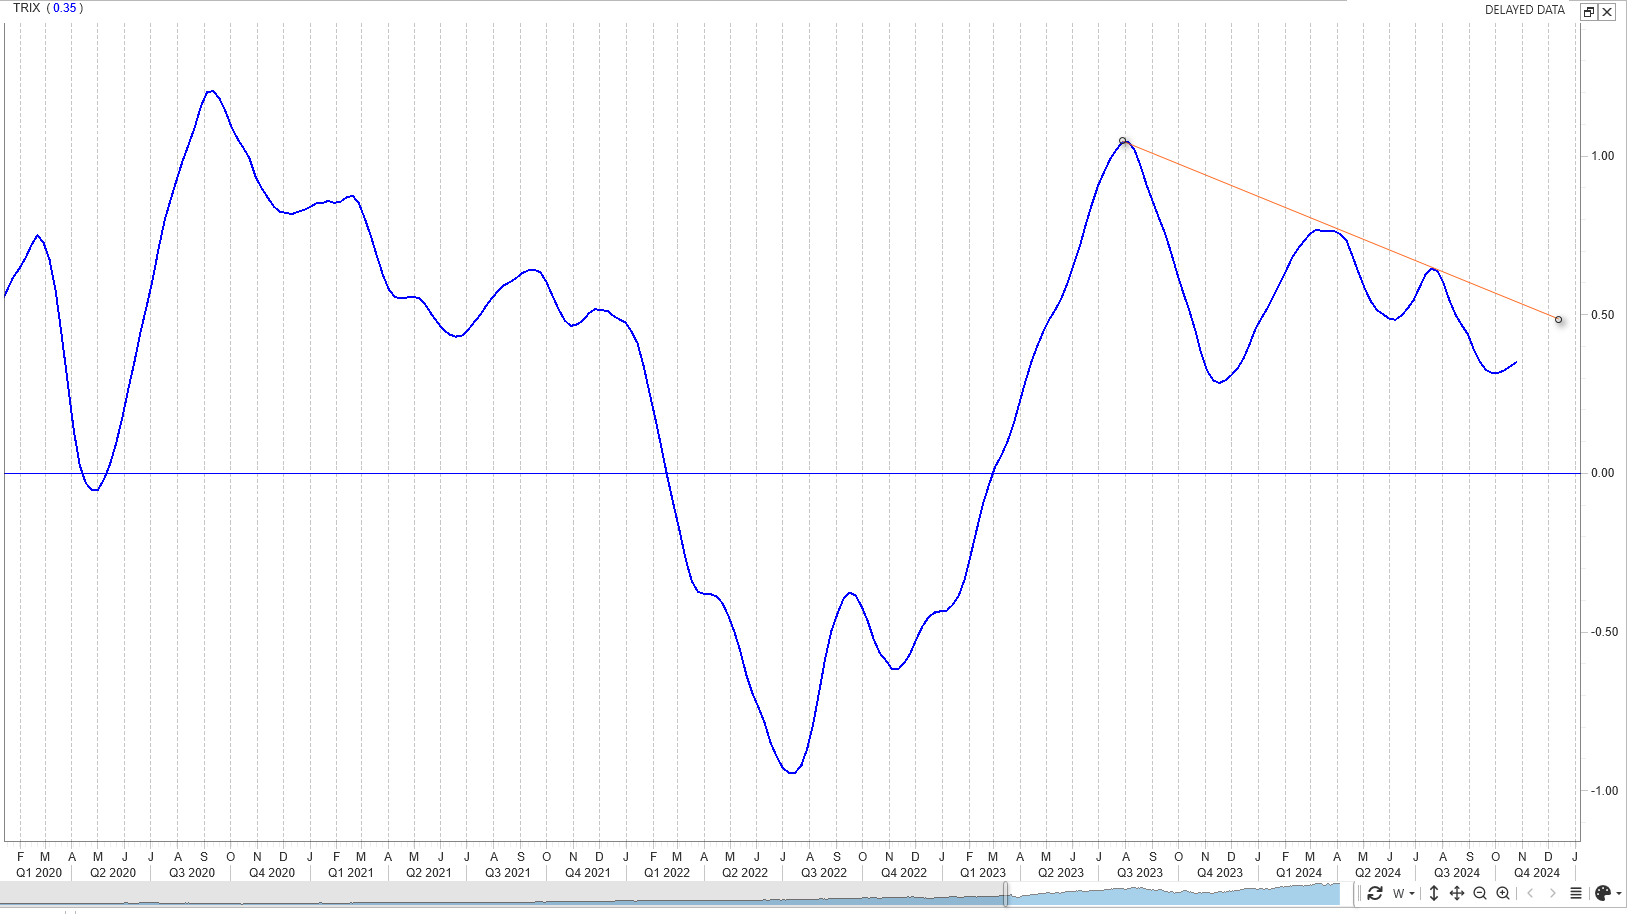
The nazdaq has been in a trading range for the last 6 weeks. I have highlighted the area. The declining momentum and weakening trend confirm this action.
The Weekly Plan
The S&P had its first declining week in the last six. As long as the S&P futures remain above 5665 this is a continued bullish trend.
Sample Weekly Idea
The S&P futures are approximately 50 points higher than the S&P 500 cash index. My trade for the week is in the S&P 500 cash index.
Last week I also had a bearish put spread. This spread was monetiezed on 10/23, the S&P declined 87 points.
For the week, I have again put on a long Bear Put spread in S&P cash index between 5800/5700. I sold an SPX Bear Call spread to help finance this trade. The spread is 5930/5940 for two weeks out.
Although, the current market trend is still bullish, it does remains below the daily 5 day SMA and 8 day SMA. It does rest slightly above 20 day SMA. The S&P price trend has weakened over the last week.
Thank you for reading my weekly plan.
Have a successful trading week, by waiting for your trade setups to come to you and managing risk.
Disclaimer
Trading involves Risk. Please don’t follow my idea blindly. Do your own due dilligence before you attempt to trade.
Joel